AMAP Greenland and the Faroe Islands 1997-2001
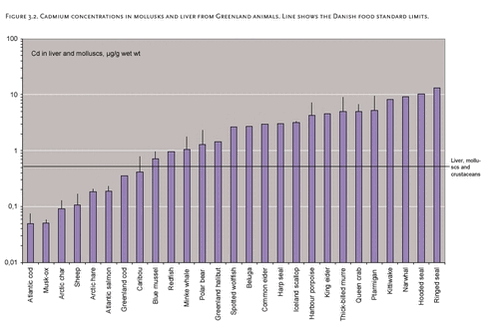
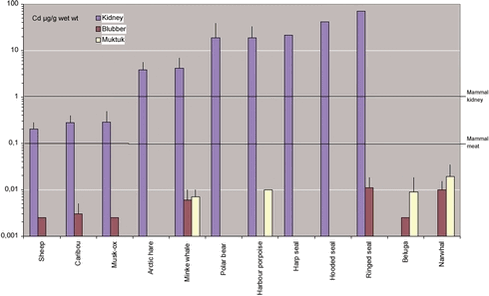
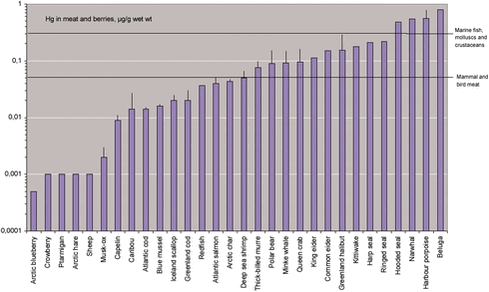
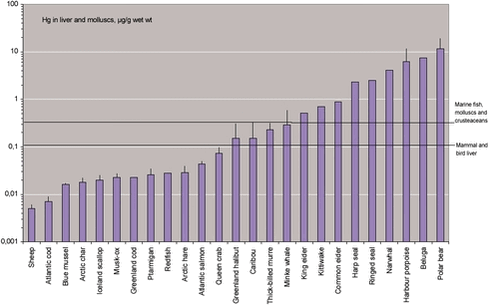
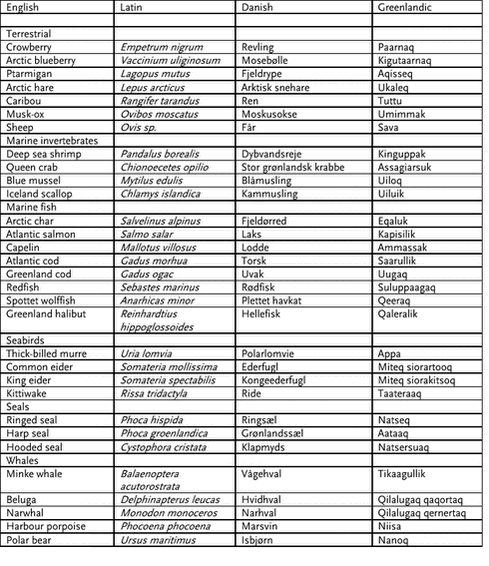
3 Contaminants in Subsistence Animals in Greenland3.1 Introduction3.2 Methods 3.2.1 Sampling 3.3 Results 3.3.1 Metals 3.3.2 Organochlorines (OCs) 3.4 References by Poul Johansen , Derek Muir , Gert Asmund, and Rune Dietz 3.1 IntroductionIn general people in Greenland are more exposed to contaminants from their diet than people in Europe and North America. The reason is that marine traditional food items (fish, seabirds, seals and whales) are much more important in Greenland, and at the same time that some of these food items have high levels of contaminants, i.e. metals like mercury and cadmium and organochlorines like PCBs. Within the Arctic, Greenlanders have the highest concentrations of mercury and PCBs (Hansen 1998). Some knowledge of contaminant concentrations in the diet of Greenlanders has been available for some years, but a study to systematically survey the traditional diet was not initiated until 1999. This paper is based on results from the diet study and on data published elsewhere. In the text, tables and figures, the names of the species are called by their English name solely, but to facilitate the understanding their Latin, Danish and Greenland names are shown in Appendix 3.1. 3.2 Methods3.2.1 SamplingThe methods of sampling and analysis of contaminants in the diet study is described in the second volume af this report (Riget et al. 2003), in which the results are also presented more detailed than here. The purpose of this document is to assess contaminant levels in the diet in relation to human exposure. The focus in the diet study has been on Southwest Greenland, which is the most densely populated part of Greenland. Almost all samples are from this region, between Paamiut in the south to Qeqertarsuaq in the north. Many samples were collected in important areas and seasons for hunting. For examples samples from seabirds were obtained from hunting during winter in Nuuk as the most important region for hunting seabirds when they winter off Southwest Greenland. In this way samples are considered representative of the hunt and thereby of the human exposure to contaminants in the tissue and species in question. All metal and organochlorine levels are presented on a wet wt basis with arithmetic means and standard deviations shown. This has been chosen, because the arithmetic mean will represent the average human exposure to the contaminant in question from the diet (Johansen et al. 2000), provided that the meal is selected irrespective of age, sex and region. In some cases these factors are known to affect contaminant levels, for example cadmium levels are known to increase with the age of seabirds and seals (Dietz et al. 1996). Also PCB and DDT levels are higher in male ringed seals than in females and higher in East Greenland than in West Greenland (Table 3.1 and 3.2). 3.3 Results3.3.1 MetalsBelow we will compare the metal levels with Danish standard limits for heavy metals in food (Anon. 1995). These regulations are not in force in Greenland, but the limits may be used as a reference point in assessing the levels found in Greenland food items. We also discuss the human intake of the metals and compare these to the PTWI (Provisional Tolerable Weekly Intake) set by FAO/WHO and shown in Table 3.3. Table 3.4 lists levels of lead, cadmium, mercury and selenium in marine, freshwater and terrestrial species from Greenland. These were extracted from a Greenland contaminant database (Dietz et al. 1996, Dietz et al 1997, Riget et al. 2000) and from the diet study initiated in 1999. Data from all regions in Greenland are included, but only for datasets with at least 4 individuals analyzed. 3.3.1.1 Lead Mean lead concentrations range from below 0.01 µg/g wet weight in marine fish meat to 0.337 µg/g in caribou liver (Table 3.4). From the same species levels are higher in liver (and kidney) than in meat. However, all lead concentrations may be considered low and are lower than the Danish standard limits for heavy metals in food ranging from 0.3 to 1 µg/g wet weight (Dietz et al. 1996). In a study in West Greenland, the mean human intake of lead from marine food is estimated to 15 µg per person per week (Johansen et al. 2000), which is well below the PTWI as may be seen in Table 3.3. However, the use of lead shot in Greenland may increase human lead intake considerably. In a study of breast meat of thick-billed murre (Uria lomvia) killed with lead shot, the mean lead concentration was 0.22 µg/g and it was estimated that eating one bird would result in an intake of 50 µg lead (Johansen et al. 2001). Later however, we have found that the actual lead intake by eating birds hunted with lead shot is significantly higher. By analyzing whole breasts, the mean lead concentration was 0.73 µg/g in murres and 6.1 µg/g in common eiders (Johansen et al. 2002). This implies that only one eider meal will result in a lead intake close to the PTWI. For murre the lead intake from one meal will be about 10% of the PTWI. We conclude that birds hunted with lead shot are a significant lead source, probably the most important, in the diet of many people in Greenland. From a study among Baffin Island Inuit (Chan et al. 1995) a mean weekly intake of lead by adults may be calculated to 469 µg for women and 595 µg for men. This is much higher than the Greenland estimate, mainly because lead levels reported in local food in the Baffin Island study are significantly higher than in the Greenland study. WHO (1995) has estimated that lead intake for adults worldwide range from 105 to 2212 µg per week. In Canada the dietary intake of lead may be calculated to 168 µg per week for a 60-kg person (Health and Welfare Canada 1989). This is almost similar to the estimated intake in Denmark of 162 µg per week (Anon. 1995). In Denmark cereals, vegetables, fruit and beverages are the dominant lead sources in the food. 3.3.1.2 Cadmium The mean cadmium concentration range from below 0.01 µg/g wet wt in berries and meat from fish and terrestrial mammals to 70.4 µg/g in ringed seal kidney. In the same species levels are lowest in the meat, higher in the liver and highest in the kidney (Table 3.4). Cadmium levels are generally higher in the marine than in the terrestrial environment. In terrestrial species high cadmium levels are only found in ptarmigan (liver) and hare (kidney). Figure 3.1-3.3 compare the mean cadmium concentrations found in Greenland with the Danish food standard limits (FSL). In meat (Fig. 3.1) levels are below the FSL, except for ptarmigan, narwhal, common eider, ringed seal, king eider and kittiwake with mean levels up to about 5 times the FSL. But in liver (Fig. 3.2) and kidney (Fig 3.3) most levels exceed the FSL, up to about 70 times the FSL. In liver only terrestrial mammals, Atlantic cod, Arctic char, Atlantic salmon and Greenland cod have cadmium levels below the FSL, and in kidney this is only the case for sheep, caribou and musk-ox. In fat, blubber and muktuk cadmium levels are very low. The mean human intake of cadmium from marine food in West Greenland has been estimated to 1004 µg per person per week, which is about twice the PTWI (Johansen et al. 2000). Seal liver is the dominant source for cadmium intake from local marine food in Greenland, but seal meat and seabird liver is also important. Other sources (fish meat and liver, whale meat, liver and skin and seabird meat) each are below 10% of the total estimated intake and thus of minor importance. In the Canadian Eastern Arctic the mean cadmium intake by Inuit has been calculated to 1008 µg for women and 1183 µg for men (Johansen et al. 2000, based on a study by Chan et al. 1995). These figures are very close to the Greenland estimate (1004 µg) and significantly above the PTWI. In Canada the dietary intake of cadmium may be calculated to 88 µg per week for a 60-kg person (Heath and Welfare Canada 1989). This is close to the estimated intake in Denmark: 102 µg per week with cereals, vegetables, meat and plucks and beverages as the main sources (Anon. 1995). As may be seen the mean cadmium intake in Greenland from local marine food is about 10 times higher than in Canada and Denmark. 3.3.1.3 Mercury The mean mercury concentration range from below 0.01 µg/g wet weight in meat from all terrestrial species except caribou to 18.1 µg/g in polar bear kidney (Table 3.4). Except for fish, the mercury concentration is higher in liver than in meat of the same species, and levels are generally higher in the marine than in the terrestrial environment. In Figure 3.4-3.6 the mean mercury concentrations are compared to the Danish food standard limits (FSL). Except for caribou liver, no mercury levels exceed the FSL in any tissue of the terrestrial species, whereas in marine species mercury levels exceed the FSL in most cases. The mercury concentration is only below the FSL in mussels, crustacean, fish meat and fish liver. In fat and blubber from mammals and in muktuk from minke whale mercury levels are below the FSL for meat, whereas levels in muktuk from toothed whales exceed this limit. The mean human intake of total mercury from marine food in West Greenland has been estimated to 846 µg per person per week, which is almost 3 times the PTWI (Johansen et al. 2000). Seal liver is the dominant source and seal meat is important for mercury intake from the local diet in Greenland. Other sources (fish meat and liver, whale meat, liver and skin and seabird meat) each are below 10% of the total estimated intake and thus of minor importance. In the Canadian Eastern Arctic the mean mercury intake by Inuit has been calculated to 854 µg for women and 1162 µg for men (Johansen et al. 2000, based on a study by Chan et al. 1995). These figures are very close to the Greenland estimate (1004 µg) and significantly above the PTWI. In Denmark the intake of total mercury from food is much lower than in Greenland. It has been estimated to 35 µg per person per week with fish as the most important source (Anon. 1995). 3.3.1.4 Selenium The mean selenium concentration range from less than 0.3 µg/g-wet wt in berries and meat from most terrestrial mammals to 16.9 µg/g in whale skin (Table 3.4, Figure 3.7-3.9). In the same species the concentration is higher in the liver than in the meat. Selenium levels are higher in the marine than in the terrestrial environment, as is also seen for mercury. Selenium is an essential trace mineral and has experimentally been shown to reduce the toxic response in the nervous system associated with exposure to mercury (WHO 1990), but the efficacy of selenium as an antidote against mercury toxicity in humans is controversial (Magos 1991). It is however notable that in all tissues of Greenland animal groups with high mercury levels (e.g. marine mammals and seabirds) selenium is present in substantial surplus to mercury on a molar basis, indicating an association between mercury and selenium (Dietz et al. 1996). A PTWI for selenium has not been set. Yang et al. (1989) suggested 400 µg per day as the maximum daily safe intake, equaling 2800 µg per week. Whale skin is the dominant selenium source in Greenland food, constituting more than 80% of the calculated intake (Johansen et al. 2000). From this source alone the selenium intake is above the limit suggested. The calculated intake from whale skin in Greenland however may be somewhat overestimated. Next to whale skin, the most important selenium sources in Greenland are seal liver and meat from seals and seabirds. The total selenium intake is estimated to 4569 µg per person per week. In Denmark the selenium intake from food has been estimated to 343 µg per week with meat, plucks, fish, egg, milk, cheese and cereals as the most important sources (Anon. 1995), which is much lower than the intake in Greenland. The Danish intake is close to the recommended intake from food of 350 µg per week in Denmark (Anon. 1995). 3.3.2 Organochlorines (OCs)Prior to 1999 only few analyses for organochlorines had been conducted in Greenland. We have not included these in this paper, because only few are important to human diet, and because some of the older data cannot be compared to the data obtained in the diet study initiated in 1999. In this study chemical groups analyzed include PCBs (sum of 104 congeners; SPCB), DDTs (sum of 6 DDT-related compounds; SDDT), chlordane, toxaphene (total and selected congeners), HCH, chlorbenzenes, mirex, octachlorostyrene, and endosulfan. A subset of the samples is also analyzed for coplanar PCBs, BPDE, CDPE, SCCP and TBT. The analytical results for major organochlorines found in species analyzed so far are shown in Table 3.5-3.6. Figure 3.10-3.12 presents the results for S PCBs, Figure 3.13-3.15 for SDDTs and Figure 3.16 for toxaphene. Almost without exception OC levels are lower in the terrestrial than in the marine environment. The highest OC concentrations are found in fat tissues of marine mammals, whereas fat of terrestrial mammals has low concentrations. Otherwise there are no systematic variations in OC concentrations in different tissues. In some mammal and bird species concentrations are highest in the liver, but in other species it is opposite. In a recent study OC data have also become available for fat from polar bear sampled 1999-2001 in Ittoqqortormiit, East Greenland. The SPCB concentration in these were the highest observed in recent Greenland samples with a mean level of 5708 µg/g wet weight in 9 females and 5892 µg/g in 10 males (Riget et al. 2003). Mean concentrations of SPCB10 in ringed seal blubber were very similar to levels reported by Cleeman et al. (2000) for West Greenland (Qeqertarsuaq). Levels of SPCBs (and SPCB10) in ringed seal blubber were also similar to results from E. Baffin Island (Pangnirtung) but lower than reported in N. Quebec, Labrador or Ittoqqortormiit (Muir et al. 1999; AMAP 1998). Mean levels of SPCBs (and/or S PCB10) in kittiwake liver were similar to reports for Svalbard but lower than found at Bear Island and in Franz Josef Land. Mean levels of SPCBs in common eider were similar to reports for Svalbard. Musk-ox liver from Banks Island in the western Canadian arctic had similar levels of SPCB10 to those found in Greenland animals (AMAP 1998). There were few other data with which to compare the results from Greenland with the same species in other locations in the Arctic. At this stage data are too incomplete for comprehensive calculations of human intakes of OCs in Greenland, but provisional estimates can be made. Calculations have been done for the Baffin Island community of Broughton Island (Qikiqtarjuaq) by Kuhnlein et al (1995, cited from Jensen et al. 1997), who also have compared the intakes to Tolerable Daily Intakes (TDI) of OCs. They conclude that the mean intake value of DDTs is well below the TDI (a factor of about 100) and that the mean intake values of chlorbenzenes, HCH, dieldrin and PCB are within a factor of 10 of the TDI for these contaminants. However for chlordane and toxaphene, the mean intakes exceed the TDI by nearly ten-fold. TDIs are calculated by dividing the NOAEL (no observed adverse effect level) from laboratory animal bioassays by an appropriate uncertainty factor to take into account the range of susceptibility of the human population (Calabrese 1985). The Canadian TDI’s for chlordane (sum of oxychlordane, cis- and trans-chlordane and cis- and trans-nonachlor) of 0.05 µg kg bw-1 d-1 and toxaphene (quantified with the technical toxaphene standard) of 0.2 µg kg bw-1 d-1 are low reflecting a high uncertainty factor (1000) compared to PCBs (100) (Gilman et al. 1997). Future research may lower this uncertainty factor for chlordane and toxaphene. Also changes in methods of analysis of toxaphene involving the use of individual congeners rather than an estimate based on the total mixture, is showing that toxaphene levels are much lower than reported if quantified with the technical material (deGeus et al. 1999). This study has developed data on OC concentrations in a wide range of important species in Greenland. There are very limited or no previous data for OCs in many of these species in the circumpolar Arctic. 3.4 ReferencesAMAP Assessment Report. 1998. Arctic Pollution Issues, Chapter 6. Arctic Monitoring and Assessment Program, Oslo. Anon. (1995) Overvågningssystem for levnedsmidler 1988-1992. Levnedsmiddelstyrelsen, Mørkhøj Bygade 19, DK-2860 Søborg, Denmark. Publikation nr. 232. Calabrese, E.J. (1985) Uncertainty factors and inter-individual variation. Regul. Tox. Pharmacol. 5, 190-196. Chan, H.M., Kim, C., Khoday, K., Receveur, O. and Kuhnlein, H.V. (1995) Assessment of dietary exposure to trace metals in Baffin Inuit foods. Environ. Health Perspect. 103(7-8), 740-746. de Geus, H-J., Besselink, H., Brouwer, A., Klungsøyr, J., McHugh, B., Nixon, E., Rimkus, G.G., Wester, P.G., de Boer, J. (1999) Environ. Hlth Perspect. 107, 115-144. Dietz, R., Riget, F. and Johansen, P. (1996) Lead, cadmium, mercury and selenium in Greenland marine animals. The Science of the Total Environment 186, 67-93. Dietz, R., Johansen, P., Riget, F. and Asmund, G. (1997) Data on heavy metals in the Greenland marine environment before 1994. AMAP Greenland 1994-1996. Environmental Project No. 356. Ministry of Environment and Energy. Danish Environmental Protection Agency. Pp. 247-350. FAO/WHO (1972) Evaluation of Certain Food Additives and the Contaminants Mercury, Lead and Cadmium. WHO Technical Report Series. No. 505. FAO/WHO (1989) Evaluation of Certain Food Additives and Contaminants. WHO Technical Report Series. No. 776. FAO/WHO (1993) Evaluation of Certain Food Additives and Contaminants. WHO Technical Report Series. No. 837. FAO/WHO (2000) Evaluation of Certain Food Additives and Contaminants. WHO Food Additive Series: 44. Gilman, A. et al. (1997) Human Health. Chapter 4 In: Jensen, J., Adare, K. and Shearer, R. (Eds.) Canadian Arctic Contaminants Assessment Report. Indian and Northern Affairs Canada. Pp. 301-377. Hansen, J.C. (1998) Pollution and Human Health. In: AMAP Assessment Report: Arctic Pollution Issues. AMAP, Oslo Norway, pp. 775-844. Heath and Welfare Canada (1989) Lead and Human Health. Health Protection Branch, Ottawa. Jensen, J., Adare, K. and Shearer, R. (Eds.) (1997) Canadian Arctic Contaminants Assessment Report. Indian and Northern Affairs Canada. 460 pp. Johansen, P., Asmund, G. and Riget, F. (2001) Lead contamination of seabirds harvested with lead shot – implications to human diet in Greenland. Environmental Pollution 112, 501-504. Johansen, P., Asmund, G. og Riget, F. (2002) Blykontaminering af havfugle i Grønland fra jagt med blyhagl. Danmarks Miljøundersøgelser. 34s. Faglig rapport fra DMU nr. 408. Johansen, P., Pars, T. and Bjerregaard, P. (2000) Lead, cadmium, mercury and selenium intake by Greenlanders from local marine food. The Science of the Total Environment 245, 187-194. Kuhnlein, H.V., Receveur, O., Muir, D., Chan, H.M. and Soueida, R. (1995) Arctic Indigeneous women consume greater than acceptable levels of organochlorines. J.Nutr. 125, 2501-2510. Magos, L. (1991) Overview on the protection given by selenium against mercurials. In: Suzuki, T., Imura, N. and Clarkson, T. (Eds.), Advances in Mercury Toxicology, pp. 289-297. Muir, D., Kwan, M. and Lampe, J., 1999. Spatial trends and pathways of POPs and metals in fish, shellfish and marine mammals of northern Labrador and Nunavik. Synopsis of Research Conducted Under the 1998/99 Northern Contaminants Program, Environmental Studies Rept. Ottawa: Indian and Northern Affairs Canada. pp. 165-171. Riget, F., Dietz, R., Johansen, P. and Asmund, G. (2000) Cadmium, mercury, lead and selenium in Greenland marine biota and sediments. The Science of the Total Environment 245, 3-14. Riget, F., Christensen, J., and Johansen, P. (eds) (2003) AMAP Greenland and the Faroe Islands. The Environment of Greenland. Danish Environmental Protection Agency. The Danish Ministery of the Environment. WHO (1990) Environmental Health Criteria Vol. 101. Methylmercury. International Programme on Chemical Safety, Geneva. 144 pp. WHO (1995) Environmental Health Criteria Vol. 165. Inorganic Lead. International Programme on Chemical Safety, Geneva. Yang, G., Yin, S., Zhou, L., Gu, B., Yan, Y. Liu and Liu, Y. (1989) Studies of safe maximal daily dietary Se-intake in a seleniferous area. J. Trace Elem. Electrolytes Health Dis. 3, 123-130.
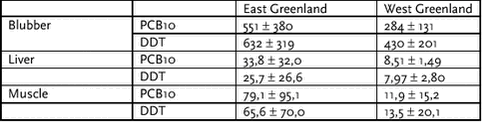
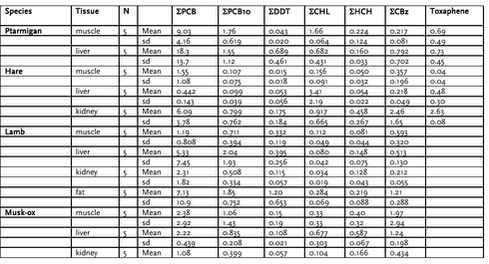
Table 3.1. Organochlorines in ringed seal blubber from East and West Greenland in 1994, arithmetic means ± SD in µg/kg wet weight (Cleemann et al. 2000). PCB10 is the sum of congeners (28, 31, 52, 101, 105, 118, 138, 153, 156 and 180). DDT is the sum of pp DDE, pp DDD and ppDDT.
Table 3.2. Organochlorines in ringed seal tissues from East and West Greenland in 1999, arithmetic means ± SD in µg/kg wet weight (this study).
Table 3.3.Provisional Tolerable Weekly Intake (PTWI) of lead, cadmium and mercury.
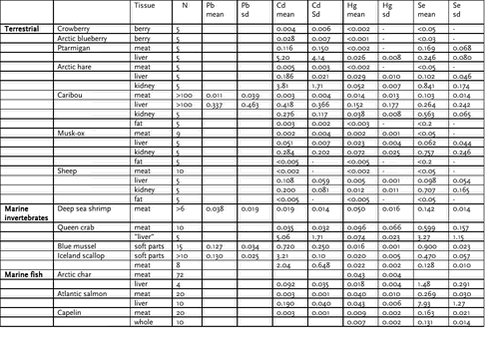
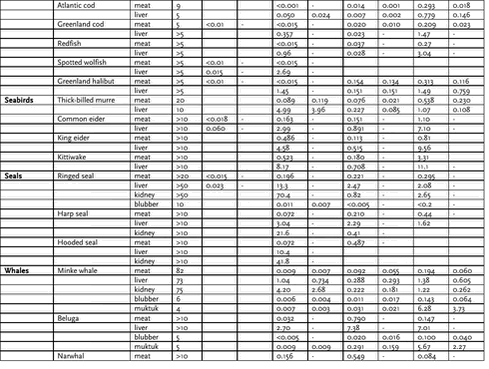
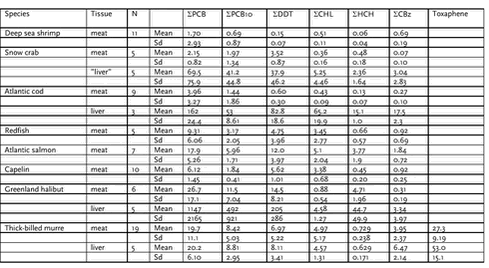
Table 3.4. Pb, Cd, Hg and Se concentrations (µg/g wet wt) in West Greenland species. In cases where no standard deviation is given, the mean is below the detection limit or is a mean of 2 or more datasets. Hg is total Hg.
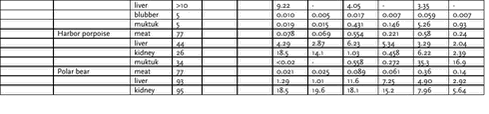
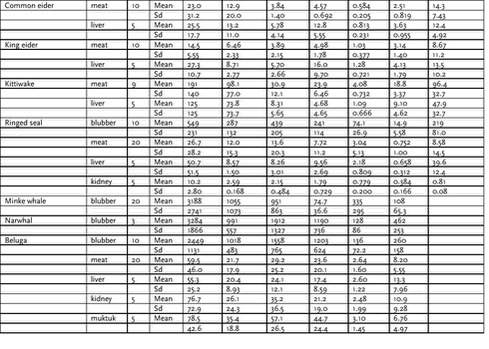
Table 3.5. Mean concentrations of major organochlorines in marine species from West Greenland (ng/g wet wt). PCB10 is the sum of congeners 28, 31, 52, 101, 105, 118, 138, 153, 156 and 180. the sum of oxychlordane, trans-chlordane, cis- chlordane, cis-chlordane and trans-nonachlor. Toxaphene is Total toxaphene (quantified with the technical toxaphene standard).
Table 3.6. Mean concentrations of major organochlorines in terrestrial species from West Greenland (ng/g wet wt). For explanation of contaminants see text to table 4.
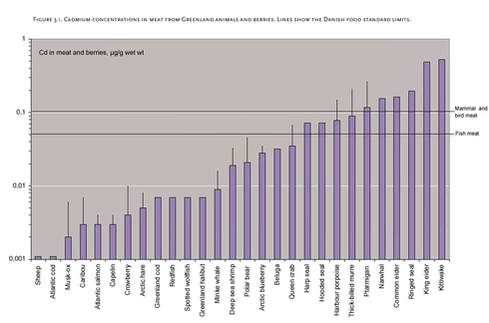
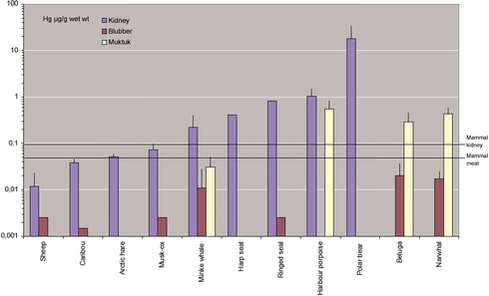
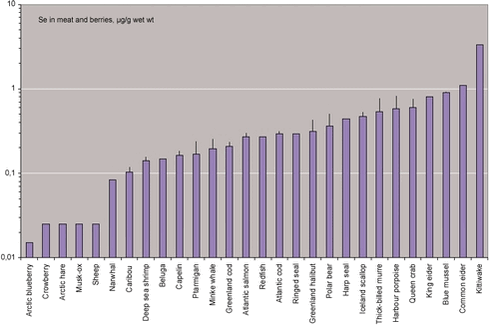
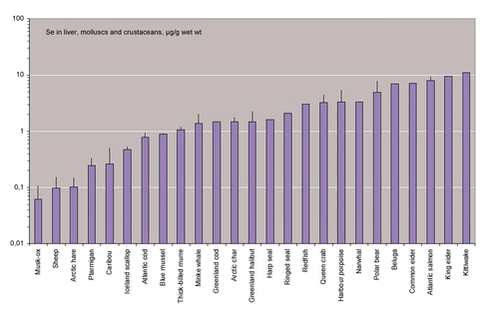
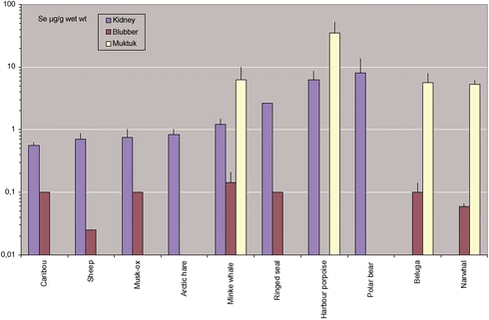
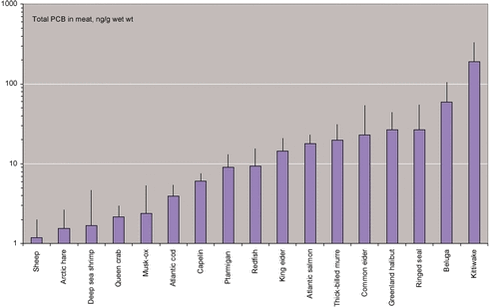
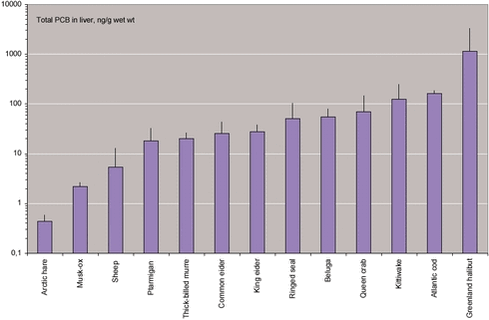
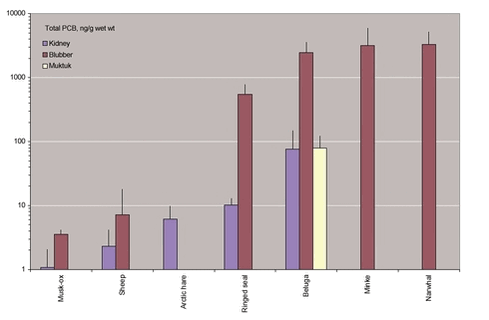
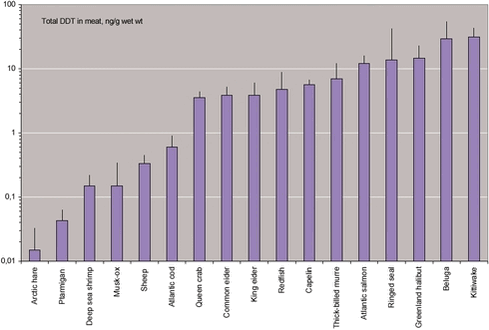
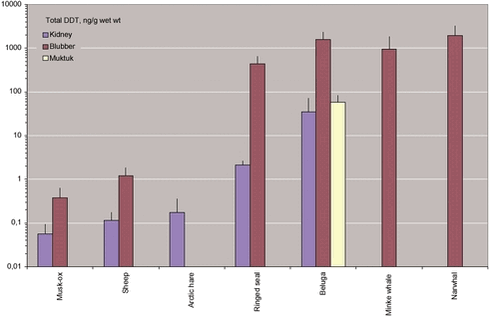
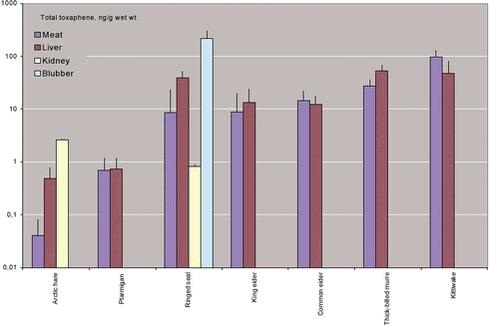
Figure 3.3. Cadmium concentrations in kidney, blubber and muktuk from Greenland animals. Lines show the Danish food standard limits. Figure 3.4. Mercury concentrations in meat from Greenland animals and berries. Lines show the Danish food standard limits. Figure 3.5. Mercury concentrations in mollusks and liver from Greenland animals. Lines show the Danish food standard limits. Figure 3.6. Mercury concentrations in kidney, blubber and muktuk from Greenland animals. Lines show the Danish food standard limits. Figure 3.7. Selenium concentrations in meat from Greenland animals and berries. Figure 3.8. Selenium concentrations in mollusks and liver from Greenland animals. Figure 3.9. Selenium concentrations in kidney, blubber and muktuk from Greenland animals. Figure 3.10. Total PCB concentrations in meat from Greenland animals.Figure 3.11. Total PCB concentrations in liver from Greenland animals. Figure 3.12. Total PCB concentrations in kidney, blubber and muktuk from Greenland animals. Figure 3.13. Total DDT concentrations in meat from Greenland animals. Figure 3.15. Total DDT concentrations in kidney, blubber and muktuk from Greenland animals. Figure 3.16. Total toxaphene concentrations in meat, liver, kidney, blubber and muktuk from Greenland animals. Appendix 3.1. List of animal species mentioned in the text in English, Latin, Danish and Greenlandic. |