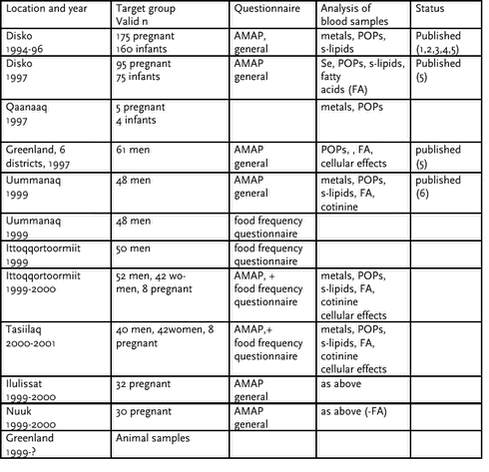
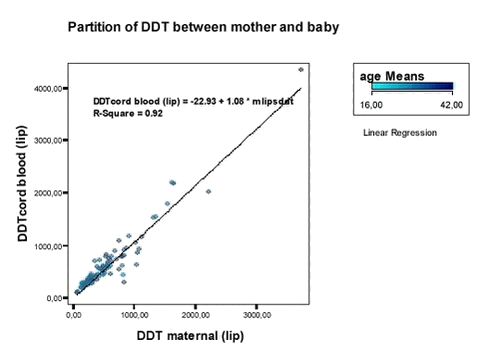
AMAP Greenland and the Faroe Islands 1997-20014 The Human Health Programme in Greenland1997-20014.1 Introduction4.2 Methodology by project/study group. 4.2.1 Pregnant women and infants 1994-97 4.2.2 Pregnant women 1999-2001 4.2.2.3 International guideline values 4.2.3 Pilot study, Geographical distribution of contaminant burden, men from 5 districts in Greenland 1997 4.2.4 Cross sectional study Uummanaq 1999 4.2.5 Men and non- pregnant women East Greenland, 1999-2000. 4.2.6 Dietary Survey, pilot study, 1999 4.3 Results by project/ study group 4.3.1 Pregnant women and infants.1994-2001 4.3.2 Geographical study 1997 4.3.3 Men and non-pregnant women 1999-2000 4.3.4 Percentages of samples exceeding guidelines for blood levels of pollutants 4.3.6 Associations between contaminants and other factors 4.3.7 Dietary exposure from local food items. 4.4 Summary 4.4.1 Heavy metals 4.4.2 Organochlorines 4.4.3 Dietary Markers 4.4.4 Dietary surveys 4.4.5 Dietary exposure from contaminants 4.4.6 Predictors of high contaminant levels 4.4.7 Time trends. 4.5 References Bente Deutch 4.1 IntroductionThe AMAP, Human Health Programme was established in 1992 as part of an international agreement to monitor and assess contaminant levels, trends, and possible health effects among Arctic residents, primarily indigenous peoples. In the Human Health Programme a number of priority or key contaminants were chosen (persistent organic pollutants, POPs, such as dioxins, PCBs DDT and other pesticides and the heavy metals, mercury, cadmium, and lead). A comprehensive summary of the toxicology of the 11 pesticides , the PCBs, and the heavy metals involved is presented in the Human Health chapters of the international AMAP assessment report AMAP: Arctic Pollution Issues (1998) and in the international AMAP assessment Report (2003). The first target group was chosen to be pregnant women and their newborn infants, both of which considered to be especially sensitive to adverse effects from toxic contaminants. The fetus is especially vulnerable to the influence of environmental chemicals because of its rapid development of crucial tissues and organs and since most POPs and metals readily cross the placental barrier from the mother to the fetus. The Human Health Expert Group developed a circumpolar blood monitoring study which used a standardized protocol for sampling in all the Arctic countries and a single laboratory for analyses of all samples for organic pollutants which permitted circumpolar comparison of the monitoring data. The Human Health Programme was implemented in Greenland from 1994. The target area was Disko Bay area where 4 district hospitals participated , Aasiaat, Qasisiannquit, Ilulissat, and Qeqertarsuaq.The protocol of the programme was to contact and include consecutive pregnant women who visited the local district hospital. The women were to be asked to comply to answer a general demographic and lifestyle questionnaire and to permit blood samples from themselves and their newborn infants (cord blood samples). A total of 223 pregnant women were included and blood samples were analyzed from 175 women and 160 infants from the middle of 1994 till autumn1996, phase 1. The collection continued during the interim year 1997 (95 pregnant women and 75 infants). The first partial (n=117) monitoring results of phase 1 were published by Aarkrog et al 1997 (Environmental Project No 356, AMAP Greenland 1994-96) and together with international results in the first AMAP assessment report (“Arctic Pollution Issues”1998). Later more results were included and published by individual authors (Bjerregaard and Hansen 2000, Deutch 1999, Deutch and Hansen 1999, Deutch and Hansen 2000) in various international scientific journals. From comparison with results from the other Arctic countries it was quite clear that the maternal blood levels of organic pollutants among Inuit women from Disko Bay in Greenland were among the highest in the circumpolar study. Greenland ranged highest for all the PCBs and all the pesticides except DDT for which Russia ranged slightly higher (AMAP 1998). These early results are consistent with the mean values obtained for the whole study group (Bjerregaard and Hansen 2000, Deutch and Hansen 2000). A pilot study from 6 districts in Greenland 1997-98 also showed large variations in contaminant levels within Greenland, with particularly high PCB levels among men from Ittoqqortoormiit. The lowest concentrations were found on the South West coast in Nuuk in particular. (Deutch and Hansen 2000). In the assessment of results from Disko Bay 1994-97 and the results from the geographical pilot study it was strongly indicated that high blood levels of organic pollutants were significantly correlated both with dietary habits and smoking. This finding was further investigated and supported by a controlled study among men from Uummanaq (Deutch et al 2002). The high contaminant levels (mercury and PCB) were consistent with high percentages of both men and pregnant women exceeding guidelines. These results have been confirmed by larger study populations from 1999-2000. The total results from the sampling in Greenland , Disko Bay 1994-96 have not yet been published collectively and some of these results are therefore included in the present report for comparison with later samples. Thus this report will include, compare and assess results from all the AMAP Human Health Programmes in Greenland 1994-2002, described in the table 4.1.1 below. Some of the results have already lead to a number of publications elsewhere which are also referred to in the table and listed below. Table 4.1.1. AMAP Human Health Programmes in Greenland 1994-2002. 1.AMAP Assessment report 1998. Arctic Pollution Issues Already during the first phase it was apparent that the intentions to include consecutive pregnancies were not filled since only <48 % of the expected pregnancies during the proposed experimental period in Disko Bay area were included. The percentage varied by location (local district hospital) and time of year. This resulted in potential risk of selection bias (Deutch 1999). Comparison with information from the public birth register of Greenland (Greenland Statistics) showed that the birth weight and other anthropometric factors of the infants were significantly higher among the study group than among the non-included pregnant women. Later during the interim year 1997 and during the phase 2 collection period (1999-2000 ) the percentage of included pregnancies became even lower. Throughout the whole period there were also various compliance problems in filling out questionnaires, loss of information and of blood samples. The collection of samples from pregnant women was very vulnerable due to the lack of resources and lack of permanent personnel at the Greenland hospital system (Bjerregaard and Hansen 2000, Deutch 1999). Concerning spatial and temporal trend studies representative population groups were needed. It was therefor decided in 1999 to supplement the sampling with a less vulnerable target group of randomly selected men and non-pregnant women of the same age group, see below. It was also decided not to perform contaminant determinations on cord blood since all previous results showed strong and consistent correlations between pollutants in maternal and cord blood. The sampling procedure was changed to be performed by a District medical officer who visited the locations for 1-2 weeks and collected the questionnaires and blood samples. This improved the compliance to almost 100 %. Furthermore, from 1999 it was agreed upon by the international Human Health Expert Group to implement the “Human Health Effects Biomarker Programme., which meant that the protocol for blood sampling and analysis was supplemented accordingly. This programme is described in chapter 7, (this volume). All the programmes have been accepted by the ”Ethical Committe for Scientific investigations in Greenland (KVUG). All the above mentioned publications have followed the rules set up by the Danish Environmental Protection Agency(Danish EPA). 4.2 Methodology by project/study group.4.2.1 Pregnant women and infants 1994-974.2.1.1 Purpose. The purpose of the study was to monitor and assess the contaminant levels in pregnant women and their newborn infant in accordance with the Human Health Programme in Greenland. 4.2.1.2 Material The material consists of information collected at four district hospitals in the Disko Bay area, Greenland (Aasiaat, Qasisianquit, Ilulissat, Qeqetarsuaq) concerning potentially 223 mother/infant pairs from a similar number of “consecutive” births during the AMAP phase 1 collection period (medio October 1994 to medio October 1996).The collection of data was continued in Disko Bay area during the interim period 1997 (96 mothers,75 infants). In 1999 the sample collection in Disko Bay was only carried out in Ilulissat, (n=30) but in addition collection was carried out in Nuuk aiming at 150 pregnant women but by medio 2001 samples from only 32 women had been received. In year 1999-2000 additional 8 pregnant woman were included from both Ittoqortoormiit and Tassiilaq. The mothers were of Greenland Inuit, mixed ethnic background, or in a very few cases Danish. There were no formal “a priori” exclusion criteria and the design of the program was to include consecutive/all pregnant women, but it turned out that only about 30- 40 % of the actual number of pregnancies were included and only live born and singleton babies were actually included in the study. The following data were collected: 4.2.1.3 Methods 1. Questionnaires filled out by the mothers during their pregnancy checkup at the hospital at the 32. gestational week. The questionnaires included questions about demographic and anthropometric factors and a number of lifestyle parameters, smoking and drinking habits in particular, and dietary habits with regard to intake of certain traditional food items, before and during their pregnancy. The questionnaires were formulated in Danish or Inuit language (West Greenlandic dialect) and the women could be assisted by a nurse or midwife in filling out the questions. 2. Blood samples were taken from the pregnant women during the same visit and later from the umbilical cord of the newborn baby. The samples were frozen and sent to Denmark for further treatment. The Blood samples were analyzed for heavy metal content (Cd, Hg (as total mercury), and Pb in whole blood, Cu, Se, and Zn in plasma, (Cd only from mothers)) and measured in microgram per litre. The heavy metal-analysis took place at . “The National Environmental Research Institute, Dept. Of Arctic Environment, Roskilde, Denmark.” The organochlorines were determined at “ Le Centre de toxicologie, Institut National de Santè Publique du Quebec, Canada” according to the consensus in the AMAP, Human Health Expert Group (AMAP 1998). The following organochlorines were analyzed in plasma: 11 pesticides; aldrin, $-HCH, alphachlordane, gammachlordane, cis-nonachlordane, DDE, DDT, hexachlorbenzene, mirex, oxychlordane, transnonachlordane and 14 PCB-congeners 28, 52, 99, 101, 105, 118, 128, 138, 153, 156, 170, 180, 183, and 187, as well as aroclor-1260 a sum variable of PCB-compounds. From 1997 toxaphenes were included (parlars 26, 32, 50, 62, 69).The concentrations were measured in µg/l and calculated in microgram per kilogram total plasma lipid. Both the wet weight and the lipid weight contaminant levels will be presented below. 4.2.2 Pregnant women 1999-20014.2.2.1 Material From 1999 only blood from pregnant women were analyzed. Umbilical cord blood samples were no longer analyzed for contaminants since the results of the first and interim collections phases showed high and consistent correlations between contaminants in maternal and cord blood, see figure 4.2.1. 4.2.2.2 Methods From 1999 and onwards the plasma fatty acids were analyzed at “The University of Guelph, Biological laboratory, Guelph, Canada” and the method used plasma phosholipids. (The previous samples from 1994-1997 total plasma fatty acids were determined by Gas liquid Chromatography at “The Department of Environmental and Occupational Medicine, Aarhus University” according to the method described by (Tjønneland et al 1993)). The two methods were compared in samples from 48 men from Uummanaq and were found to be highly consistent. However, fatty acid content of phospholipids are supposedly less subject to day to day variations than total plasma fatty acids. Figure 4.2.1. Correlation between DDT in maternal and cord blood (lipidadjusted, microgram/kg lipid)from 175 mother/infant pairs Disko Bay 1994-96.
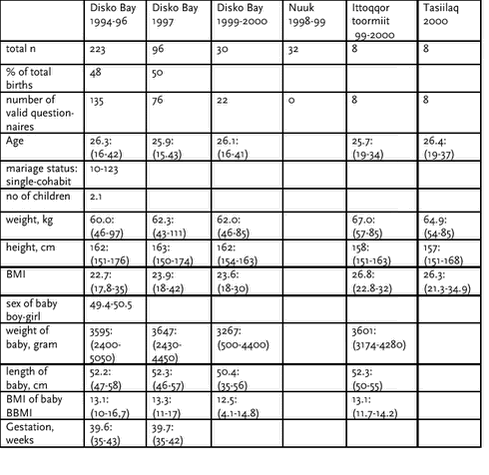
The raw data from questionnaires, results of blood sample analyses, heavy metals, organochlorines, fatty acids and other blood lipids were collected at the Centre of Arctic Environmental Medicine(CAM), Department of Environmental and Occupational Medicine, Aarhus University, where the data were stored and analysed. All the answers were collected and stored in the SPSS statistics program version 6.1 and later versions presently 10. The data belongs to the Danish Environmental Protection Agency. Permission was given to use the data for research, as a special register which was transferred to CAM by August 1997. Descriptive statistic analyses were performed of all the included variables. It was evident from the beginning that there was a high ratio of missing values in the data, Both in terms of lost blood samples resulting in no contaminant results or in terms of missing questionnaires or incomplete answering of questionnaires. This lack of compliance was particularly noticeable for lifestyle questions mainly about drinking but also smoking and diet. Consequently special attention was payed to the distribution of these missing values. From the annual, demographic, and geographical distribution of included pregnant women the possibility of selection bias cannot be excluded (Deutch 1999). Mean values were calculated for all anthropometric and health variables: mothers height, weight, and Body Mass Index (BMI= kg/ square meter); birth weight , height, Body mass Index (BBMI), and head circumference of the baby, and gestational age. Bivariate correlation analyses were performed for all possible constellations. Average monthly intakes of 10 traditional food items were calculated and bivariate correlation analyses were performed for all mutual constellations. The women were divided into “never smokers”, “ever smokers” and “present smokers”. And with regard to alcohol consumption into “never drinkers” and “ever drinkers”. Arithmetic and geometric means were calculated for blood concentrations of all heavy metals in mother and child. Bivariate analysis was carried out for all possible mutual contaminant constellations and mother versus child, not shown , published elsewhere (Deutch1999). Similarly mean values were calculated for all included POP’s. However, for alpha chlordane, aldrine and gamma chlordane, the mean values were below the detection limits and these compounds were excluded from the further statistical analysis. For all the remaining organic compounds, bivariate analyses were carried out for substance by substance associations and mother versus child, (Deutch 1999) Bivariate statistics was performed between heavy metals and POP’s, heavy metals and traditional food, POP’s and traditional food, and all of these against smoking ,drinking, some demographic variables and the anthropometric and other health variables such as, birth weight and gestational age. Wherever possible, multiple linear and logistic regression analyses were carried out for plausible associations for which reasonably strong bivariate correlations had been found. For simplification and comparison with international AMAP-data some group-variables were calculated and used in the presentation of results, namely, the sum of chlordanes, the sum of DDE and DDT, the sum of 14 PCB-congeners, the sum of Toxaphenes (from 1997) and presented together with $-HCH, hexachlorobenzene and mirex. Chlordane= sum of alpha-chlordane, gamma-chlordane, cisnona-chlordane, transnona-chlordane, and oxychlordanes. SumDDT= sum of DDE and DDT SumPCB= sum of all 14 PCB-congeners, namely 28, 52, 99, 101, 105, 118, 128,138, 153, 156, 170, 180, 183, and 187. Sumtox = toxaphenes Parlar 26 (32) and 50 (62) (69) The following substances, namely Aldrine, toxaphenes Parlar 32, 62 and 69, were generally below detection limits and were not used in the further analyses. Also gamma chlordane was very low and close to the detection limit. Table 4.2.1. Participant profile of pregnant women, demographic and anthropometric data of mother and newborn. Arthmetic means,(minimum – maxi- mum). Empty cells signify that no data is available.
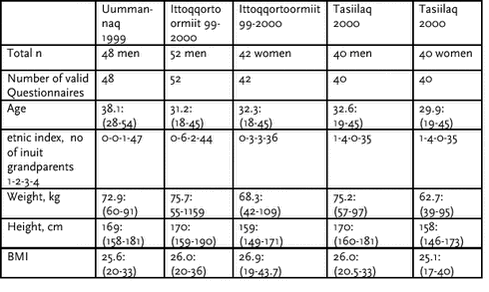
4.2.2.3 International guideline valuesVarious international guidelines for pollutants are shown in table 4.3.17. Denmark/Greenland does not have their own specific guidelines. The guidelines are given as microgram/liter. The US-EPA (USA Environmental Protection Agency) guideline for mercury is based upon the following calculation:(ref National Research Council. Toxicological Effects of Methyl mercury) C = (d x bw x A x f)/ (b x V) in which C = blood concentration in microgram /liter d = daily intake in microgram /kg/day bw = body weight default value 60 kg for an adult female A = Absorption factor (0.95) f = fraction of daily intake taken up by blood (0.05) b = elimination constant of (0.014 /day) V = volume of blood in the body (5 L) The three Canadian guidelines for PCB , aroclor 1260 are proposed as >5 microgram/l level of concern for pregnant women, >20 level of concern for men and post menopausal women, >100 level of action. WHO has a guideline for sum of DDT of 200 microgram /liter. Guidelines for other POPs have not yet established. 4.2.2.4 TEQ values The TEQ values in picogram/gram are calculated from a weighted sum of 5 PCB congeners. Namely their concentration in microgram per kg lipid, times their TEF-value times 1000, (since pg/g=1000 x microgram/kg): TEQ=(PCB 105 x 1000 x 0.0001)+(PCB 118 x 1000 x 0.0001)+(PCB 156 x 1000 x 0.0005)+(PCB 170 x 1000 x 0.0001)+(PCB 180 x 1000 x 0.00001). 4.2.3 Pilot study, Geographical distribution of contaminant burden, men from 5 districts in Greenland 19974.2.3.1 Purpose The purpose of the project was to study the spatial trend of contaminant levels in Greenland by an age restricted cross sectional study among younger men 4.2.3.2 Materiel, Participants, Data were collected during September 1997 to April 1998 from 6 districts in Greenland, covering the following towns, 1. Ittoqqortoormiit (East) 2. Tasiilaq (East).3.Upernavik, (Central west). 4. Ilulissat (Central west). 5. Nuuk (South west) and 6. Nanortalik , (South West). It was planned to collect information from each location concerning 15 younger men, ideally 20-30 years old. The data consisted of blood samples and questionnaire answers about demographic and lifestyle parameters but not anthropometric factors such as height and weight. The blood samples were analysed for Persistent Organic Pollutants, POP’s, and fatty acid profiles in plasma and erythrocytes. The participants were recruited by the local district hospitals, they appear to be consecutive General Practice patients who have contacted the hospital for minor injuries/ complaints within a period of a month or so. Their actual age range was 19-60 years . By mistake the district hospital in Tasiilaq included women instead of men, these were aged 23-42 years. Thus in principle the data from Tasiilaq cannot be directly compared with the other districts, thus they are omitted from the presentation. However, later sampling from 1999-2000 include men and non-pregnant women from the East coast of Greenland and the results from men and women do not differ significantly regarding dietary habits or contaminant blood levels. And the contaminant data from the 10 women from Tasiilaq 1997 were consistent with data from 40 women 2001. 4.2.3.3 Methods As in the above mentioned mother/ infant studies the blood samples were collected at the local district hospitals, separated into plasma and red blood cells, frozen at -20 C and transported to Nuuk. Here they were stored at -80 C until further transport to The Department of Environmental and Occupational Medicine, Aarhus University, Denmark. The plasma samples were analysed at Le Centre de Toxichologie, Institute National de Santè Publique, Québec, Canada as above for 11 pesticides, 14 PCB-congeners and four toxaphenes of which only parlar 26 and 50 were above detection limits. The red blood cells were analysed at the Department of Environmental and Occupational Medicine, Aarhus, where fatty acid profiles were determined by standard gas chromatography with particular focus on N-3 and N-6 fatty acids according to the method described by Tjønneland et al (1993). The food frequency questionnaire comprised 10 different traditional food items and 6 frequency categories ranging from once a day to never/ less than once a month. No other items were asked thus e.g. polar bear and all imported goods were omitted. All the data were analysed by SPSS statistical program, version 9 and 10. Descriptive, statistical analyses were performed for all included parameters. Bivariate correlation analyses were carried out for almost all possible constellations between questionnaire and blood sample answers. Whenever reasonably strong bivariate correlations were found, further statistical analyses were performed e.g. comparison of means by student’s t-test or anova. Multiple linear or logistic regression analyses were carried out including the most important determinant parameters. Dietary biomarkers. The ratios between the fatty acids in total plasma, plasma phospholipids or erythrocytes can in principle be used as indicators of the relative consumption of traditional versus imported food and can thereby act as crosschecks on the dietary information given in the questionnaires (Willet 1998, Tjønneland et al 1993).Whole blood selenium is also a indicator of intake of marine mammals, particularly Whale skin, muktuk (Hansen 1990, Hansen 2000). The different n-3 fatty acids have slightly different distribution in fish and marine mammals. Docosa-pentaenoic acid, (DPA), C: 22.5.3, is relatively low in fish but more prevalent in seal and particularly in polar bear (Kuhnlein 1991) is therefor a good indicator of seal and polar bear intake. 4.2.4 Cross sectional study Uummanaq 1999From 1999 the collection procedure was changed to improve the representability and compliance. Names and addresses of the participants were randomly drawn from the public registries and they were personally contacted by a district medical officer, who took the blood samples and surveyed the answering of questionnaires. All the sampling took place within a short time period of 1-2 weeks during which the medical officer visited the target location, the compliance to participate was over 90%, blood samples were obtained from 100% of the actual participants and the compliance in answering questionnaire was also very high, close to 100%. 4.2.4.1 Purpose, Uummanaq The purpose of this AMAP associated project was to study the possible association between smoking and high contaminant levels (POPs), which had been observed in the mother /infant study (Deutch and Hansen 1999). However at the same time the procedure for questionnaires and blood samples followed the standard AMAP protocol (with minor changes). Thus the results could also be included in the monitoring and assessment program. The investigation was originally designed as a Case-control study in a homogenous population with a high exposure level to organochlorine compounds from the food chain. However the small population and the local conditions made it not possible to sufficiently match cases (smokers) and controls (never smokers) thus it can be regarded merely as a restricted cross sectional study. 4.2.4.2 Material The data were collected in August 1999 in Uummanaq district in Northern Greenland by a District Medical Officer in Greenland. The names and addresses of local middle aged male Inuits (28-54 years) were obtained from the local authorities. The controls were 14 “never-smokers” (who are very rare), they were compared with 6 previous and 28 present smokers restricted by age, Inuit decent, full- or part time occupation as a hunter, general health status and habitual consumption of local Greenlandic food of more than twice a week, It was also attempted to control for anthropometric factors as well but unfortunately this was not possible. The smokers were clearly significantly slimmer than non-smokers, and not overlapping in BMI- values. The results of this study have been prepared as a separate publication (Deutch et al 2003). The whole group of participants also served as monitoring and assessment material along with men and non- pregnant women from the East Coast, see below. It should be noticed that the Uummanaq participants are not randomly selected like the participants from the East coast. Participant profiles are shown in table 4.2.2. and life style factors in table 4.3.10. 4.2.4.3 Methods The participants answered the standard questionnaire (developed by the Danish National Institute of Public Health for the AMAP project) about demographic and lifestyle parameters, which included questions about current and previous smoking levels, drinking habits and a 14 item food frequency question. In addition they answered a 30 item 24-hour dietary recall scheme see below under “Dietary Survey pilot study”. Blood samples were taken for determination of plasma organochlorines (microgram per litre and microgram per kg lipid), cholesterol, triglycerides, phopholipids (g/l and mmol/l), and total fatty acid profiles (distribution in % of total lipids). Selenium and heavy metals (microgram /l) were determined as additional indicators of marine food product consumption and cotinine (ng/ml) was determined as an indicator of nicotine breakdown products and current smoking status or exposure. The blood samples were frozen at -20 C and transported to Queen Ingrids Hospital, Nuuk. Here they were stored at -80 C until further transport. As previously (8) the plasma samples were analyzed for 11 pesticides, 14 PCB-congeners (28, 52, 99, 101, 105, 118, 128, 138, 153, 156, 170, 180, 183, 187) and four toxaphenes of which only parlar 26 and 50 were above detection limits. Selenium and heavy metals were analyzed at the National Environmental Research Institute, Dept. of Arctic Environment, Roskilde, Denmark. Plasma fatty acids were determined at the Department of Environmental and Occupational Medicine, Aarhus University as described by Tjønneland et al (1993). The fatty acid profiles of body lipids (n-3 and n-6 polyunsaturated fatty acids and their ratios) are strong indicators of the relative intake of marine food items. In addition in order to minimize the effects of possible daily variations in plasma fatty acids, the fatty acid profiles were also determined in plasma phospholipids (at the Biology Dept. University of Guelph, Canada). The two types of fatty acid determinations gave similar results and the phospholipids were used in the multi variate analyses. Plasma cotinine, a biomarker of metabolic nicotine breakdown, was determined using a semi quantitative Cotinine Serum Micro plate assay (STC technologies) according to the instructions by the company. However the samples from the current smokers had to be diluted 5-8 times to obtain a linear response. All the data were analyzed using SPSS-statistics program version 9 and 10. Descriptive univariate analysis was performed on all included parameters. Bivariate correlation analyses were carried out for almost all possible, and plausible constellations between questionnaire and blood sample answers. Both arithmetic and geometric means of contaminants were calculated and compared by students t-test and anova. but the distributions were relatively even. However in the final linear regression analyses logaritmized concentrations of POP were used to approach normal distributions. Multiple linear regression analyses were performed for a number of plausible models, and model control was performed for the best models. Significance levels were p<0.05*, p<0.01 **, p<0.001 ***. Table 4.2.2. Participant profile of men and non-pregnant women, demographic and anthropometric data. .Arthmetic means, minimum and maximum
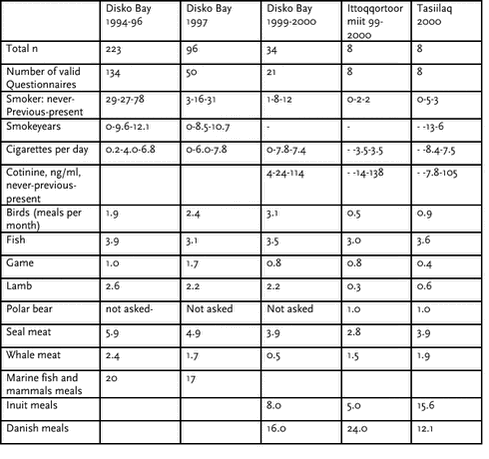
4.2.5 Men and non- pregnant women East Greenland, 1999-2000.4.2.5.1 Purpose The purpose of this study was to follow up on the results from the pilot study from 1997 in which extremely high contaminants levels had been observed among men on the East coast of Greenland (Ittoqqortoormiit) and at the same time continue monitoring and assessing pregnant women and women of birth giving age. Since the populations of Eastern Greenland are so small it would take a long time to collect sufficient number of samples from pregnant women alone and therefor non-pregnant women were included as well. 4.2.5.2 Participants In Ittoqqortoormiit (Scoresbysund) and Tasiilaq (Ammassalik), Eastern Greenland the names and addresses of 50 men and 50 women (age 20-50) were randomly drawn out from the public register. The persons were contacted by a District Medical Officer and asked to participate in the AMAP 2000, Human Health Programme by answering questionnaires and giving blood - and urine samples after informed consent. The compliance was about 90% (Ittoqqortoormiit: 51 men, 42 women Tasiilaq: 41 men, 40 women and 8 pregnant women). The included participants represented 40 % (Ittoqqortoormiit) and 7% (Tasiilaq) of their age group in the local populations. 4.2.5.3 Methods Questionnaire. All the 182 participants answered the standard AMAP questionnaire, developed by The Danish National Institute of Public Health regarding demographic anthropometric, and lifestyle factors (smoking habits, drinking habits, and meal patterns) including a limited dietary questionnaire divided into 6 frequency categories ranging from “once a day” to “never”/ or “less than once a month” about habitual/recent use of 6 traditional, Inuit food types as part of a meal (seal, whale, birds, local fish, game and lamb) and 8 Danish food types (fast food, potatoes, other vegetables, butter, cheese, eggs, fresh fruit, milk and yoghourt). Portion sizes were not asked. Regarding methods the further analysis of contaminants in blood samples the procedure was as above mentioned for Uummanaq. However, in addition to the organochlorine determinations in the blood samples the human effects biomarker programme was implemented by analyzing hormones or dioxin like activities. The methods and results will be described in the Human Health Effects Biomarker Program, Chapter 7. 4.2.6 Dietary Survey, pilot study, 19994.2.6.1 Purpose. The purposes of dietary investigations in the Human Health Programme were to estimate food item intake, and eventually to estimate nutrient composition and the dietary content of specific xenobiotic substances with toxic or other adverse effects., in order to make exposure estimates, and finally to relate the exposure estimates to human body levels of contaminant and miscelaneous biomarkers. The wider perspectives aim to rank individuals and to compare population groups within countries or between countries. Thus the dietary investigations serve as part of the basis for public health recommendations for the general population or special risk groups. 4.2.6.2 Participants. The purpose of this pilot study was to test the compliance in using a self administered, extensive food scheme and to test the typicality of the range of products presented. 4.2.6.3 Methods: Dietary questionnaire by 24 hour recall. The participants were asked to fill out a 2 page food scheme concerning the previous 24 hours, divided into early morning, mid morning, midday, afternoon and evening. The scheme comprised 32 traditional and Danish (imported) food categories. The relative and absolute intakes in gram per day were estimated by using standardized portion sizes, Danish. Food Item groups were calculated as sums of single items from the list. 4.2.6.4 Dietary Questionnaire, East Greenland 1999-2001. In addition to the AMAP questionnaire, see above, the 182 participants from Ittoqqortoormiit and Tasiilaq answered a more extensive, 60 item, semi quantitative food frequency questionnaire (FFQ) of which the format was adapted from Willet (1998). The questionnaire included 25 local Inuit food items, mainly sea mammals and fish, 22 imported food items (Danish meat, vegetables, fruit, bread, and milk products), and various liquids: water, coffee, tea, juices, beer wine, and liquor. The participants were asked to indicate their average use during the last year by choosing between 8 frequency categories ranging from “almost never” to ”>5 times a day”. The whole frequency range was used and the compliance in checking off food items was almost 100%. Standard portion sizes were used to calculate monthly and daily intakes in grams for single food items and for food item groups. 4.3 Results by project/ study group4.3.1 Pregnant women and infants.1994-20014.3.1.1 Participant profile and lifestyle. The participant profiles are shown in table 4.2.1. It should be noticed that the number of included pregnant women are less than 50% of the total expected pregnancies, and the number of valid questionnaire only about 60% of the included participants. Thus furthermore there is low compliance in answering questions about smoking and drinking. Thus selection bias cannot be excluded (Deutch 1999) The age mean and range is however the same for all locations. Height is lower and weight and BMI slightly higher on the East coast which may be both a lifestyle and genetic difference. The weight of the newborn baby is very much the same, except for Disko Bay 1999 where one preterm baby of 500 gram is included in the study. Regarding the lifestyle questions (table 4.3.1) the compliance was about 60% but lower regarding drinking questions which are not included in this table for that reason. Based upon their self reporting the participants were categorized into three smoking status groups: 0= never smoker, 1= previous smoker and 2= present smoker. From 1999 serum cotinine determinations were introduced. The smoking categorization was confirmed in almost all cases. However the detected serum cotinine per reported daily cigarette was rather high 15-20ng/ml. This may be a genetic phenomenon or underreporting. Regarding the traditional food questions, the reported intakes were very similar, except that seal intake was slightly higher on the West coast. Table 4.3.1. Lifestyle factors among pregnant women according to self reported AMAP questionnaires, the formulation of the diet question were slightly changed after 1997. Cotinine, a nicotine breakdown product is included as validation on smoking reporting.
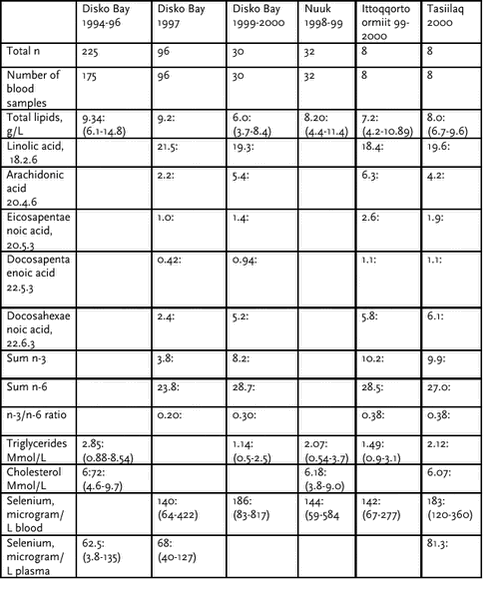
The dietary biomarkers for pregnant women are shown in table 4.3.2. The fatty acid distribution throughout Greenland shows the following characteristic. The total plasma lipids, cholesterol and triglycerides are slightly elevated in pregnant women , compared with non-pregnant women, table 4.3.12. This is probably a result of their condition rather than a dietary deviation. The plasma levels of n-3 fatty acids measured as single fatty acids , their sum, and the ratio between n-3 and n-6 fatty acids are all lower on the South West coast,(Disko Bay and Nuuk ) compared to the East Coast (Ittoqqortoormiit and Tasiilaq) indicating a lower intake of marine fish and mammals and a more westernized diet. Table 4.3.2. Biomarkers of pregnant women,total plasma lipids, fatty acids in % of total plasma lipids, triglycerides, cholesterol and Selenium.Arithmetic means, (minimum - maximum).
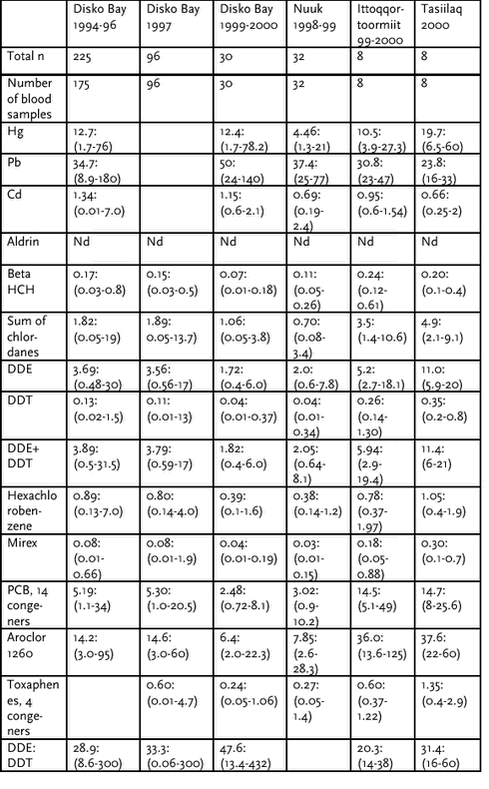
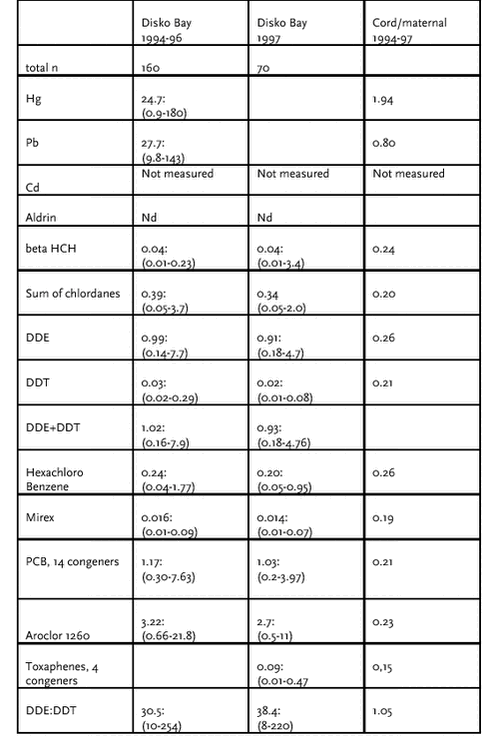
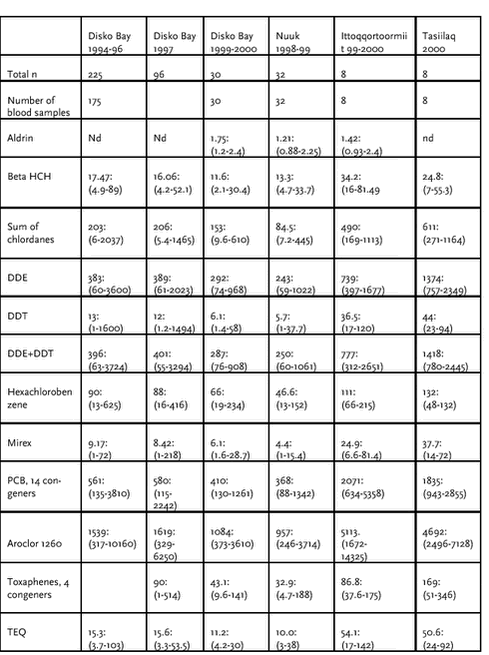
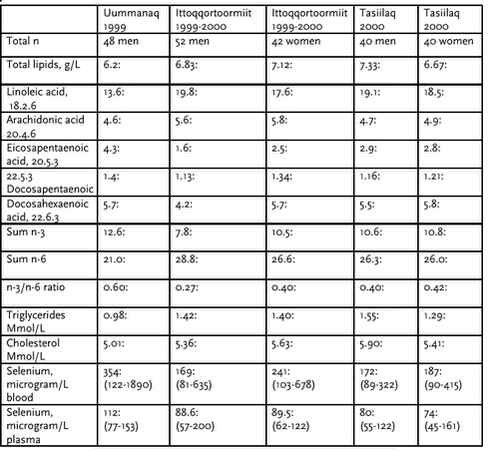
The selenium blood levels of pregnant women are almost the same in Disko Bay, Nuuk, Ittoqqortoormiit, and Tasiilaq table 4.3.2. However in Uummanaq, table 4.3.12, Selenium is almost double that of the other stations indicating a large consumption of whale particularly Muktuk, whale skin which is an important source of selenium. This is consistent with previous measurements from the Northwest coast, Thule, where blood selenium also is very high(Hansen 2000). 4.3.1.3 Contaminants, heavy metals and POPs wet weight and lipid weight. 4.3.1.3.1 Heavy Metals The blood levels of total mercury among pregnant women and infants are lowest in Nuuk, table 4.3.3 and 4.3.4, with middle levels in Disco Bay and the East coast. The Hg level is constant in Disko Bay between 1994 and 1999-2000. Cd is higher in Disko Bay than on the East coast and Pb is higher on the West coast than on the East coast.The blood levels of heavy metals in cord blood Table 4.3.3. Contaminants in maternal blood in wet weight, microgram/L plasma. Geometric means, minimum and maximum. Nd = not detected.
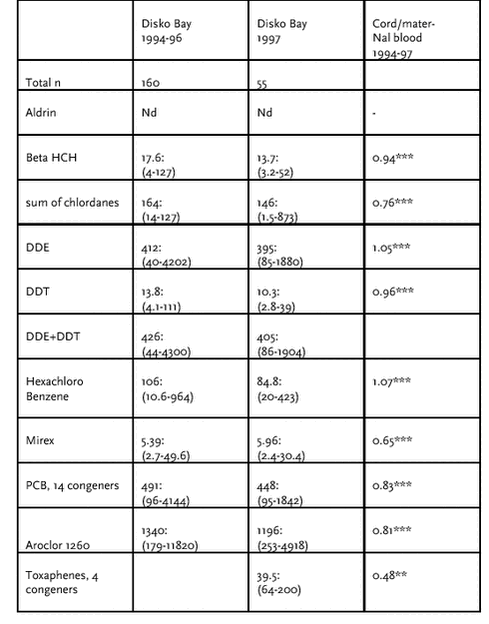
from1994-96 , table 4.3.4, are strongly correlated with levels in maternal blood,(Deutch1999), and measurements were therefor abolished after 1996. Table 4.3.4. Contaminants in, cord blood (wet weight, microgram per litre. Geometric means , minimum and maximum), and ratio between cord and maternal blood concentrations (cord/maternal). Nd = not detected.
4.3.1.3.2 Organic Pollutants The contaminant levels in Disko Bay appear to be constant between 1994 and 97 and slightly lower in 1999. In general the 1999 samples from Disko Bay and Nuuk show the lowest contaminant levels, and the samples from the East coast, Ittoqortoormiit and Tasiilaq the highest. Considering that the numbers of included women are very low, these results may not be representative. Table 4.3.5. Contaminants in manternal blood lipid adjusted. lipid adjusted weight microgram/kg total plasma lipid.Geometric means, minimum and maximum. Nd = not detected. Hexachlorobenzene is lowest in Nuuk and Disko Bay 1999 otherwise similar in East and West. Mirex, PCB-congeners and Aroclor 1260 are much higher on the east coast and this is also consistent with the larger population samples from men and non-pregnant women 1999-2001, (tables 4.3.13 and 4.3.14). Organic contaminants in cord blood are highly significantly p<0.001*** (table 4.3.6.) correlated with maternal blood, after lipid adjustment at a close to 1:1 basis except for mirex and toxaphenes, see also figure 4.2.1. Table 4.3.6. Contaminants in infants, cord blood(lipid adjusted weight microgram/kg total plasma lipid).Geometric means, minimum and maximum and ratio between cord blood and maternal blood concentrations (cord/maternal). Nd = not detected. p<0.01**, p<0.001***
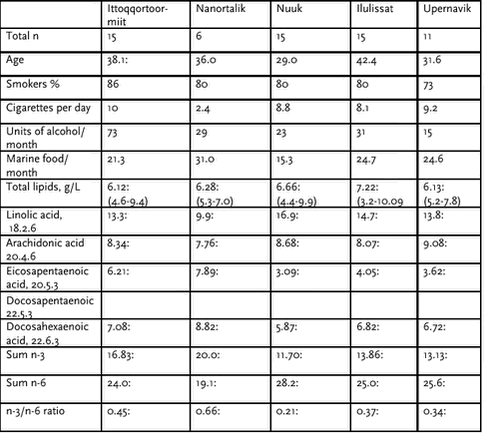
4.3.2 Geographical study 19974.3.2.1 Participants, lifestyles and biomarkers Regarding age the participant differ by district. The men from Nuuk are slightly but not significantly younger than the other men and the men from Ilulissat are slightly older than the others. The participants also differ by district with regard to several lifestyle factors, namely both drinking and smoking levels and consumption of traditional food items per month, table 4.3.7. The men from Ittoqqortoormiit differ significantly from the other men having a higher alcohol consumption both as volume and frequency. They also range somewhat but not significantly higher regarding cigarettes per day and percentage of smokers. The men from Nanortalik report the highest number of traditional meals. Table 4.3.7. Participant profile and biomarkers of men (1997), total plasma lipids, fatty acids in % of total plasma lipids,Arithmetic means, minimum and maximum.
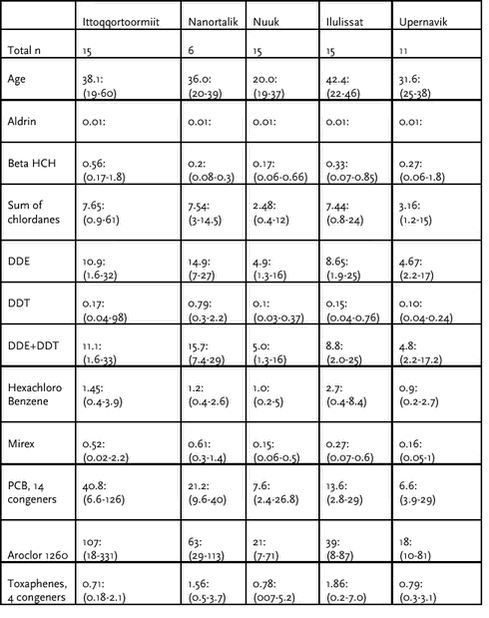
4.3.2.1.1 Biomarkers. The fatty acid profiles in particular the n-3/n-6 ratios are consistent with the reported number of traditional seafood meals, being highest in Nanortalik (0.66) and lowest in Nuuk, (0.21).In fact the n-3/ n-6 ratio in Nuuk is almost as low as ratios among European populations, table 4.3.16 4.3.2.2 ContaminantsThe mean values of organochlorine plasma levels vary by district as shown in table 9 and 10., both in terms of relative distribution and total burden. The levels of beta HCH, chlordanes, DDT, Mirex and PCB are particularly high in Ittoqqortoormiit and significantly higher than all other districts except Nanortalik, student T-test p<0.05. Hexachlorobenzene and Toxaphene levels appear to be higher on the West Coast but mainly in Ilulissat. The high levels found in Nanortalik are consistent with a high reported consumption of tradional seafood meals and a high n-3/n-6 ratio but based only upon 6 men may not be representative for the background population. Table 4.3.8. Contaminants in men (1997) in wet weight, microgram/L plasma. Geometric means, minimum and maximum.
Table 4.3.9. Contaminants in men (1997), lipid adjusted weight microgram/kg total plasma lipid.Geometric means, minimum and maximum.
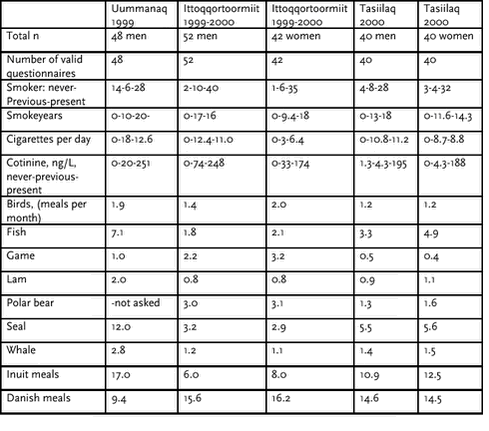
4.3.3 Men and non-pregnant women 1999-20004.3.3.1 Participant profile. The men and women who had been randomly drawn among 18-50 year age group from the public register had approximately the same mean age of 29.9-38.1 years, with the men from Uumannaq being the oldest. The ethnic index was measured as number of Grenlandic grandparents was almost the same for all groups and none had zero Greenlandic grandparent, more than 85 % had 4 Greenlandic grandparents, Their mean body weight was almost the same but the ranges were larger on the East coast The average height was 169-170 for men and 10 cm less for women consistent with Greenland statistics for the whole country. The BMI mean values were also quite comparable. Table 4.3.10. Participant profile of men and non-pregnant women, demographic and anthropometric data. Arthmetic means, minimum and maximum
4.3.3.2 Lifestyle factors. The lifestyle factors are shown in table 4.3.11. The men and women from the East coast were selected randomly and therefor their rate of smoking can be considered representative, the number of never smokers was extremely low (2-10%) both among men and women, the number of previous smokers ranged from 10-20%. The debut age for smoking was typically around 15 and the number of smoking years ranged from 9-17 among previous smokers and 14-18 among present smokers. Their self reported smoking status was compared with their serum cotinine levels, the never smokers had a close to zero cotinine level, consistent with their reporting, and so did the previous smokers in Tassiilaq. In Ittoqqortoormiit, however, the cotinine levels among previous smokers were 74 and 33 ng/ml among men and women respectively which indicate the use of 5-3 daily cigarettes. Among the current smoking women in Ittoqqortoormiit the average cotinine level was 174 ng/l and the self reported number of daily cigarettes only 6.4. This would correspond to 27ng cotinine/cigarette which is significantly higher than for the other groups and indicates under-reporting. The 48 men from Uummanaq were selected for a case-control study and the high ratio of never smokers should not be considered representative of the basic population, the self reported cigarette use was consistent with the cotinine levels. Concerning diet the reported intake frequency of fish, seal, whale, and Inuit meals were highest in Uummanaq and lowest in Ittoqqortoormiit , whereas game and polar bear intake was highest in Ittoqqortoormiit. Table 4.3.11. Lifestyle factors among men and non-pregnant women according to self reported AMAP questionnaire. Cotinine , a nicotine breakdown product is included as validation of the smoking reporting.
4.3.3.3 Dietary markers. The fatty acid profiles (table 4.3.12) followed the overall reported dietary composition, the n-3/n-6 ratio and EPA were highest in Uummanaq consistent with diet based more highly upon marine mammals and fish. Blood levels of 20.5.3 and 22.5.3 varied by district both in terms of absolute values and their mutual ratios. On the East Coast the n-3/n-6 ratio was lower particularly among men from Ittoqqortoormiit. This resulted both from a lower concentration of n-3 particularly of 20.5.3 (EPA) and a higher concentration of linoleic acid Table 4.3.12. Dietary markers of men and non- pregnant women,total plasma lipids, fatty acids in % of total plasma lipids, triglycerides, cholesterol.
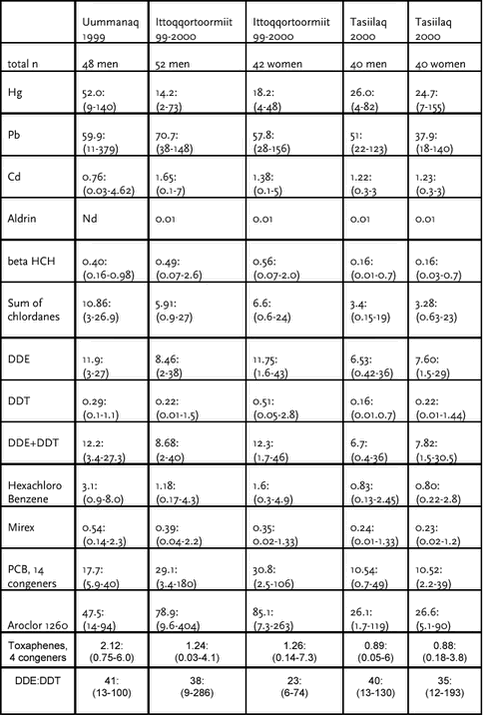
4.3.3.4 Contaminants 4.3.3.4.1 Heavy Metals The only population group that has an extreme, high level of Hg is Uummanaq, with 52 microgram per liter, which is 2-5 times higher than the other stations, table 4.3.13. This is consistent with the high blood Selenium level se above table 4.3.12 and indicates a high whale consumption. The lead levels are not in general particularly high, although higher on the East Coast and higher among men, table 4.3.13, see also table 4.3.3. The cadmium levels which indicate both seafood intake and smoking are higher on the East Coast particularly among men in Ittoqqortoormiit . However the group of 48 men from Uummanaq which are selected for a case control study includes a higher than normal ratio of non-smokers (14/48) where as the number of non -smokers or previous smokers are much lower on the East coast se table 4.3.11. Therefor the overall Cd level in Uummanaq cannot be considered representative of the location. The Cd-level among the smokers in Uummanaq is 1.71 microgram/L which is comparable to the value found among men in Ittoqqortoormiit and almost double as high as among non-smokers. The Cd levels are not significantly correlated with traditional food intake but highly significantly correlated with smoking r=0.37, p<0.001***. None of the metals appear to have decreased in levels over the time period covered by the study. Table 4.3.13. Blood contaminants in men and non-pregnant women in wet weight, microgram/L. Geometric means, minimum and maximum.
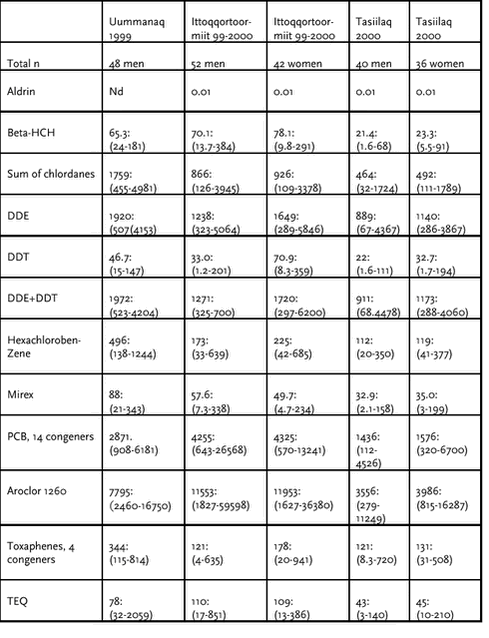
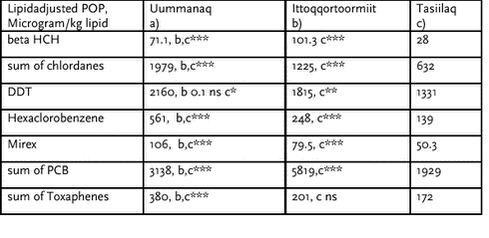
4.3.3.4.2 Organochlorines. The following applies both to contaminant levels in wet weight (table 4.3.13) and lipid weight levels (table 4.3.14) of organochlorines in plasma. Comparisons by independent samples t-test between the three geographical groups are shown in table 4.3.15 The sum of chlordanes, DDTs, hexachlorobenzene, mirex and toxaphenes are highest in Uummanaq and lowest in Tassiilaq, whereas beta-HCH, and particularly PCB-congeners (and Aroclor1260) are by far the highest in Ittoqqortoormiit, almost three times the level in Tasiilaq. Table 4.3.14. Contaminants in men and non-pregnant women, lipid adjusted weight microgram/kg total plasma lipid.Geometric means, minimum and maximum.
Table 4.3.15. Arithmetic means of organochlorine blood levels from 3 districts 1999-2000 and significance levels in independant samples t-test.- p<0.03*,p<0.01**, p<0.001***
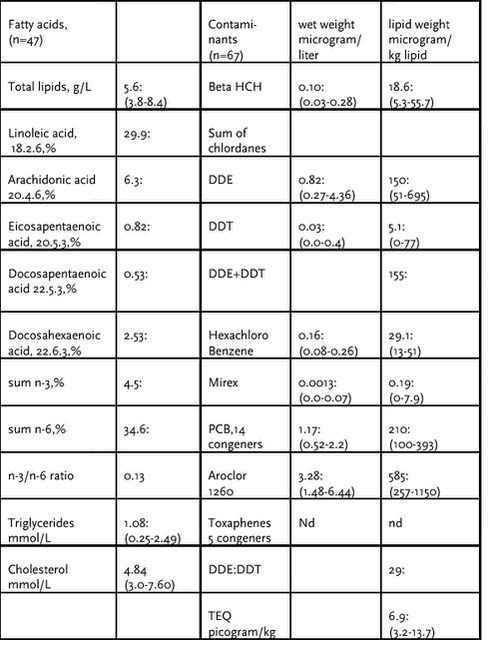
Table 4.3.16. Blood levels of fatty acids (% of total lipids) and contaminants in plasma of 67 Danish women of childbearing age (25,5 years (16-36)) shown for comparison with the corresponding results from Greenland.
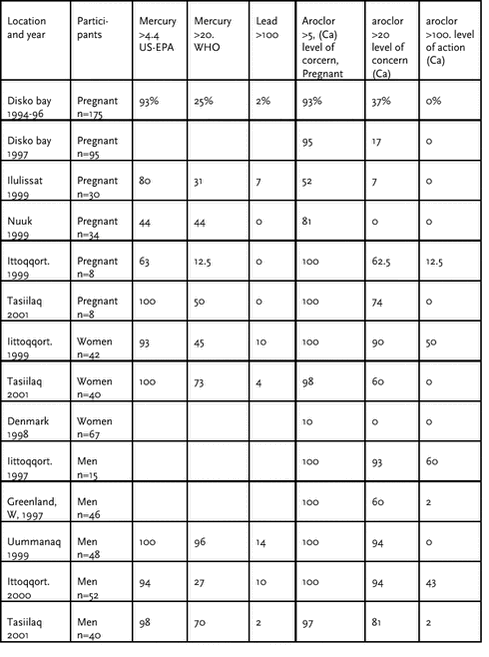
4.3.4 Percentages of samples exceeding guidelines for blood levels of pollutantsThe percentage of blood samples which exceed various international guideline values are shown in table 4.3.17. For all pregnant women except for women from Nuuk a very high percentage exceed the guidelines for mercury and in addition the non-pregnant women (of fertile age) have correspondingly high exceeding %. In contrast only a few persons(0-14%) exceed the guideline for lead. Tabel 4.3.17. Percentages of bloodsamples exceeding various guidelines for mercury, lead and PCB-aroclor 1260 (microgram /liter) among pregnant woman, non-pregnant women of reproductive age and men.
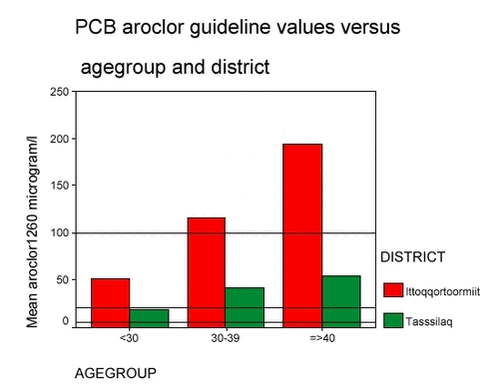
Concerning PCB guidelines 52-100% of the pregnant women exceed the level of concern and in Ittoqqortoormiit 12.5 % (one pregnant woman) exceeds the level of action. Among the non-pregnant woman of fertile age the exceedances are even slightly higher, in Ittoqqortoormiit 50 % exceed the action level. Also among the men in Ittoqqortoormiit 43 % exceed the action level. The exceedances in Ittoqqortoormiit 1999 confirm results from 1997(Deutch and Hansen 2000). The exceeding % among Danish women is only 10 (thus only 10% of non-pregnant women in Greenland). Figure 4.3.1. Human plasma PCB-aroclor1260 (microgram/litre) as a function of agegroup and district among women from East Greenland 2000-2001, (n=94) compared to Canadian guideline values (5, 20, and 100 microgram/litre) see table 4.3.17
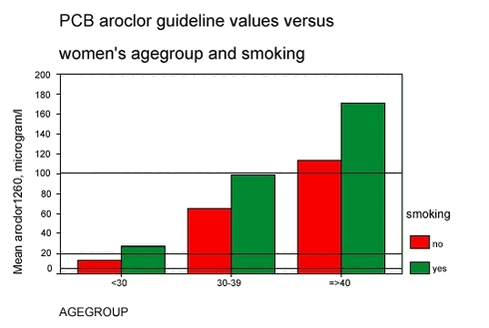
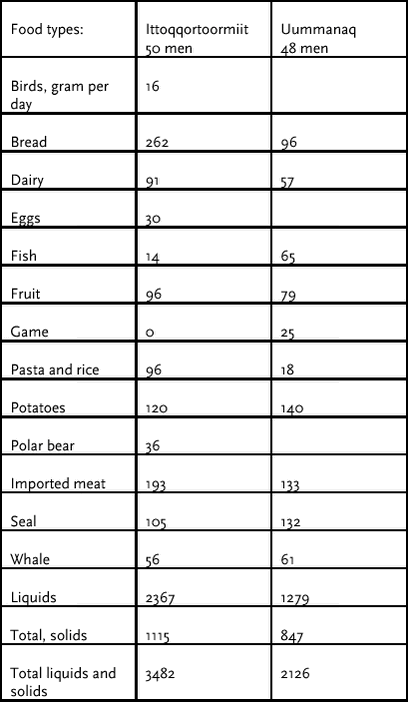
Figure 4.3.2. Human plasma PCB-aroclor1260 (microgram/litre) as a function of agegroup and present smoking status among women from East Greenland 2000-2001, (n=94) compared to Canadian guideline values (5, 20, and 100 microgram/litre) see table 4.3.17 4.3.5.1 Dietary survey pilot study 1999 by 24 hour recall The Dietary survey, pilot study from 1999, compared 50 male Inuits from Ittoqqortoormiit with 48 male Inuits from Uummanaq and showed mean Intake in gram during the last 24 hours estimated by a 24 hour recall (24HRC) frequency scheme and standard portions sizes in grams (table 4.3.18). Food type groups were compiled from single food items from a 32 food item list, polar bear intake was not asked in Uummanaq. The total intake is the sum of all products eaten (not just the typical product presented in the table). The intake of seal, whale, imported meats , potatoes and total amount of solids were very similar in the two groups but bread, pasta, and rice intake was higher in Ittoqqortoormiit and fish intake was lower The total intake in grams were higher in Ittoqqortoormiit but this was mainly due to a higher liquid consumption. Table 4.3.18. Results from 24 hour recall dietary questionnaire among 20-50 year old Inuits in Ittoqqortoormiit, Eastern Greenland compared with Uummanaq, Western greenland 1999. arithmetic means (gram/day). Independent samples t-test for equality of means, p<0.05*, p<0.01**, p<0.001***.
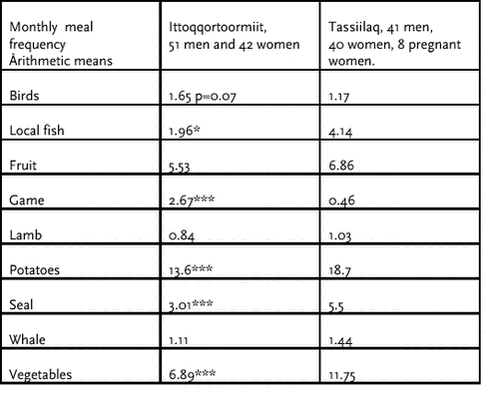
Results from the small dietary questionnaire (AMAP) among 20-50 year old Inuits in Ittoqqortoormiit were compared with Tasiilaq, Eastern Greenland 2000-2001, through estimated monthly food consumption frequencies, (arithmetic means are tested by Independent samples t-test for equality of means, p<0.05*, p<0.01**, p<0.001***.) Table 4.3.19. The differences between men and women were not found to be significant and are thus not shown separately. Table 4.3.19. Results from dietary questionnaire among 20-50 year old Inuits in Ittoqqortoormiit compared with Tassiilaq, Eastern Greenland 2000-2001. Estimated monthly food consumption frequencies, arithmetic means. Independent samples t-test for equality of means, p<0.05*, p<0.01**, p<0.001***.
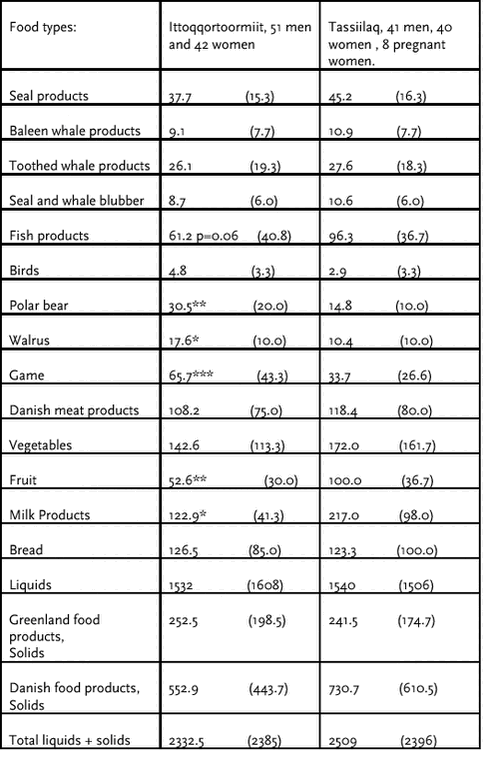
4.3.5.2 AMAP Questionnaire The food frequencies measured by the AMAP questionnaire, which covers the habitual recent intakes were in general quite similar in Ittoqqortoormiit and Tasiilaq. However local fish, seal, potatoes and vegetable consumption was significantly higher in Tassiilaq and game (reindeer, muskox , hare) was higher in Ittoqqortoormiit According to the AMAP Questionnaire the sums of single local products were higher than the reported frequency of Inuit meals and the intakes were lower in Ittoqqortoormiit than in Tasiilaq Table4.3.20. Results from dietary survey by semi quantitative food frequency questionnaire, FFQ, among 20-50 year old Inuits in Ittoqqortoormiit compared with Tasiilaq, Eastern Greenland 2000-2001,The differences between men and women are not significant and therefore not listed separately. Daily intakes in grams, arithmetic means and (medians). Independent sample‘s t-test for equality of means, p<0.05*, p<0.01**, p<0.001***.
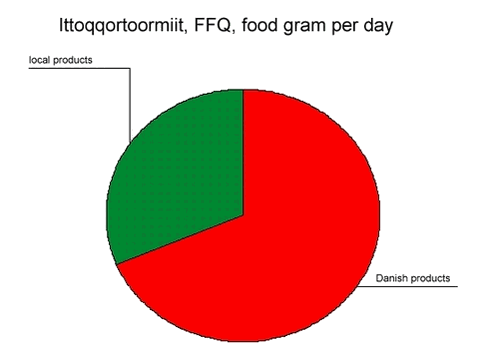
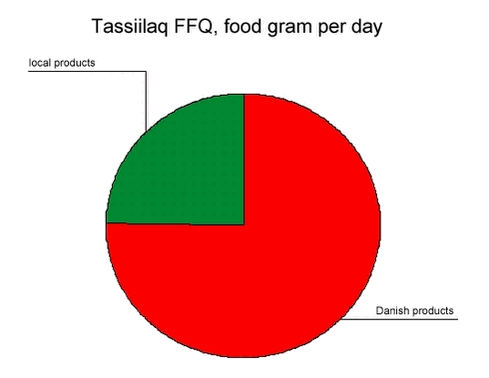
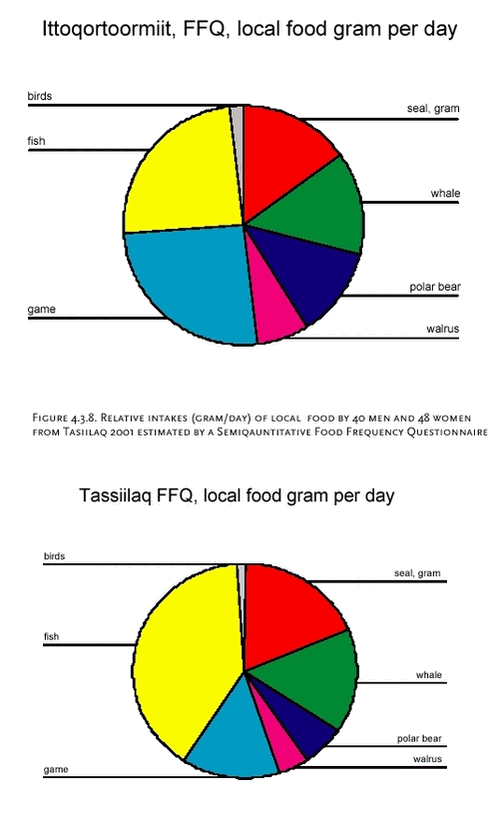
4.3.5.3 Semiquantitative Food Frequency Questionnaire Results from dietary survey by semi quantitative food frequency questionnaire, FFQ, among 20-50 year old Inuits in Ittoqqortoormiit were compared with Tasiilaq, Eastern Greenland 2000-2001 as shown in table 4.3.20.Daily intakes in grams calculated from monthly frequency and standard portions sizes are shown as arithmetic means and (medians) Arithmetic means are compared by Independent samples t-test for equality of means, p<0.05*, p<0.01**, p<0.001***.) The results of this dietary survey by FFQ which aimed at covering the last year, were in general somewhat similar between Ittoqqortoormiit and Tassiilaq and the means and median intakes of the food item groups were almost identical with a few exceptions (table 4.3.20) see below. The total intakes as grams of Greenland products were the same but the total intakes of Danish food were slightly, but not significantly higher in Tassiilaq. Among the Greenland products, intakes of polar bear, walrus and game were significantly higher in Ittoqqortoormiit and intake of seal and - fish products were higher but not significantly higher in Tassiilaq. Among the Danish products, meat and bread intakes were the same, but milk products, fruit and vegetables were higher in Tassiilaq. Butter and margarine intakes (not listed) were similar since they followed the bread intakes. Liquid intake was the same, and sugar which was associated with coffee and tea drinking was the same in the two towns. Figure 4.3.3. Relative intakes (gram/day) of local and Danish food by 52 men and 50 women from Ittoqqortoormiit 2000 estimated by a Semiqauntitative Food Frequency Questionnaire
Figure 4.3.4. Relative intakes (gram/day) of local and Danish food by 40 men and 48 women from Tassilaq 2001 estimated by a Semiqauntitative Food Frequency Questionnaire
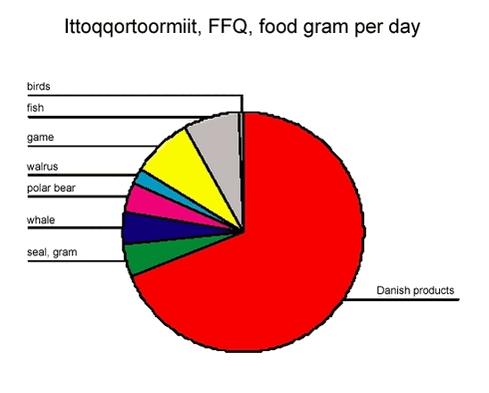
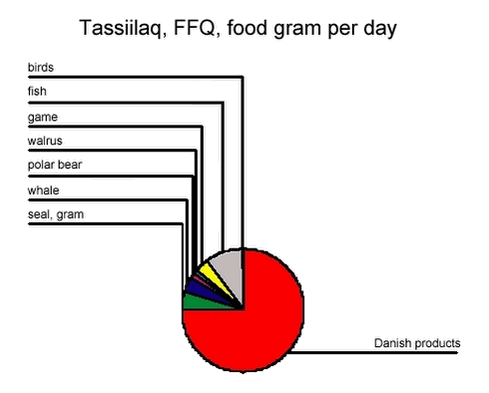
Figure 4.3.5. Relative intakes (gram/day) of local and Danish food by 52 men and 50 women from Ittoqqortoormiit 2000 estimated by a Semiqauntitative Food Frequency Questionnaire
Figure 4.3.6. Relative intakes (gram/day) of local and Danish food by 40 men and 48 women from Tasiilaq 2001 estimated by a Semiqauntitative Food Frequency Questionnaire
Figure 4.3.7. Relative intakes (gram/day) of local food by 52 men and 50 women from Ittoqqortoormiit 2000 estimated by a Semiqauntitative Food Frequency Questionnaire
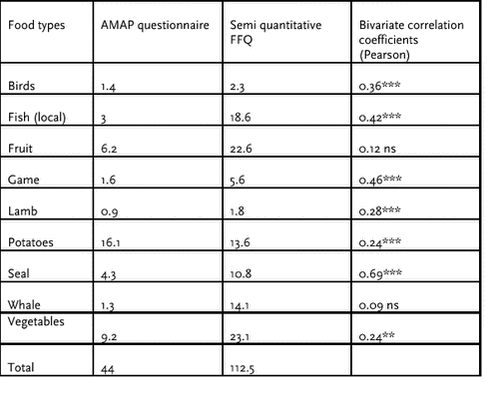
In terms of solid food weight Greenlandic food yielded 31.3 % in Ittoqqortoormiit and and 24.8% in Tasiilaq , which supported the picture that the food intake in Tassiilaq was slightly more “ westernized” and at the same time more balanced / versatile. The food intakes were also compared between men and women (for both towns) and were found to be very similar, only deviating for fruit (p=0.02) and vegetables (p=0.07) which were higher among women. The overall differences between men and women were so small that the results are not shown separately. Smokers were also compared with non-smokers but there were no significant differences. The effect of age was also considered , but the intake of the included traditional food items appeared to be independent of age within the range tested (20-50 years). Based on data from 1994-95 from Disko Bay area Pars (2000) published the results of a dietary study by several methods, SQFFQ, 24HRC and 48HRC. She found that the local food was about 22% of the total intake and that traditional food was more common among men and among the older age groups. The present dietary survey results based upon 182, 20-50 year old Inuits living in Eastern Greenland 2000-2001, from Ittoqqortoormiit (51 men and 42 women) and Tassiilaq (41 men, 40 women and 8 pregnant women) were furthermore compared between the two methods applyed, the brief AMAP questionnaire (using 14 food categories and 6 frequency categories) and the semi quantitative food frequency questionnaire, table 4.3.21. The FFQ answers, using 8 frequency categories and 60 single food item types, were compiled into food-group categories, which were comparable with the other questionnaire in terms of monthly frequency. The two methods were compared by difference of arithmetic means, and their mutual correlation were measured by Pearson correlation coefficients(significance levels p<0.05*, p<0.01**, p<0.001***). Table 4.3.21. Dietary survey results based upon 182, 20-50 year old Inuits living in Eastern Greenland 2000-2001, Ittoqqortoormiit (51 men and 42 women) Tassiilaq (41 men, 40 women and 8 pregnant women). Comparison between to methods, the brief AMAP questionnaire using 14 food categories and 6 frequency categories and the semi quantitative food frequency questionnaire, FFQ, using 8 frequency categories and 60 single food item types, which were compiled into food group categories, made comparative with the other questionnaire. Monthly frequency, arithmetic means, and Pearson correlation coefficients, p<0.05*, p<0.01**, p<0.001***.
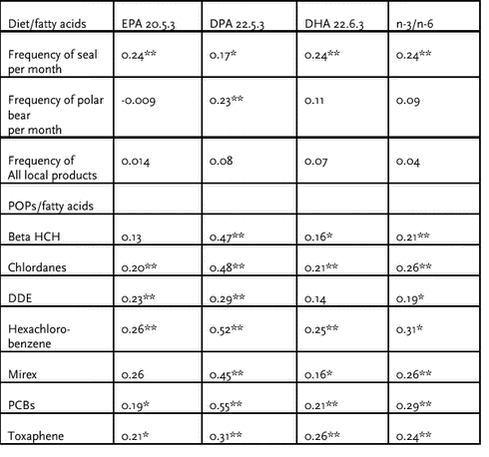
In general the mean food type consumption frequencies estimated from the FFQ were higher than those from the AMAP questionnaire, particularly when the food group was compiled from several single items, (fish, fruit, whale, vegetable) and not so much when the food group only consisted of few or single items (birds, lamb, seal). The FFQ also covered a longer period (one year) than the AMAP questionnaire. However the bivariate correlation coefficients were very high between the two methods except for fruit and whale intake. The best agreement was found for seal intake, table 4.3.21. Both methods supported the general picture that the diet was more versatile in Tassiilaq relying more on different products both traditional and Danish especially fish, fruit and vegetables. 4.3.5.4 Dietary survey results and dietary biomarkers Regarding men and non-pregnant women , table 4.3.11 and 4.3.12, the picture is much the same as for pregnant women with higher plasma levels of n-3 on the east coast than in the larger towns and settlements on the South west coast. The only exception is Uummanaq, but the participants have a high ratio of hunters who presumably consume more marine products.The Docosa-pentaenoic acid, 22.5.3, levels are high in both Uummanaq, Ittoqqortoormiit and Tassiilaq indicating high intakes of seal and or polar bear, according to the dietary questionnaires above, polar bear intake is common on the East Coast particularly in the North. Table 4.3.22. Associations between diet and plasma fatty acids, and between lipid adjusted POPs and plasma fatty acids among 182 Inuits on the East Coast of greenland 2000. Pearson bivariate correlation coeffecients and significance levels, p<0.05*, p<0.01**, p<0.001***.only the strongest associations are shown.
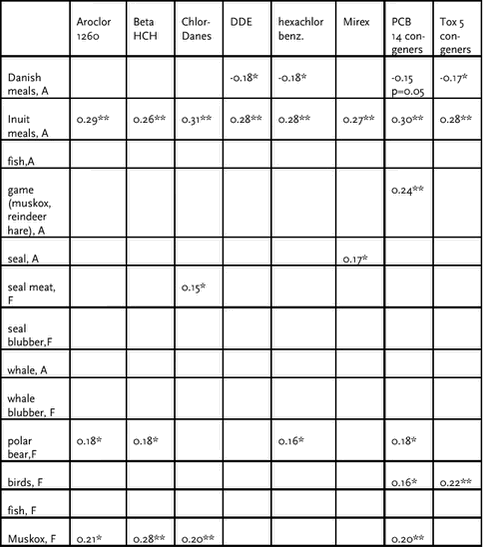
All the POPs are positively correlated with n-3 fatty acids and most of them highly significantly. This strongly documents that n-3 fatty acids and the POPs come from the same sources into the human body, and that these sources are the marine animals. Furthermore in particular plasma 22.5.3 was strongly and highly significantly correlated with all POPs. These associations were stronger and more significant than those found for 20.5.3 and 22.6.3 and for the n-3/ n-6 ratio.(table 4.3.22) The bivariate correlations between the reported dietary frequencies and the POPs supported the same picture, although the associations were not quite as consistent and strong, table 4.3.23, shown for 182 Inuits on the East coast 1999-2000. 4.3.6 Associations between contaminants and other factors4.3.6.1 Versus diet and dietary markers Bivariate correlation coefficients between dietary frequencies and plasma fatty acids are shown in table 4.3.22 along with correlations between plasma POPs and plasma fatty acids. The correlations between dietary factors and plasma POPs are shown in table 4.3.23, only the strongest associations are shown. The frequency of reported seal intake per month was consistently correlated with all long-chain n-3 fatty acids and the n-3/n-6 ratio. Polar bear intake was strongly associated with 22.5.3. Apart from that neither fish, birds, nor whale intakes were correlated with fatty acids. Table 4.3.23. Associations between dietary factors and lipid adjusted POPs. Pearson bivariate correlation coeffecients and significans levels, p<0.05*, p<0.01**, p<0.001***. Only significant associations are shown.
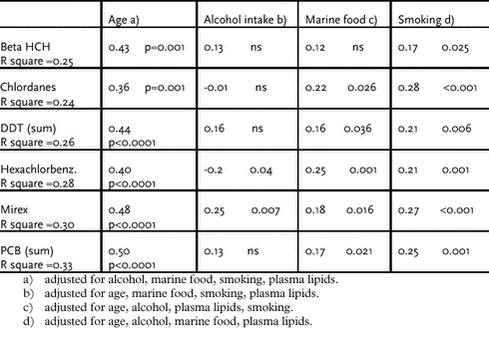
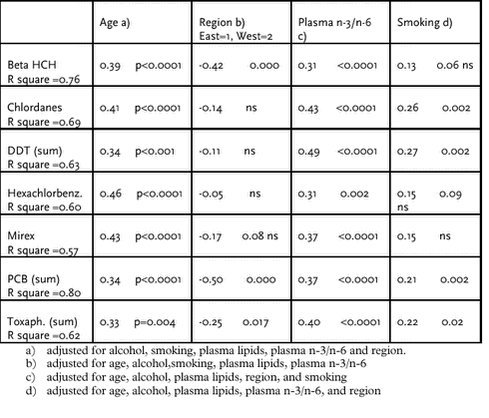
Although seal and whale blubber are known to contain high concentrations of almost all the lipophile POPs (Johansen et al, 2002, chapter 3), surprisingly neither the reported seal blubber or whale blubber intakes appeared to be related to the plasma POP levels. However, as stated above the fatty acid 22.5.3 which is highly prevalent in seal and polar bear blubber was strongly associated with all POPs. This suggests that the dietary questionnaire answers were not sufficiently valid to indicate specific sources of organic contaminants. 4.3.6.2 POPS and metals versus other lifestyles, smoking Not only diet but also other demographic and life style factors were predictors or determinants of high contaminant levels in blood. Since the substances are metabolized / excreeted at a very slow rate they are accumulated with age (bioaccumulated). Age is therefore always a determinant/ predictor of higher blood levels. But also a number of other lifestyle factors than diet seem to matter e.g. smoking and possibly alcohol intake. Multiple linear regression analysis (table 4.3.24) of pooled data (n=175) from the mother/infant surveys in Disko Bay, 1994-96 and 1997-98 shows parameters associated with high plasma POP levels (logarithmic concentrations) in maternal blood. Smoking is consistently and highly significantly correlated with high POP levels. Reduced models show that alcohol intake is not a predictor for for high POP levels except mirex.(Deutch and Hansen 2000). The same pattern is found in the geographical pilot study among men from 5 districts of Greenland, (table 4.3.25) here the objective measure, plasma n-3/n-6, is substituted for the more subjective “Marine food “ intake. Table 4.3.24. Multiple linear regression analysis of pooled data (n=175) from the mother/infant surveys in Disko Bay, 1994-96 and 1997-98 for parameters associated with high plasma POP levels (logarithmic concentrations) in maternal blood. Standardized correlation coefficients and p-values.
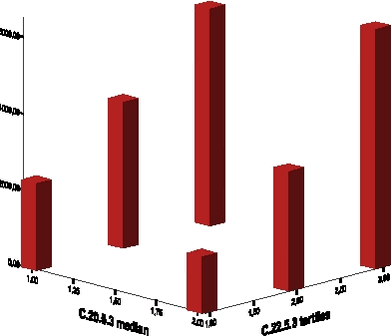
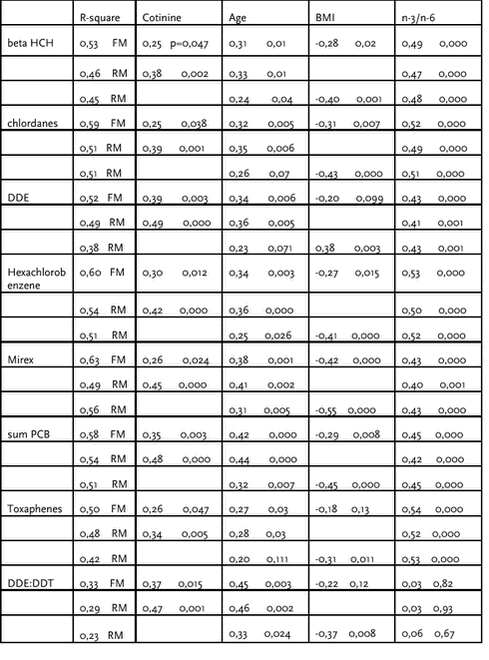
In the restricted crossectional study from Uummanaq, plasma cotinine was used as a biomarker of nicotin breakdown. Multiple linear regression analyses were performed using various models that were based upon the assumptions that POP accumulation depends upon the dietary source, the time of accumulation (age), and potential modifiers of the metabolism such as smoking (table 4.3.26) Most of the POPs were positively correlated with the age of the participants despite the narrow age span. The plasma POP concentrations (microgram /l) were positively associated with several plasma lipid fractions: total lipids, phospholipids and in particular with plasma triglycerides. BMI was also positively associated with plasma triglycerides. All the measured POPs: beta-HCH, sum of Chlordanes, DDE, Hexachlorobenzene, Mirex, the sum of 14 PCB-congeners (and individual congeners), toxaphene, and DDE: DDT ratio were significantly correlated with reported smoking status and plasma cotinine levels after adjustment for age, BMI and plasma n-3/n-6 ratio. The self reported “cigarettes per day” and “cigarette years” were also positively associated with plasma POPs but only borderline significant 0.05<p<0.10, not shown. Plasma cotinine (ng/l) indicator of smoking level gives the same associations as smoking level reported as never, previous, or present smoking status, Thus in general the more objective biological markers for diet and smoking respectively were better correlated with effects than the self reported questionnaire answers. In this group Body mass index, BMI, was found to be inversely correlated with POP accumulation in the whole group, but only significant for 5 out of 8 compounds. BMI was negatively associated with smoking status (non-smokerversus smoker) and smoking level among smokers. The results of multiple linear regression analysis showed that smoking (cotinine), age, Body Mass Index (BMI), and n-3/n-6 fatty acid ratios in plasma were important predictors for high blood levels of all the measured POPs with very high total R square values.This study has been reported and discussed in greater detail elsewhere (Deutch et al 2003) The same assumptions and multiple linear regression analuses were applied to the larger population sample from the East Coast. Among the 182 men and women from the East Coast a similar effect on POP accumulation of smoking and cotinine was found, however the significance levels were not as strong, this was mainly caused by a very small ratio of non-smokers making this groups too small for good statistical power. Regarding the above reported negative association between plasma POP concentrations and BMI, this effect was only found among men and not among women and therfor it is not a pure volume effect. The associations between various diet markers, lifestyle factors, and contaminant levels on the East Coast are illustrated by the figures 4.3.9, 4.3.11, 4.3.12 below. Figure 4.3.9. Plasma PCB (microgram/kg lipid) shown in a 3-dimensional plot as a function of plasma fatty acids (C22:5.3 medians and C20:5.3 tertiles) to illustrate the strong association with C22:5.3 from large marine mammals. Bars show Means
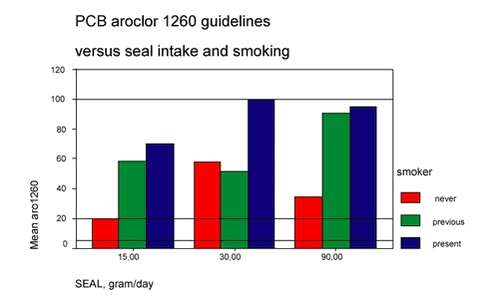
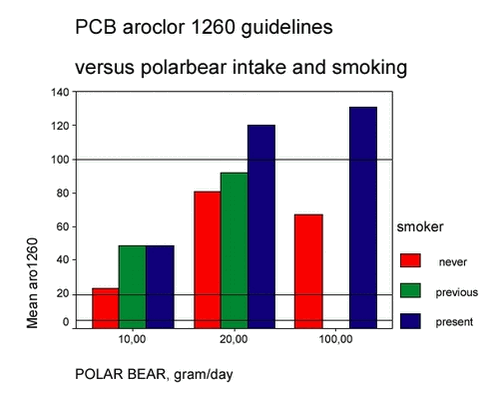
Figure 4.3.11. Plasma PCB-aroclor1260 , East Greenland, 2000-2001, (n=188) versus low, medium and high reported mean seal intake (15, 30, and 90 g/day) and present smoking status. Figure 4.3.12. Plasma PCB-aroclor1260 , East Greenland, 2000-2001, (n=188) versus low, medium and high reported mean polar bear intake (10, 20, and 100 g/day) and present smoking status. Table 4.3.26. Multiple linear regression analysis of parameters associated with high plasma POP levels in 48 Inuit hunters from Uummanaq, Greenland. Dependent variable: Triglyceride adjusted plasma POPs (natural logarithm) versus the independent variables cotinine, (ng/l), age, BMI and phospholipid-n-3/n-6, (full model, FM) and for reduced models (RM) with BMI or cotinine removed. Standardized correlation coefficients and p-values are shown (Deutch et al 2002).
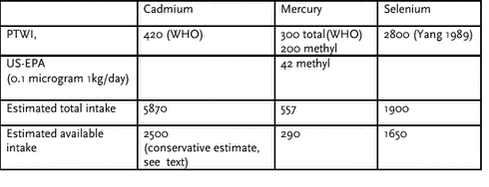
4.3.7 Dietary exposure from local food items.In chapter 3, “Contaminants in Subsistence animals in Greenland”, Johansen et al (2003) have presented contaminant data concerning both heavy metals and organic pollutants measured in a number of local animal and plant products which have been collected along the South western coast of Greenland. The list covers several species of seabirds, a few species of landbirds, 5-6 species of marine fishes and two fresh water species. From larger animals it includes the 3 most commonly eaten species of seals and whales in addition to all the mammalian terrestrial species. From almost all the species samples have been analyzed from both meat, liver, kidney and fatty tissue especially blubber. The list (table 3.4) mainly contains data regarding Cd and Hg and only very few data on Pb, the organochlorines are listed in tables 3.5and 3.6. The metal analyses have been performed for a slightly larger number of species than the analyses of organic contaminants. In this report data for Polar bear only contains heavy metals no organochlorines. So although the list is not yet complete it covers a substantial and representative selection of locally eaten Greenland food items in South Western Greenland.Thus in principle it is possible to use these data for at least a provisional estimation of the human dietary exposure form local food to the contaminants concerned. Pars (2000) have made an extensive dietary survey in South Western Greenland (N=410, 180 men and 230 women) using several parallel dietary methods to probe the issue. From a semi quantitative food frequency questionnaire she has obtained mean intakes in gram per day for a large number of local food items. These two above mentioned data sets have been used to calculate the relative exposure contributions from the various local food items as well as the total human dietary exposure to heavy metals, (Cd and Hg) and organochlorines: BetaHCH, Chlordanes, DDT, Hexchlorobenzene, and PCB as well as the intake of selenium. In the chapter 3, Johansen et al (2003) present PCB both as sum of PCB s which includes 104 congeners and as sum of 10 congeners, which has been used in the following calculation because this value closely overlaps with the 14 congeners used in the Human Health studies. Both for mercury and selenium special calculations have been performed, not only for the total intake but for the bioavailable intake,which is a more realistic measure of the possible toxicological effect and for comparison with “Provisional Tolerable Weekly Intake”, PTWI. However, it should be emphasized that the local food is only about 25 % of the total diet and also the imported food contains a certain level of contaminants. The calculations are based upon the following assumptions: Daily mean intakes (gram) are based on men from all age groups, the total bird intake (20 g) is evenly distributed on the four types of seabirds with available contaminant data. The total fish intake (60g meat and 7 g liver) is distributed proportionally on the most commonly eaten species namely Atlantic cod and Greenland halibut. The whale intake (15 g meat, 6 g blubber, 1 g liver, 0.3 g kidney and 21 g muktuk) is evenly distributed on the three included species, Minke whale, Beluga, and Narwhal. Regarding seal intake (73 g meat, 30 g blubber, 11g liver and 9 g kidney) the dietary survey does not discriminate among different species. Thus Ring seal, which has the most complete contaminant data has been used, and together with Harp seals it is the most commonly eaten seal in Greenland (Piniarneq 2001 in Hansen 2001). For some species the dietary survey distinguishes between spring and fall consumption, if so, the calculation is based upon an average between the seasons. No dietary survey results are presented for marine invertebrates, Caribou, and Polar bear, thus these are not included in the calculations. Polar bear is very rarely consumed on the West Coast except in the far North. 4.3.7.1 Metals For the calculation of the relative and total bioavailable intakes of mercury and selenium, it has been assumed that in liver and kidney about 90% of the mercury is selenium bound on a one-to-one molar basis and therefor unavailable, according to Egeland et al (1998). Regarding comparison with Provisional tolerable Weekly Intakes, PTWI it has been assumed that the average person in the dietary study weighs 60 kg., which is probable an underestimation of about 15 %. Table 4.3.27 Provisional calculated weekly intakes of the heavy metals Cd, Hg and of Se compared to guideline values for Provisional Tolerable Weekly Intakes, PTWI (micrograms per 60 kg person per week.
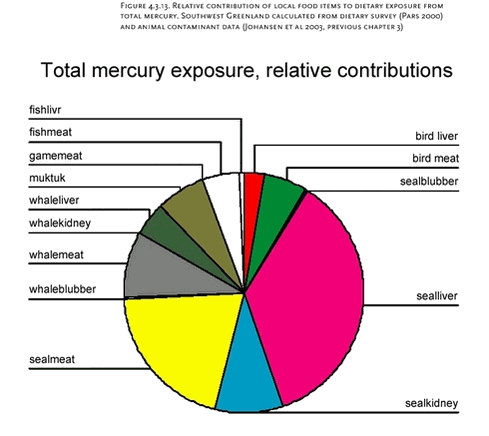
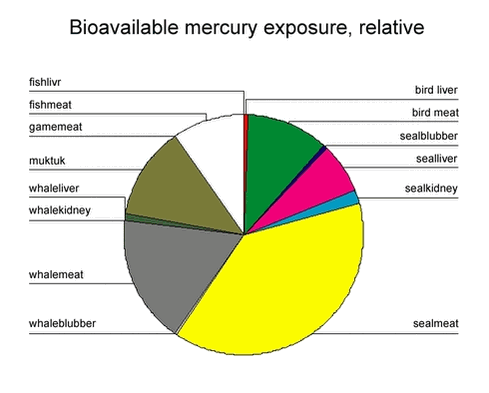
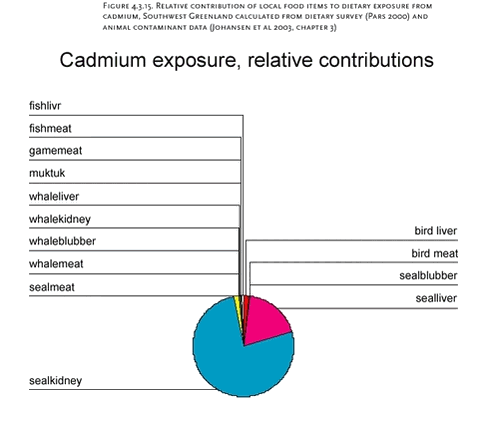
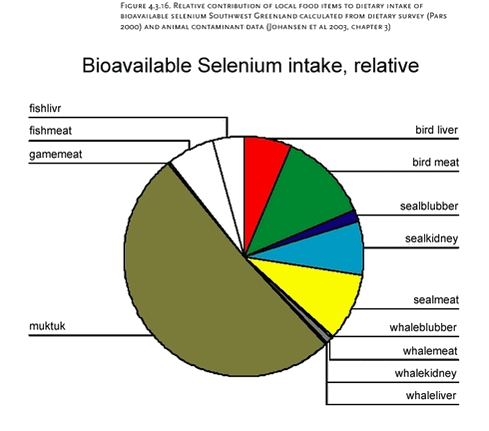
The estimated intake of Cadmium seems extremely high and may not be realistic, The relative contribution from various food organs is shown below in a Pie graph, figure 4.3.15, about 75 % (4466 microgram) is ascribed to seal kidney. which has a listed Cd content of 70.4 microgam per gram (ring seal) and estimated intake of once a month or 9 grams a day (Pars 2000). The Cd concentration in Ring seal kidney is somewhat but not unrealistically higher than harp seal (21 microgram) and hooded seal (47 microgram). But the estimated weight intake of seal kidney may be an overestimation. However even if both the concentration of Cd and the intake of kidney were reduced to 50%, the contribution from kidney would be 1100 and the total estimated Cd intake would be approximately 2500 microgram per week, still way above the PTWI. In a previous publication Johansen et al (2000) estimated the weekly Cd intake to be 1004 microgram but Seal kidney was not included. How much of the Cd intake is taken up is another question but it is assumed that it is very low and depends on the dietary source and body iron stores and serum-ferritin. Cd-uptake is negatively correlated with serum ferritin (Vahter et al 1996).The iron status and serum ferritin is high in Greenland and positively correlated with intake of traditional food (Milman et al 2001). Blood levels of cadmium are usually higher among Inuit populations than among caucasians (AMAP 1998, Human Health Chapter 12) typically north Europeans have mean Cd blood levels < 0.5 microgram/litre whereas Inuit populations have Cd blood levels >1.2, see also this chapter 4.3.3.3.1. However, the mean blood Cd levels are not significantly correlated to intake of traditional food or plasma n-3/n-6 but highly significantly correlated to smoking (r =0.37 p<0.001***) which may account for as much as 60 % of the total burden.. Thus the high Cd levels in the traditional food items appear not to be a very important contributor to human Cd levels in Greenland (Hansen et al 1990 , Deutch et al 2003) The the distribution of total and bioavailable mercury and selenium intakes are illustrated below in pie graphs (figures 4.3.13-4.3.16) The relative and total estimated intakes of mercury and Selenium (table 4.3.27) seem more realistic and the total intakes are below or close to the PTWI, (Yang et al 1989). However these numbers are about 50% lower than and not in particularly good agreement with a previous publication by Johansen et al (2000) which were calculated in the same way but included fewer food items (meat and liver) in the study. It only demonstrates the great difficulties in making exposure estimates from calculated intakes. The Pies show that the main contributors to bioavailable mercury intake are seal and whale meat, whereas the contribution from internal organs liver and kidney are of much less importance. The absolutely dominating contributor to bioavailable Se intake is not surprisingly muktuk, but other good sources are organs and meat of all marine animals. 4.3.7.2 Organochlorines Below similar calculations are performed for organochlrines using the values presented by Johansen et al in tables 3.5 and 3.6 Table 4.3.28 Provisional calculated intakes of various POPs compared to guideline values. The calculations are based upon (n=180) from a dietary study by Pars(2000) and animal contaminant data by (Johansen et al 2003)
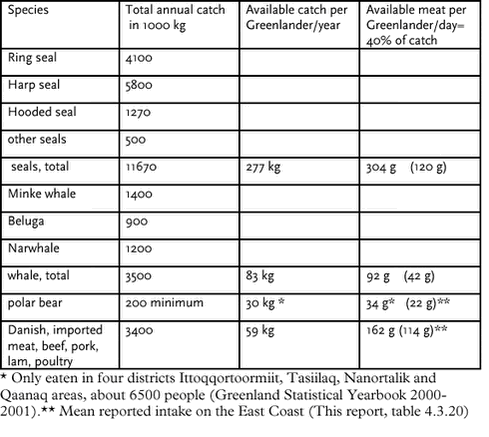
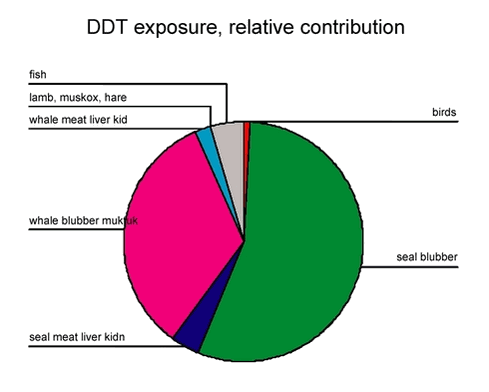
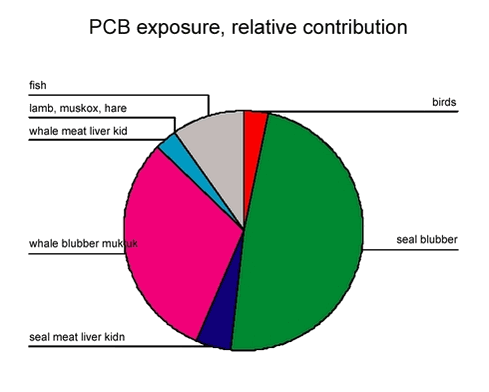
In the animal studies the authors report PCB levels as sum of 10 congeners, among these ten, nine are included in the 14 congeners which are usually used in the human health studies. And since these nine are those that occur in the highest ratios, the sum of PCB-10 only deviates slightly from the sum of PCB-14. The table 4.3.28 above shows that provisional calculated intakes of PCB and chlordanes exceed the Canadian TDI’s. The DDT and hexaclorobenzene guidelines are not close to TDI values, but beta HCH is 25% of TDI which means that some fraction of the study group exceeds the TDI. Pie graphs are shown below to illustrate the relative contribution by food items to POP intakes (PCB and DDT) it is obvious the seal blubber followed by whale blubber are the main contributors to the intake of lipophilic organic contaminants, Figures 4.3.17 and 4.3.18. These calculations are based upon animal contaminant levels and human diets on the in the South West of Greenland, and as yet we do not have comprehensive animal data available to perform similar calculations for East and North Greenland. However, provisional data show that the PCB content in seals from East Greenland (Ittoqqortoormiit) is more than double that in West Greenland, and that DDT content is more than 50% higher. The results from dietary surveys from East Greenland 2000 are shown in tables 4.17-4.20 and figures 4.3.2-4.3.8. These surveys show that polar bear is consumed in both Ittoqqortoormiit (30 gram/day) and Tasiilaq (10 gram/day). Contaminant levels for Svalbard polar bears (AMAP 1998) indicate that just one gram of polar bear fat a day (15.000-31.000 microgram PCB/gram) would increase the PCB intake by more than 75% compared to the table above (4.28). It is therefor evident that on the East coast of Greenland the consumption guidelines for PCB are strongly exceeded. Dietary surveys are very difficult to conduct and especially difficult regarding accurate answers about portion sizes. It is therefor relevant to validate intake estimates by other methods or sources. According to the official catch statistics (Piniarneq 2001 in Hansen 2001), the following meat weights are available to the Greenland population of 55000 persons. (Among these 13.000 Danes probably do not eat much seal and are excluded from the calculations and it is assumed that the 28.000 sleighdogs eat the waste, bones, skin offal, and some blubber) Table 4.3.29. Official catch statistics and meat availability in Greenland 1998 (Piniarneq 2001, Hansen 2001). Reported intakes in parenthesis. (Pars 2000)
The above table shows the “available” seal meat per Greenlander per day to be over 300 grams. This shows that the estimates of seal and whale intakes used in the calculations above, a total of 120g seal products, and 42 g whale products per day, are not over estimations, probably the opposite. Therefor the estimated exposure from contaminants can considered to be conservative. And the real situation may be much more serious. The numbers also indicate that the natural resources are plentiful and a considerable amount of meat may be wasted. Although provisional all the calculations above point to the same conclusion that the contaminant contents of mercury, cadmium, PCB and chlordanes in the major local food items and the total diets are above guideline levels. These results are consistent with the guideline exceedances for human blood levels of mercury and PCB aroclor presented in table 4.3.17, which show exceedances in all parts of Greenland but at a much higher level at the East coast that at the West coast. The exceeding percentages are also high in Uummanaq, North West Greenland. Figure 4.3.14. Relative contribution of local food items to dietary exposure from bioavailable mercury. Southwest Greenland calculated from dietary survey (Pars 2000) and animal contaminant data (Johansen et al 2003, previous chapter 3) Figure 4.3.17. Relative contribution of local food items to dietary exposure from DDT. Southwest Greenland calculated from dietary survey (Pars 2000) and animal contaminant data (Johansen et al 2003, chapter 3) Figure 4.3.18. Relative contribution of local food items to dietary exposure from PCB Southwest Greenland calculated from dietary survey (Pars 2000) and animal contaminant data (Johansen et al 2003, chapter 3) 4.4 SummaryThe AMAP Human Health programme in Greenland has monitored persistent organic pollutants and heavy -metal contaminants as blood levels among several population groups in Greenland during 1997-2001. The general protocol for the sample collection and analyses are in accordance with the program agreed upon by the international Human Health Expert Group in 1992 and later revisions. The programme has been approved by the Ethic Committee for Scientific Studies in Greenland. The first phase of this programme was carried out from 1994-96. During the interim phase in 1997 heavy metals were not measured The primary target group were pregnant women and infants, from 1999 these were supplemented with men and non-pregnant women of fertile age to obtain larger and more representative population samples. In addition to blood contaminants, dietary markers (Selenium and fatty acids) were also determined and questionnaires supplied information regarding demographic, anthropometric and lifestyle factors (smoking and dietary habits). 4.4.1 Heavy metalsIn both pregnant women, non-pregnant women and men the same general picture was drawn regarding blood levels of total mercury (Hg), cadmium (Cd), and lead (Pb). The lowest geometric mean blood levels of mercury were found in Nuuk (4.5 microgram/litre) slightly higher levels were recorded in Disco Bay (12.5 microgram/litre) and the East Coast (10.5-26.0 microgram/litre) and the highest in Uummanaq (52.0 microgram/litre). These mean blood levels were also reflected in the number of samples which exceeded the US-EPA guidelines for blood mercury of 4.4 microgram/litre. Among pregnant women in Nuuk 44% exceeded the guideline and in all other population groups 80-100% exceeded the guideline value. Also the 20 microgram/litre, WHO guideline value was exceeded by more than 25% in all groups (except among 8 pregnant women from Ittoqqortoormiit). Mean cadmium and lead blood levels were only moderately high. The Cd levels ranged from 0.66 microgram/litre in Tasiilaq to 1.65 microgram/litre among men in Ittoqqortoormiit. The higher Cd levels reflected the smoking levels among the subgroups. The Cd levels among smokers in Uummanaq was found to be double as high as among non-smokers. The Pb levels ranged from 23.8 microgram/litre among pregnant women in Tasiilaq to 70.7 micrograms/litre among men in Ittoqqortoormiit, again the level of smoking may have influenced the level. The Pb guideline value of 100 microgram/litre was exceeded only by low percentages of blood samples among these the highest were 14 % in Uummanaq and 10% in Ittoqqortoormiit. 4.4.2 OrganochlorinesThe geographical pattern of blood levels of persistent organic pollutants was slightly different from the pattern of heavy metals. The highest general blood concentrations of POPs were found in Ittoqqortoormiit especially among men. This was first shown in the geographical pilot study collected in 1997 and the levels were confirmed by measurements among larger population samples in 1999-2000. Hexachlorophene, betaHCH and Toxaphenes were relatively evenly distributed geographically but chlordanes , DDTs and particularly PCBs were at very high levels in Ittoqqortoormiit, in fact the PCB levels were about 3-4 times higher than in the other locations, and should be considered the highest measured among Arctic populations (AMAP International report, Human Health 2002) The mean blood levels of PCBs were also consistent with the number of blood samples exceeding the Canadian guideline values for PCB-Aroclor1260. In all locations except Disco Bay and Nuuk (1999) 93-100% of blood samples exceeded the 5 microgram/litre “Level of Concern” for pregnant (and fertile) women and among men in Ittoqqortoormiit 60% of samples (1997) and 43%(2000) exceeded the 100 microgram/litre guideline “Level of Action” 4.4.3 Dietary Markers4.4.3.1 Fatty acids The ratio of plasma fatty acids (n-3/n-6) indicates the relative consumption of traditional and imported food of which a high n-3/n-6 ratio indicates a high intake of traditional food (of marine origin). The ratio was highest in Nanortalik (0.66) and Uummanaq (0.60) and lowest in Nuuk (0.21). However it was also relatively low among men in Ittoqqortoormiit (0.27) year 2000. 4.4.3.2 Selenium Whole blood selenium was also highest in Uummanaq namely 354 microgram/litre and lowest in Nuuk (140 microgram/litre). A high Selenium level indicates a high intake of meat from marine animals and in particular of muktuk. 4.4.4 Dietary surveysA dietary survey by semi quantitative food frequency questionnaire performed among 190 persons on the East Coast showed that the relative intake (weight) of traditional food was 25-30%, and slightly higher in the North, Ittoqqortoormiit, than in the South, Tasiilaq. The food was more versatile in Tasiilaq both concerning composition of traditional food which contained more fish and of imported food, which contained more fruit and vegetables. The mean value of the total intake of traditional food was about the same as found in a previous study on the West Coast (Pars 2000). Thus the total intake of traditional food can therefor not be considered different between East and West Greenland although there were various differences in composition. One of the more important differences was that polar bear is consumed frequently on the East coast but is not common on the West Coast except in the north. 4.4.5 Dietary exposure from contaminantsCalculations using dietary survey data and animal contaminant data showed that seal blubber was the major contributor and whale blubber the second contributor of all the lipophilic organic pollutants, in reality all the pesticides and PCBs measured in the programme. Using information on the relative bioavailability of metals in different anaimal tissues it was furthermore calculated that seal-(and whale meat) were the main contributors of methyl mercury and that seal kidney was the predominant contributor of cadmium. Comprehensive contaminant data were not available from the east coast but the higher levels of PCB and DDT in ring seals (chapter 3) were consistent with the higher blood levels found in human beings. 4.4.6 Predictors of high contaminant levelsMultiple linear regression analyses of results from Disko Bay 1994-97, the geographical survey 1997 , Uummanaq 1999, and the latest results from the East Coast 2000 showed the main predictors of high blood levels of persistent organic pollutants to be: age, smoking (cotinine), and high n-3/n-6 ratio indicating high intake of traditional seafood, also district was a major determinant. Whereas gender itself was not a predictor , lifestyles, particularly smoking, but also traditional food intake varied between the two sexes and therefor exposure was sometimes higher among men than among women 4.4.7 Time trends.In Ummanaq the mean blood level of mercury increased significantly between 1979 and 1999, whereas the mean blood levels of Pb had dropped significantly among men in Uummanaq since1979 and among men and women in Tasiilaq since 1981. Previous measurements of organic pollutants were not available and the time period within the AMAP study was too short and the material insufficient to detect any possible time related changes in organic pollutant levels. 4.5 ReferencesAMAP Assessment report 1998. Arctic Pollution Issues AMAP Report on Issues of concern 2000 Bjerregaard P, and Hansen, JC. Organochlorines and heavy metals in pregnant women from the Disco Bay area in Greenland. Science Tot Environ 2000; 245 (1-3):195-202. Bjerregaard P, Pedersen HS, and Mulvad G. The associations of a marine diet with plasma lipids, blood glucose, blood pressure and obesity among the Inuit in Greenland. Eur J Clin Nutr 2000 ; 54: 732-737. Deutch B. Lifestyle and contaminants in Greenland 1994-1996. Master of Public Health Thesis; Publication No 11, Aarhus University 1999 Deutch B, and Hansen JC. High Blood levels of persistent organic pollutants are statistically correlation with smoking. Int J Circumpolar Health 1999;58:214-219 Deutch B, and Hansen JC. High human plasma levels of organochlorine compounds in Greenland . Regional differences and lifestyle effects. Dan Med 2000;47,2:132-137. Deutch B, Pedersen HS. Bonefeld-Jørgensen EC, Hansen JC. Smoking as a determinant of high human organochlorine levels in Greenland. Archives of Environmental Health 2003; 58, 1: 1-7. Dietz R, Riget F and Johansen P. Lead, cadminum, mercury, and selenium in Greenland marine animals. Sci Total Environment 1996;186:67-93. Egeland GM, Feyk LA and .Middaugh JP. The use of traditional foods in a healthy diet in Alaska. Bulletin , State of Alaska Epidemiology 1998; 2,1:1-140. Hansen JC. A survey od human exposure to mercury, cadmium and lead in Greenland. Man and Society 1981; 3 1-16 Hansen JC. Human exposure to metals through consumption of marine foods: a case study of exceptionally high intake among Greenlanders. In “Heavy metals in the Marine Environment” Furness RS, Rainbow PS (eds) CRP Press.Boca Raton, Florida 1990; 227-243. Hansen JC. Dietary selenium intake among Greenlanders. Bulletin of Selenium-tellurium. 2000 Oct 1-4. Hansen KG, Mulvad G and Pars T. Kalaalimernit. Inussuk. Arktisk Forskningsjournal 1997,1-168 Hansen K. Farvel til Grønlands Natur. Gads Forlag . København 2001. ISBN 87-12-03789-3. Johansen P, Pars T., and Bjerregaard P. Lead, cadmium, mercury, and selenium intake by Greenlanders from local marine food. Science Total Environ 2000; 200:187-194. Johansen P, Asmund G, and Riget F. Lead contamination of seabirds harvested with lead shot- implications to human diet in Greenland. Environ Pollut 2001;112(3):501-504. Johansen P., Muir D., Asmund G., Dietz R., Contaminauts in Subsistence animals in Greenland. Danish Environmental Proction Agency. 2003 vol Human Health, AMAP Greenland and the Faroe Islands. Chapter 3. Kuhnlein HV, Kubow S. and Soueida R. Lipid components of traditional Inuit foods and diets of Baffin Island. J. Food Composition and Analysis. 1991 (4) 227-236 Kuhnlein HV, Receveur O, Muir DCG, and Chan HM. Arctic indigenous women consume greater than acceptable levels of organochlorines. Community and International Nutrition 1995a: 2501-2510. Kuhnlein H.V., O. Receveur N.E. Morrison, D.M. Appavoo, R. Soueida, and P. Pierrot. Dietary nutrients of Sahtu Dene/Metis vary by food source, season and age. Ecol. Food. Nutr 1995b. 34 (3) 183-195. Kuhnlein H.V., R.Soueida and O. Receveur. Dietary nutrient profiles of Canadian Baffin Island Inuit differ by food source, season and age. J. Am diet Ass.1996 ;96,2:155-162. Lagueux J, Pereg, D. Ayotte,P., Dewailly,E. and Poirier, G.G.. Cytochrome P- 450 CYP1A1 enzyme activity and DNA adducts in placenta of women environmentally exposed to organochlorines. Environmental research Section A, 1999; 80: 369-382 Milman N., Laursen, J. Pedersen,H.S. Mulvad,G. Jul,E. Saaby,H.and Hansen.J.C. Elements in autopsy liver tissue samples from Greenlandic Inuit and Danes. II Iron measured by X-ray fluorescence spectrometry. J Trace Elem med Biol 2000 14,2:100-107. Pars T.. Forbruget af traditionelle grønlandske fødevarer i Vestgrønland. Ph D thesis, University of Copenhagen 2000. Pedersen H.S.. Det Grønlandske Obduktionsprojekt. Athero sclerose og intracerebral hæmoragi i relation til fedtsyre sammensætningen i fedtvæv og validering af dødsårsagsmønstret. PhD Thesis Aarhus University 2000 (in Danish and English) Tjønneland A, Overvad K, ThorlingE, Ewertz M. Adopose tissue fatty acids as biomarkers of dietary exposure in Danish men and women. Am J Clin Nutr 1993;57:629-33. Yang GQ, Gu RH, Zhou SA, Yin L, Gu B, Yan YQ, and Lin YQ. Studies of safe maximal dietary Se-intake in a Seliniferous Area in China. Part 1. Selenium intake and tissue selenium levels of the inhabitants. J trace Elem Electrolytes Health Dis 1989;3:77-87. Vahter M, BerglundM, Nermell B. Akeson A. Bioavailability of cadmium from shellfish and mixed diet in women. Toxicol Appl. Pharmacol 1996; 136(2):332-8 Willet W.. Nutritional Epidemiology. Oxford University press. New York Oxford 1998 Aarkrog A, Aastrup P, Asmund G, et al. Environmental Project No 356. Danish Environmental protection Agency 1997. |
