AMAP Greenland and the Faroe Islands 1997-20016 The Human Health programme in the Faroe Islands 1985-20016.1 Introduction6.2 Effects of marine pollutants on development in Faroese children 6.2.1 Introduction 6.2.2 Methods 6.2.3 Results 6.2.4 Discussion 6.2.5 Conclusions 6.2.6 Summary 6.2.7 Appendix 6.3 Dietary Survey of Faroese Women in Third Trimester of Pregnancy 6.3.1 Material and Methods: 6.3.2 Results 6.3.3 Discussion: 6.4 Exposure to Seafood Contaminants and Immune Response in Faroese Children 6.5 Exposure to mercury and organochlorines 1985-2001. 6.5.1 Introduction 6.5.2 Mercury in maternal blood 6.5.3 Mercury in maternal hair samples 6.5.4 Mercury in umbilical cord blood 6.5.5 Mercury in breast milk 6.5.6 MeHg in hair in children 6.5.7 Mercury in children at age 7 years 6.5.8 PCB in maternal serum 6.5.9 PCB in cord blood 6.5.10 PCB in breast milk 6.5.11 Lead in cord blood 6.5.12 Selenium 6.5.13 Other contaminants in maternal serum 6.5.15 Contamination levels in two consecutive pregnancies 6.5.16 Influence of dietary recommendation 6.5.17 Diet during pregnancy 6.5.18 Comparison of contamination in Faroese and non-Faroese mothers 6.5.19 Description of study populations 6.6 Acknowledgement 6.7 References By Pál Weihe, Ulrike Steuerwald, Sepideh Taheri, Odmar Færø, Anna Sofía Veyhe, Did Nicolajsen. 6.1 IntroductionResearch on prenatal exposure to seafood contaminants and the potential effects on the foetus has been performed in the Faroes since 1985. This research has been carried out as a cooperation between the Department of Occupational and Public Health in the Faroese Hospital System and the Department of Environmental Medicine of the University of Southern Denmark. In addition to funding from the Danish Environmental Protection Agency and the Danish Medical Research Council, substantial support has been obtained from the U.S. National Institutes of Health and the European Commission. In this report we will present preliminary results of studies financed by Arctic Monitoring and Assessment Program, under the following headings:
6.2 Effects of marine pollutants on development in Faroese children6.2.1 IntroductionConsumption of marine food in preference to other food is generally considered to be healthy. But different contaminants such as persistent organic pollutants (POP) and heavy metals – in this case methyl mercury – might outweigh the advantages. The Faroese are known to be heavily dependent on seafood. Thus the exposure to some pollutants is very high in this population. Of special concern for the Faroese population are the following substances: Organochlorine compounds, such as polychlorinated biphenyls (PCB) and chlorinated pesticides (4,4‘-DDT, and its most stable daughter compound 4,4‘-DDE, trans-nonachlor, ß-HCH, HCB), have long been problematic in the environment for a number of reasons. Many of them (like DDT) have endocrine activity, therefore called hormonally active agents (HAAs). The term organochlorine refers to chemical compounds that have a chlorinated hydrocarbon structure; that is, they are formed from atoms of hydrogen, carbon, and chlorine. Although their effect may be much weaker than the body’s natural hormones (like oestrogens, androgens, and thyroid hormones), they are nonetheless suspected of disrupting the endocrine system, resulting in harmful effects like reproductive and developmental defects. In humans, an association between breast cancer risk and PCB and DDT concentrations in mammary adipose tissues or plasma lipids could be shown in epidemiological studies (Dewailly et al., 1994). They are suspected to promote the progression of certain hormonally responsive tumors of the breast and uterus, especially DDT, b-HCH, HCB. According to animal research, organochlorines may be able to modulate immune response. Most of the substances have been banned for years, but due to their longevity in the environment, PCB, dieldrin, DDT, chlordane, aldrin, kepone, mirex, endrin, and toxaphene still constitute a public health problem. Human exposure to these contaminants is mainly through the consumption of food, particularly food caught in contaminated waters. Polychlorinated biphenyls (PCBs) are divided into two main classes of congeners, the ortho-substituted and the non-ortho-substituted, which differ in their toxicology. The number of chloride atoms in the ortho-position of the two phenyl rings of the PCBs is responsible for the strength of the dioxin-like effect of the respective congener: the fewer the atoms in the ortho-position, the higher the dioxin-like toxicity. Thus, the planar or non-ortho congeners (IUPAC-numbers 77, 126, and 169) have a higher dioxin-like toxicity than the mono-ortho congeners (IUPAC-numbers 105, 114, 118, 123, 156, 157, 167). The toxic effect of PCBs and dioxins is mediated through binding to the cytosolic arylhydrocarbon (Ah)-receptor (Poland et al., 1992). The toxicity of the di-ortho PCBs (IUPAC-numbers 138, 153, 170, 180) depends on different mechanisms that are still being explored. 4,4’-dichlorodiphenyltrichloroethane (DDT) was used as an insecticide in agriculture. Nowadays it is banned in Europe, but it is still important in countries with serious mosquito borne disease problems such as malaria. 4,4’-dichlorodiphenyltrichloroethene (DDE) is the most stable daughter compound of DDT. DDE itself is persistent and bio-accumulating. Both substances accumulate in fatty tissue. DDT can mimic the effects of oestrogen, and DDE can be anti-androgenic (AMAP, 1997). Trans-nonachlor is a breakdown product of a mixture of different compounds, called chlordane, which is used as pesticide. It has major effects on the liver, the nervous system, and the immune system. It is also a probable human carcinogen. Hexachlorobenzene (HCB) is a by-product in the production of a large number of chlorinated compounds. It was also used as a fungicide. Hexachlorocyclohexanes are a group of compounds that are primarily used as pesticides. The most toxic form, gamma-hexachlorocyclohexane, is also called lindane. Due to its persistence, beta-hexachlorocyclohexan (b-HCH) usually is measured (AMAP, 1997). Effects of HCB and b-HCB are similar to those of the other mentioned pesticides (see the paragraph about trans-nonachlor), they all are excreted via breast milk. An overview of the range of effects of organochlorines is given here:
Musk xylene, a synthetic aromatic substance, is often used in fragrances and soaps as a substitute for natural musk. It belongs to the group of nitromusk compounds. The main environmental intake of musk xylene occurs via consumption of fish and drinking water as well as the use of body care and perfumed household products. Musk xylene is stable against biological and chemical degradation and is highly lipophilic (Kafferlein et al., 1998). A genotoxic risk for humans has been assumed (Mersch-Sundermann et al., 1996). Methylmercury (MeHg) is a well-established neurotoxicant that can cause serious adverse effects on the development and functioning of the human central nervous system (Harada, 1995; Grandjean et al., 1997). Methylmercury exposures to women of childbearing age are of great concern because a foetus is highly susceptible to adverse effects (CDC, 2001), even for low-dose exposure (Committee on the Toxicological Effects of Methylmercury, 2000). Methylmercury inhibits the growth of the foetal brain and the migration of neurons from the embryological generation layer to the final destination in the brain. This causes microcephalus in severe cases, and lower exposures result in behavioral changes and reduced cognitive and motor abilities. Methylmercury interferes with microtubule formation, cell division, and neural protein synthesis, all of which could explain the effects described above (WHO, 1990). Epidemiological studies have therefore applied neurobehavioral tests as outcome parameters. Using domain-related neuropsychological tests in the Faroes study, a doubling of prenatal methylmercury exposure was associated with a delay in development of 1-2 months at age 7 years. This delay corresponded to about 10% of the standard deviation of the test results. Thus, the children were generally healthy, subtle neurodevelopmental effects were associated with increased mercury exposures (Grandjean et al., 1997). There is also evidence that exposure to MeHg can have adverse effects on the cardiovascular system (blood-pressure regulation, heart-rate variability, and heart disease) even below MeHg exposure levels, which were found to be associated with neurodevelopmental effects (Committee on the Toxicological Effects of Methylmercury, 2000). Regarding cardiovascular toxicity at low-level methylmercury exposures, a Finnish population study showed that increased exposure from fish constituted a risk factor for cardiovascular mortality in adults (Ashby et al., 1990). Children with mercury poisoning often have increased heart rate and blood pressure (Sørensen et al., 1999). The toxicological effects of methylmercury can, therefore, be summarized thus: carcinogenicity, genotoxicity, immunotoxicity, negative effects on the reproductive system, renal toxicity, cardiovascular effects, and neurotoxicity with a specific emphasis on the developing central nervous system. To further evaluate the effects of prenatal exposure of the foetus to mixture of marine pollutants, a study was initiated in the Faroe Islands. As study design a prospective longitudinal cohort study was chosen. Samples were collected of maternal serum at week 34 of pregnancy (last antenatal consultation at the hospital), umbilical cord blood and serum, maternal hair at parturition, and breast milk on days 3-5 post-parturition (prior to mother and child were being discharged from hospital). Nutritional habits were recorded by questionnaire (number of whale meat dinners per month during pregnancy and before pregnancy; number of fish dinners per week; ingestion of blubber with whale meat or fish). The infants were examined neurologically at about 2 weeks of age. The results of the methyl mercury levels in maternal hair and the determination of organochlorines levels in breast milk are presented. These values, which are known to correlate very well with the concentration of the pollutants in maternal and cord blood, are presented below. The effects of the pollutants on the neurological status of the infants and on the infants’ on the anthropometric data are analyzed. The purposes of the study are:
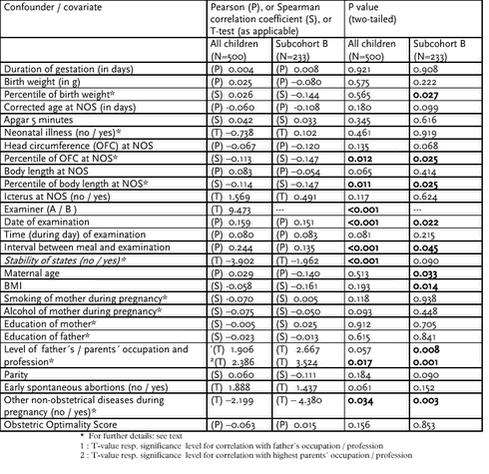
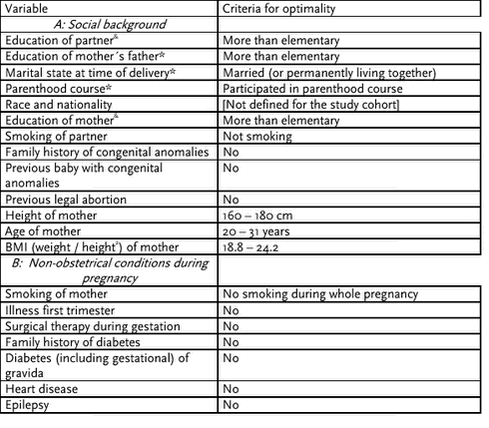
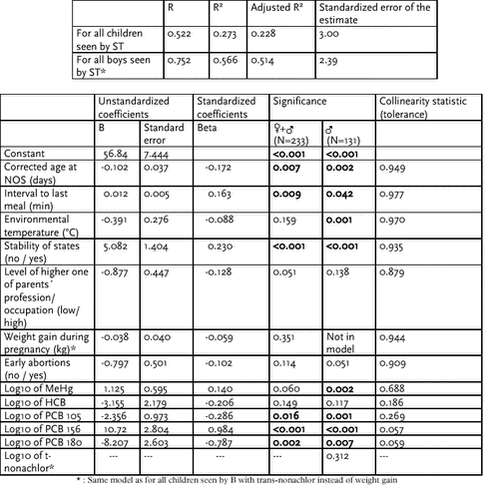
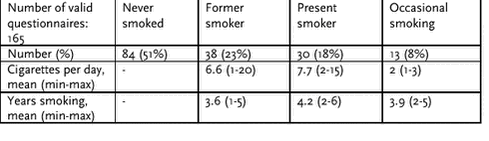
6.2.2 Methods6.2.2.1 Subject recruitment Women who intended to deliver at the Central Hospital in Tórshavn were invited in the last trimester of pregnancy by letter to participate in the project. If they agreed, around week 34 of pregnancy (co-inciding with the last antenatal consultation at the hospital) a 50 ml blood sample was collected by phlebotomy for determination of organochlorine concentration and estrogen-like substances. In connection with the delivery, cord blood and serum, and a sample of maternal hair (100 mg) were taken. Before mother and child were discharged from the maternity ward (between day 3 to 5) a sample of breast milk was collected. Blood and milk samples were stored at minus 80° C. At approximately two weeks of age (adjusted for complete 40 weeks of gestation), the infants were examined according to the neurological optimality schedule (Prechtl, 1977). At that time all relevant obstetric data, information about smoking and alcohol consumption, as well as important socioeconomic data about the mother were recorded. A second milk sample was collected where possible. In the second half of the cohort, nutritional habits were recorded on a questionnaire filled in by a project assistant when the mother came for the neurological examination of the infant. Birth weight of the infant was recorded by the midwives. Weight at the neurological examination was measured by the examining physician on electronic baby scales, corrected to the nearest 10 grams. The infant‘s length was measured on a length board to the nearest 5 mm, and its head circumference was measured using a standard tape, corrected to the nearest mm. The Ethical Committee of the Faroe Islands approved the study protocol. Written informed consent was obtained from each mother. 6.2.2.2 Dietary questionnaire The dietary questions included those previously used about the number of whale meat dinners and dinners with blubber per month during pregnancy, and before pregnancy, but we also recorded the estimated portion weight per meal, and number of other occasions where dried blubber or whale meat was eaten. The number of fish dinners per week, and the number of fulmar (Fulmarus glacialis) and other sea birds consumed per month, as well as the consumption of other meat (chicken and livestock) were recorded. To determine the awareness of possible hazards associated with whale meat, blubber and seabirds, the mother was asked whether the consumption of the respective food items remained the same during pregnancy, was reduced / increased somewhat or much. For whale meat and blubber, the estimated intake during the whole pregnancy was computed by multiplying the number of meals per month by 9 and then by the average weight of the portions consumed. 6.2.2.3.1 MeHg in maternal hair For mercury analysis, a hair sample of at least 100 mg (total thickness equivalent to a match stick; total length at least 6 cm) was cut with a pair of scissors close to the root from the occipital area; the hair was tied with a cotton string and saved in a small, marked envelope. Taking in account the delay before mercury appears beyond the hair root and the growth rate of scalp hair, a hair sample of this length will mainly represent the exposure during the first and second trimesters of pregnancy (Grandjean et al.,1999). Mercury analysis took place at the Trace Element Laboratory, Odense University, using a Perkin-Elmer atomic absorption spectrometer 5100 with a fluid injection system. A volume of 250 µl of digested sample is then transferred to another Minisorp tube, and 2 ml of saturated KMnO4 (Merck) in 3% H2SO4 (Merck) is added. The tubes are sealed with perforated parafilm (American Can Company, Greenwich, CT) and agitated before incubation in a 75° C warm water bath for 30 min. After cooling, excess potassium permanganate is reduced by careful addition of 250 µl saturated hydroxylamine hydrochloride (Merck). The solution is agitated carefully until clear. Each digested sample is prepared and analyzed in duplicate. Mercury results in µg may be converted to nmol by multiplying by 5.0. 6.2.2.3.2 Organochlorines, pesticides, and musk xylene in breast milk 6.2.2.3.2.1 Collection, storage, and transport of samples While the mother was still at the hospital, a sample of transitional milk was collected directly into acid-rinsed 250 ml polyethylene bottles (Kartell, Einasco, Milano, Italy) and then frozen at -80° C. 6.2.2.3.2.2 Laboratory procedure for organochlorines Milk analysis was performed in the Institute of Environmental Toxicology, Flintbek/Kiel, Germany (Dr. Heinzow) for hexachlorobenzene (HCB), ß-hexachlorocyclohexane (ß-HCH), dichlorodiphenyltrichloroetane (4,4’-DDT), dichlorodiphenyldichloroethene (4,4’-DDE), trans-nonachlor, musk xylene, and polychlorinated biphenyl congeners (IUPAC number 105, 118, 138, 153, 156, and 180). The sum of the levels of PCB-138, 153, and 180 makes up about 50% of the total PCB congener mixture consumed by Faroese people. Thus SPCB was calculated as twice the sum of the congeners 138, 153, and 180. Samples were analyzed by gas chromotography as perviously described (Brock et al,. 1996). Aldrine and Mirex were used as internal standards and added to 4 ml of a thoroughly mixed aliquot of the milk sample. Following solid-liquid-phase extraction with Florisil (Merck) and iso-hexane and elution with iso-hexane / dichloromethane (80 / 20, v / v), the eluate was evaporated with a vacuum-rotation evaporator just to dryness. The residues were reconstituted in a final volume of 2 ml iso-hexane and transferred to an autosampler vial. Analyses were performed by high-resolution gas chromatography on a Varian 3400 gaschromatograph equipped with an autosampler, a 30m DB-5 capillary column and an electron capture detector. The specific congeners were identified and quantified by comparison with response and retention time of calibration standards for each analyte of interest. At a fat content of 3% the detection limits were 0.003 µg/g lipid for DDT, 0.006 µg/g lipid for musk xylene, and 0.005 µg/g lipid for the different PCB-congeners and the other substances. For each 8 analyte-runs, one blind sample and one pool-sample were included for internal quality control. The lipid content of the samples was determined by means of the photometric Merckotest 3221 (Merck) for total lipids. Values below the detection limit were substituted by 0.0015 µg/g lipid. 6.2.2.4 Neurological Optimality Score (NOS) At an age of approximately two weeks (adjusted for a gestational age of 40 complete weeks) the infants underwent a neurological examination. The Groningen Neonatal Neurological Examination systematically records major indicators of neurological function, such as posture, motility, general, muscle tone, responses, tendon reflexes, other reactions, reactivity, and stability of behavioral status during the examination. The technique for the examination of the children is a comprehensive age-specific examination as described by Prechtl (Prechtl, 1977). It has proven to be predictive of later major and minor neurological dysfunction. The neurological findings were summarized into a clinical diagnosis (normal, suspect and abnormal). A neurological optimality score (NOS) is generated, defined as the number of optimal items from a list of 60 items which were considered to be representative of the neurological condition (Touwen et al., 1980). Furthermore, two subscores were calculated according to the literature (Huisman et al., 1995), one for muscle tone (postural tone cluster score with a maximum number of 17 points) and one for reflexes (reflex cluster score, maximum: 22 points). 6.2.2.5 Confounders / covariates Many factors are known to have an impact on growth and neurological development. Their effects have to be taken into account when analyzing the changes of anthropometric data, gestational age, neurological outcome, and others that are suspected to be caused by contaminants in food. In the preliminary analyses (bivariate correlation) several different groups of confounders and covariates could be identified (see also table 6.2.1):
Table 6.2.1 Possible confounders for NOS, for the whole cohort and for subcohort
Explanations:
6.2.2.5.1 Examiner There were three different examiners involved in the examination: US functioned as supervisor in the beginning of the study and therefore examined only a few children. Two experienced paediatricians A and B performed the examinations. The scoring of the neurological examination is known from the experience of other study groups to vary somewhat between examiners as individual judgment must be exerted, when performance of the infant is borderline. Therefore the dependence of the result of the neurological examination in form of the NOS of the two main examiners was tested. The children seen by examiner A reached a significantly higher score than the rest of the group (see 6.2.3.2.1). When ever necessary and applicable, the data analysis was done for the combined group as well as for the two subcohorts A and B. 6.2.2.5.2 Obstetric Optimality Score (OOS) Obstetric data were evaluated according to the obstetric optimality list, as described by Touwen (Touwen et al., 1980).The list used in this study consisted of 73 items that measure socioeconomic status and pre-, intra-, and immediate post-partum conditions (for a complete list and criteria for optimality see Table 6.2.21 in the appendix). The items were completed using information recorded in the hospital records as well as that given verbally by the mother. For several items (such as marital status at time of delivery, participation in parenthood course, education of mother’s father) no information was available. By counting the number of items that fulfilled the preset criteria for optimality (Prechtl, 1980), the Obstetric Optimality Score (OOS) was calculated. 6.2.2.5.3 Alcohol during pregnancy Two separate analyses were done to examine the influence of maternal alcohol consumption on the growth and the neurological outcome of the infant. Two different scoring lists were used: dichotomized as “no alcohol at all” versus “any amount of alcohol during pregnancy” and an ordinal variable. The possible answers were:
Where necessary (e.g. for linear regression model) the information about alcohol was dichotomized into “no alcohol during pregnancy” and “yes, alcohol during pregnancy”. 6.2.2.5.4 Smoking of mother and / or partner For the registration of smoking habits of mother or mother‘s partner during pregnancy five categories were used:
As for “alcohol during pregnancy”, the information about smoking was also dichotomized into “no smoking during pregnancy” and “yes, smoking during pregnancy”. 6.2.2.5.5 Education / profession / occupation of parents Education of parents was categorized into:
Scoring of profession / occupation of parents which was done by the Faroese staff using these classes:
To calculate certain correlations, the higher of the two scores of the education of mother and father were chosen. To obtain a dichotomized variable, education was divided into the following two groups:
For profession and / or occupation, a dichotomized variable was used with the following subdivision:
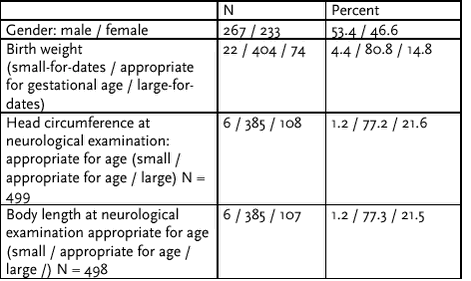
6.2.2.6 Statistical methods All statistical analyses were performed using the Statistical Package for the Social Sciences, version 10.0 (SPSS for Windows 10.0). Quantitative data are described by their arithmetic means, and the standard deviation. In some cases the 10th, the 90th percentile and the range are also included. For variables with skewed distribution such as contrations of exposure data, maternal body mass index (BMI), and most dietary variables, geometrical means with spread factor (geometric standard deviation) were computed to normalize the distribution and to obtain a better statistical fit. For these data log 10-transformed values were used in parametric tests. Percentage values are used to describe the distribution of qualitative variables. Mean differences in group comparisons were calculated by using the T-test for independent samples. For proportions chi-square analysis was used to determine differences between groups. Bivariate correlations between variables were tested by calculating the Pearson correlation coefficient in normally distributed data, and Spearman‘s rho for rank orders. The statistical significance of correlations was determined by computing the p-values for the coefficients. For the correlation of several variables it became necessary to calculate partial correlation coefficients while controlling for major covariates (e.g. sex in the correlation between exposure data and NOS). For the sake of uniformity, only two-tailed significance levels were used. Linear regression analyses were carried out for the main outcome variables birth weight and NOS. Items were chosen as covariates and tested if they were known as confounders from other studies or if it appeared plausible that they might function as confounders. 6.2.3 Results6.2.3.1 Description of subjects During the period of cohort formation a total of 1,152 children were born alive in the National Hospital in Tórshavn. These included one set of triplets and 16 pairs of twins, thus leaving 1,117 singletons, (7 pairs of twin were examined but not included in the cohort). In 1,019 births, the mother lived in the primary catchment area of the National Hospital (i.e. not the northern or southern islands). This area was the proposed catchment area for the project. A total of 608 of the infants were examined, giving an overall participation rate of 59.7%. This rate represents an underestimate, as inclusion required, e.g. cord blood, thereby eliminating Caesarean section and births where complications prevented the midwife from taking a blood sample. Due to prematurity, the data of 10 children were not used for analysis (4 children of 35 weeks of gestation, 6 children of 36 weeks of gestation), and 7 children were excluded because they were older than 5 weeks of corrected age at examination – an age when the used technique for the neurological examination no longer is valid. Eight infants were examined when only two days old (chronological age) when birth stress factors still influence heavily the result of the neurological examination. Therefore their data were not used for the analyses. The exclusions (for reasons other than incompleteness of exposure data) amounted to 25/608 or 4.1%. In addition, hair for mercury analysis and / or milk for analysis of organochlorines, pesticides, and musk xylene were in several cases not obtained in sufficient amount to allow chemical analysis. Thus the data of 500 mother-infant pairs remained for this preliminary report. 6.2.3.1.1 Infants: anthropometric data and other characteristics of the children in the study. The most important information about the infants in the study cohort is displayed in the following two tables (table 6.2.2 and table 6.2.3). Table 6.2.2 Description of infants
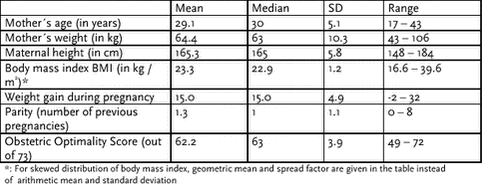
It is known that Faroese children are very large at birth (Olsen et al., 1985), but no specific growth charts for Faroese children are available. Therefore German (for birth weight) and British (for length and head circumference) charts were used as reference anthropometric data for the Faroese infants. The fact that only term-infants were included in the cohort explains why in the study cohort only 4.4% small-for-gestational-age children (by definition those who constituted the 10 lightest percent of a birth cohort), but 14.8% of large-for-date infants (instead of 10%) were found. The percentage of children with a head circumference or length above the 90th percentile was even higher. Some more significant differences were identified between boys and girls in the study cohort: Body temperature at the neurological examination was higher in boys than in girls (p-value: 0.014); the same was true for maternal age (p-value: 0.046) and parity (p-value: 0.024). The OOS was also slightly higher in girls (p-value: 0.062). The time between rupture of membranes and delivery was longer in boys (0.047). These observations may represent spurious findings, but possible links to endocrine disruption cannot be ruled out. Clinical examination of the 267 boys revealed one boy with a unilateral undescended testis, for two boys the information about the testicles was missing. As an ultrasound examination was not carried out, the true number of cases may have been underestimated. Two children had a mild hypospadia. The concentration of all PCB-congeners, DDE, and DDT were in the lower range of the general distribution. For the small number of cases no statistical analyses were done. Estimation of gestational age was based on the mother‘s report of her last menstrual period. If the date of the last menstrual period had been unclear, then the expected date of delivery calculated by ultrasound examination of the foetus at approximately week 22 of pregnancy was used. The duration of a complete pregnancy was taken to be 280 days or 40 weeks. Prolongation or shortening of the period was expressed in days as well as in completed weeks of gestation. 6.2.3.1.2 Background data about the mothers and their partners Of major interest is all information about the possible covariates of neurological outcome of the child and its growth that are associated with the family background data: maternal age, maternal smoking during pregnancy, maternal alcohol consumption during pregnancy, maternal medical history, and socioeconomic status. The distribution of maternal pre-pregnancy body mass index [weight in kg / (length in m)²] was skewed. Therefore BMI was log 10-transformed before using it in parametric analyses. For a summary of characteristics of the parents, see table 6.2.4 and table 6.2.5. Table 6.2.4 Characteristics of the parents, part I (metric data)
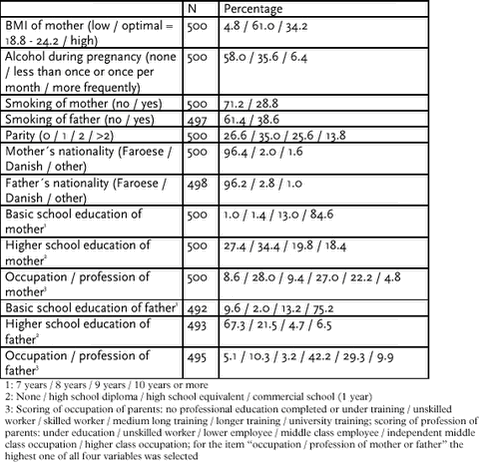
Table 6.2.5: Characteristics of the parents, part II (ordinal data)
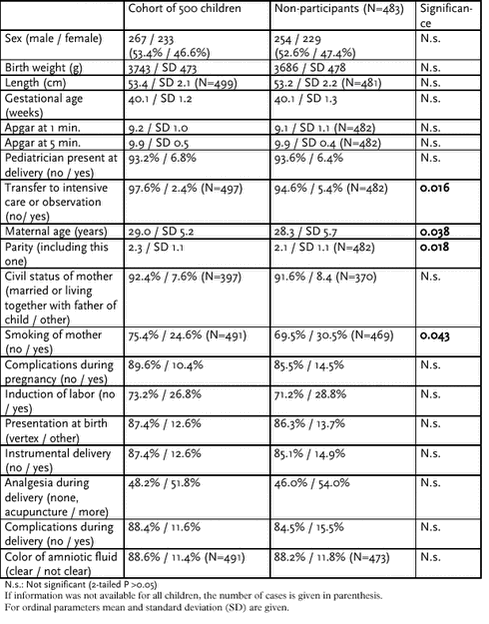
6.2.3.1.3 Possible selection bias in study cohort: Comparison of participating and non-participating mother-infant pairs In the study period (1.1.1998 – 29.2.2000), 1,152 children were born alive in the National hospital. Infants who were born at the hospitals in Klaksvík or Tvøroyri and those, who were born in Tórshavn, but were living with their mothers on the northern islands (Borðoy, Viðoy, Kunoy, Karlsoy, Fugloy, and Svínoy) or on the southern island (Suðuroy) were not included in the cohort. However, one child from Klaksvík and one child from Sandvík (Suðuroy) were found to be misclassified. After exclusion of premature infants of less than 37 weeks of gestation, 1,074 singletons remained. To rule out selection bias for the children in the cohort, those infants of the eligible 1,074, who did not participate, were compared with those of the cohort examined (table 6.2.6). Information was obtained from the birth records that are used for official statistics. Children born by caesarian section or vacuum extraction (instrumental delivery) are underrepresented in the cohort due to the practical difficulties of collecting blood and hair samples under such circumstances. As major differences between participants and non-participating mother-infant pair, maternal age and parity (younger mothers and those with less children) participated less often. The ratio of infants who had to be transferred to the neonatal intensive care unit was higher in the study group. The number of non-smoking mother is slightly higher in the study group. Although statistically significant, the differences were small and possibly of limited importance for the study. Table 6.2.6 Comparison of participants and non-participants
If information was not available for all children, the number of cases is given in parenthesis. For ordinal parameters mean and standard deviation (SD) are given. According to the study protocol, only mothers, who reside in the Streymoy, Eysturoy, Vágar, and Sandoy, were invited to participate. Therefore only very few participants came from the other islands: one child from the southern islands (Suðuroy), one from the northern islands. These two children were subsequently excluded. Children from Eysturoy are over-represented in the study cohort, while those from Vágar participated significantly less then expected, possibly due to longer travel distances. Table 6.2.7 Mother‘s residence
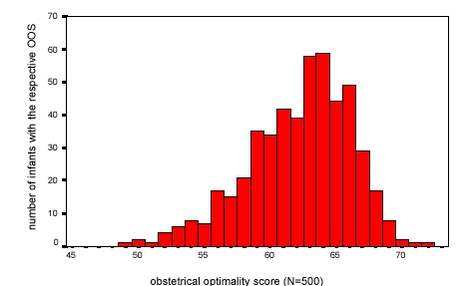
6.2.3.2 Covariates / confounders 6.2.3.2.1 Examiner Three examiners were involved in the study: A, B and C. Only few examinations were done by C (5/500), A saw 262 and B 233 of the children. In order to correct for inter-observer differences, the examiner was included as an explanatory variable. The two subcohorts that were examined by pediatrician A and pediatrician B are analyzed here to look for substantial differences between the groups. All examiners were unaware of the exposure to harmful contaminant. No significant objective differences could be identified between the two subcohorts. Comparison of the exposure data of the two subcohorts revealed no significant differences. However, some fifferences in NOS scores were seen (see section 6.2.3.7.1). 6.2.3.2.2 OOS (Obstetricl optimality score) The mean of the OOS was 62.2 (out of 73) with a standard deviation of 3.9, the results for the OOS ranged from 49 to 72 points. The quartiles (P25, P50, and P75) were calculated to 60, 63, and 65 points. Figure 6.2.1: Distribution of OOS
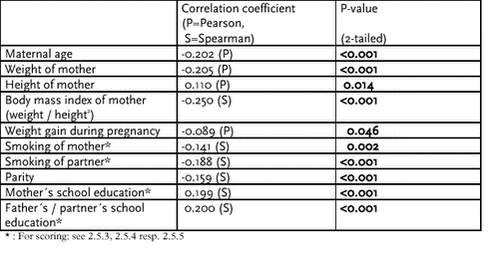
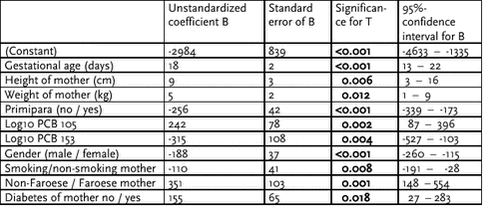
A higher OOS was achieved with prolongation of gestation (p-value for Pearson correlation: 0.036). Boys showed a tendency to lower OOS compared with girls (means in boys: 61.9, girls: 62.6; 2-tailed significance 0.062). Birth weight did not influence the OOS in this cohort. Lower OOS (more risks and less favorable conditions during pregnancy and delivery) are connected with increasing maternal age, increasing parity, increasing weight of gravida, higher BMI, higher weight gain during pregnancy, and if mother and / or partner are smokers. Higher school education of father and / or mother (but not with profession or occupation of parents) and greater height of mother lead to a higher OOS. The magnitude of correlations reaching significance level between parental characteristics and OOS are shown in table 6.2.8. Table 6.2.8 Significant correlations between parents‘ characteristics and OOS
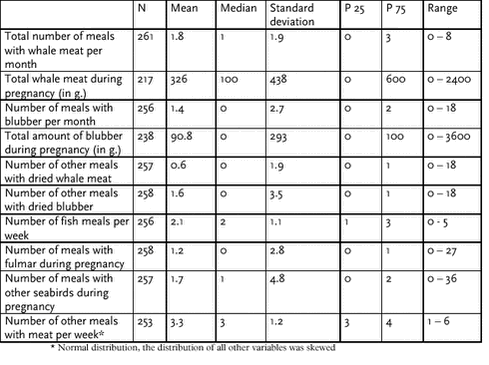
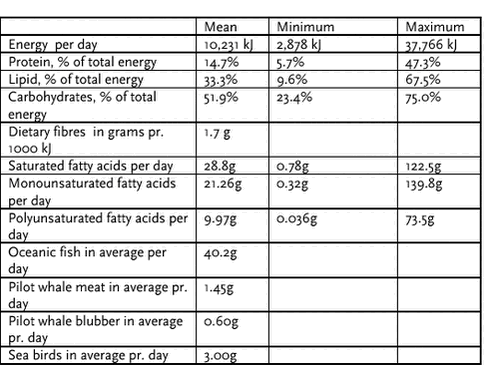
6.2.3.2.3 Alcohol during pregnancy The older the mother, the higher is the consumption of alcohol during pregnancy (p=0.005). With increasing height of mother, alcohol is also consumed more often. Astonishingly, a significant positive correlation was found between alcohol and gestational age (Spearman‘s rho 0.109, p=0.015), i.e. more alcohol leads to higher gestational age! Mean of length of gestation for teetotalers was 282 days, for children of mothers, who consumed alcohol, 284 days (level of significance for t-value: 0.011). However, consumption of alcohol during pregnancy is correlated with a higher score for mother‘s school education, occupation and profession (p<0.001 for all of them). The same is true for the father‘s education (p<0.001) and less so for profession (p=0.020). Parents who are not Faroese drink more alcohol (significance of result of T-test is <0.001). The amount of alcohol consumption is positively correlated with more legal abortions (p=0.001) and more late spontaneous abortions, i.e. during 16-28th gestational week (p<0.001). Note must be taken that the alcohol consumption levels in this population are quite low. On the other hand, the NOS of infants of mothers who consumed alcohol during pregnancy is lower, but not significantly different to that of children of teetotaler mothers (p-value for Spearman‘s rho: 0.093). When analyzing some of the specific items of the NOS, it was shown that tremor intensity and tremor amplitude increased with higher consumption of alcohol (p<0.05). Although possibly of limited importance due to the limited alcohol intake, these tendencies have to be kept in mind in further analyses of the data. 6.2.3.2.4 Smoking of mother and / or partner A clear negative correlation was seen between birth weight (p=0.003), body length at NOS (p=0.019), and OOS (p=0.002) with smoking of mother. As could be expected, intrauterine growth retardation in one of the previous pregnancies (Fischer‘s exact test: 0.008) or in the present one (Chi-square: 0.005) was highly significantly correlated to maternal smoking. A higher Apgar score at one (p=0.007) and five minutes (p=0.045) is found in children of smoking mothers, the same is true if the father is a smoker but with an even higher significance (Apgar one minute: p=0.002, Apgar five minutes: p=0.029). Maternal smoking is correlated with more overshooting movements (significance of F<0.001) during the neurological examination. Passive smoking of mother (i.e. partner‘s smoking) is significantly correlated to muscular hypertonia of the infant (significance of F: 0.023) and with the diagnosis of “opisthotonus” in the infant (0.012). The conclusion of the neurological examination was more frequently described as “suspect” if both parents were smokers (Fischer‘s exact test: 0.027). The NOS itself was not significantly correlated to the smoking-status of the parents. Given the known effects of maternal smoking, the prevalence of smoking in these mothers, and the types of associations identified, smoking appears to be an important covariate. 6.2.3.2.5 Education, profession, and occupation of parents 6.2.3.2.5.1 Description For distribution of parental education, profession and occupation: see section 6.2.3.2. 6.2.3.2.5.2 Effects of education, profession, and occupation of parents A higher score for the profession or occupation of one of the parents led to a higher birth weight and a higher percentile of birth weight as well as higher percentiles of length and head circumference at NOS. Duration of gestation and Apgar-score are unaffected by educational and / occupational status of parents. Reduced smoking of the pregnant mother and father are significantly correlated with a higher school education (p=0.002 / p<0.001), higher occupation (p=0.017 / p=0.021) and profession (p<0.001 / p=0.004). These anticipated associations support the need to consider all of these covariates together. 6.2.3.2.6 Nationality of parents Faroese mothers are younger (significance of T-test 0.017) and have a lower pre-pregnancy body weight (0.042). The birth weight of infants of Faroese mothers as compared with infants of non-Faroese mothers is significantly higher (difference of the mean more than 230g, significance of T-test 0.002). The same is true for the percentiles of head circumference and body length at neurological examination (significance of F: 0.007 resp. 0.008 This may be partially explained by the fact that Faroese mothers smoke less then non Faroese mothers (p=0.032). On the other hand their partners are more frequently smokers if their nationality is not Faroese (p=0.022). Faroese mothers are more often teetotaler than mothers of other nationality (<0.001). The Apgar-score of their children after one minute is significantly higher (0.020). 6.2.3.3 Dietary questionnaire In this paragraph, the result of the analyses of the 262 dietary questionnaires are presented. Only a few of the questionnaires were filled in by the mothers themselves; most were filled in by a project assistant, who questioned the mothers, thus helping to ensure uniformity of scoring. A summary of the results is given in table 6.2.9 and table 6.2.10. Table 6.2.9 Dietary habits of mothers during pregnancy, part I
For those who ate whale meal during pregnancy (N=120), the geometric mean of the total amount was 427g, with a spread factor of 2.4g. For those who ate blubber (N=83), the geometric mean of the total amount of blubber, consumed during pregnancy, was 151 (spread factor 2.5). For the other data with a skewed distribution, the geometric mean of those, who ate the food item, was:
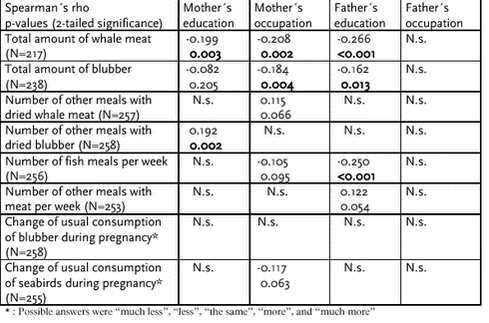
6.2.3.3.1 Dietary habits and parental characteristics Here, the correlation between parental characteristics and diet was examined as an important way to identify possible predictors of dietary habits. No significant correlation was found between mother‘s age, height, weight, or BMI with dietary habits during pregnancy. Women who ate more whale meat meals during pregnancy reported abortion in late pregnancy (16-28 weeks) more often (significance of t-value of independent samples test: 0.012). The lower the parents’ education, the more whale meat and blubber were consumed. Father’s education is further correlated to the number of fish meals: the higher the level of education, the less fish meals were eaten by the mother during pregnancy. In interpreting this information, it must be kept in mind that the Faroese authorities have issued advisories regarding whale consumption, and that the impact of such recommendations may be related to the subjects educational level. The more alcohol the mother consumed during pregnancy, the more meals with dried whale meat she ate (significance of Spearman‘s rho: 0.019). Maternal smoking during pregnancy (dichotomized into “yes” or “no”) is strongly correlated with eating blubber or whale meat on two consecutive days (2-sided significance for Fischer‘s exact test; 0.009 and 0.024, respectively) and a similar tendency was seen for the smoking of the partner. Father‘s nationality (Faroese or not) and mother‘s fish consumption are significantly correlated with each other: if the father was Faroese, 2.1 fishmeals per week were reported compared to1.9 for a non- Faroese father (2-tailed significance for independent-samples T-test: 0.010), but no significant correlation was seen with mother‘s nationality. Again, these associations in general are quite in accordance with expectations and confirm the importance of considering these factors as covariates. Table 6.2.10 Correlation between mother‘s dietary habits during pregnancy of and parent‘s education / profession / occupation
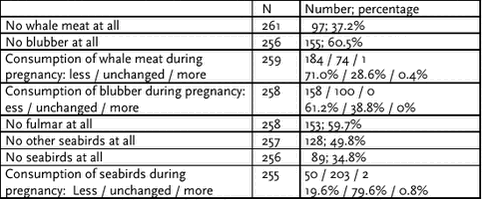
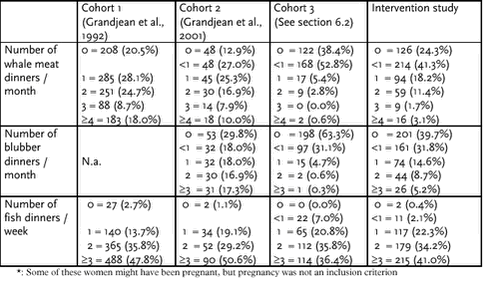
6.2.3.3.2 Diet and present recommendations “Women who intend to get pregnant during the next three months, women who are pregnant or those who are breastfeeding should not eat any whale meat at all. Livers and kidneys of whale should be eaten at all.” The health authorities of the Faroes issued this advisory in 1998 (Heilsufrøðiliga Starvsstovan, 1998). The results of the questionnaires, all of which were completed after 1 January 1999, revealed that many mothers had either been unaware of the recommendations or had ignored them. More than 60% of women ate whale meat, and about 30% consumed blubber during pregnancy. No difference could be seen between the number of mothers who refrained from whale meat or blubber meals in the first months of 1999 and in the last three months of the study (i.e. December 1999 and February 2000). How many mothers reduced their consumption of whale during pregnancy? 71% of the mothers stated that they reduced the consumption of whale meat during pregnancy; 61% ate less blubber. Only very few of them increased the amount of whale meat, and no one ate more blubber during pregnancy than before. About 65% of the mothers who filled the questionnaire had eaten at least one meal containing seabirds; 20% had eaten fulmar for dinner on more than one occasion; 28% had eaten other species at least twice during pregnancy. These results suggest that the advisory has had a substantial effect, though it was by no means fully successful. Table 6.2.11 Dietary habits of mothers during pregnancy, part II
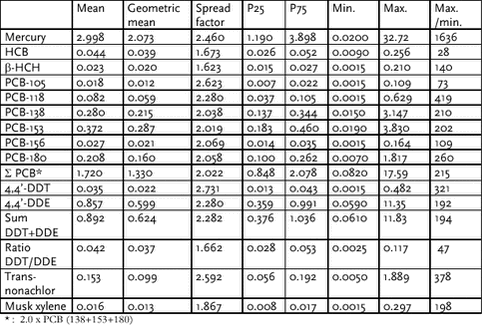
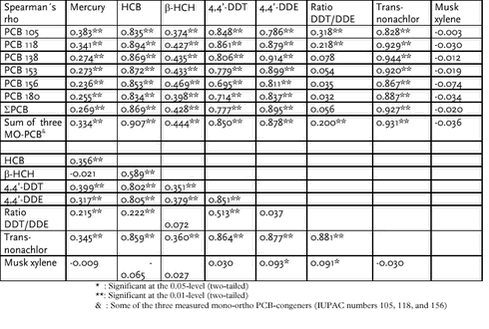
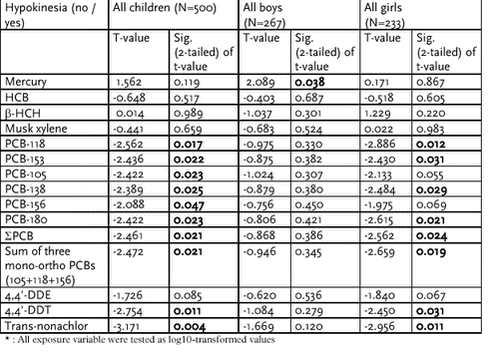
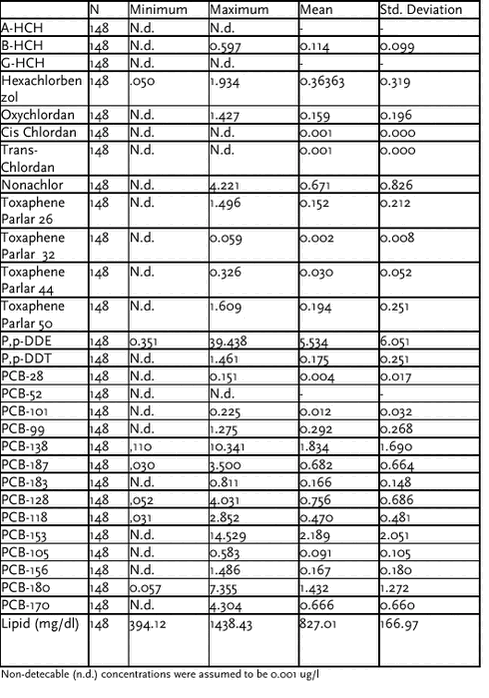
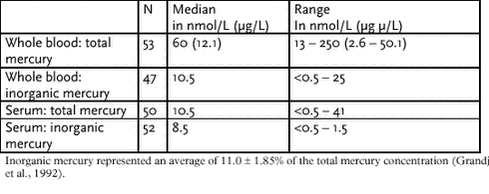
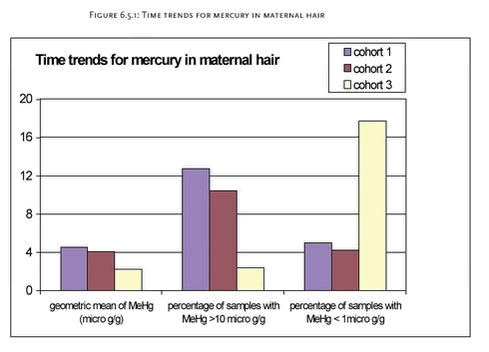
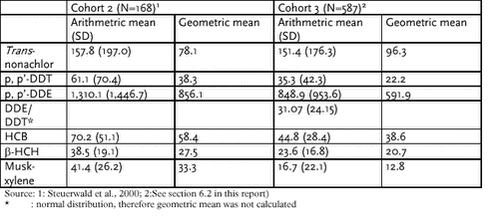
6.2.3.4 Exposure Variables For their skewed distribution, the geometric mean and spread factor were calculated to characterize the concentration of exposure variables in maternal hair and breast milk. Very wide ranges of exposure data were found. The ratio of the highest to the lowest concentration of the substances are given in the column “max. / min.” in table 6.2.12. Table 6.2.12 Mercury (µg/g in maternal hair) and POPs (µg/g lipid in breast milk)
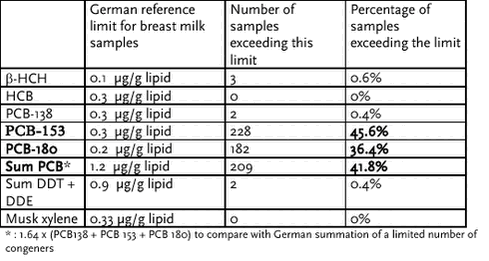
The mean concentration of mercury in maternal hair was calculated to nearly 3 µg/g of hair, the geometric mean for the skewed distribution reaching only 2 µg/g. Ten hair samples (5%) exceeded the value of 10 µg/g MeHg, a limit previously thought to protect against clinical adverse effects. In 74 (14.8%) samples more than 5 µg/g was found. The range of the distribution was wide: the lowest samples containing not more than 0.02 µg/g, the one with the highest load nearly reaching 33 µg/g. Thus the ratio between the highest and the lowest concentration calculates to more than 1,600 (see table 6.2.12). 6.2.3.4.2 PCB / POPs The few samples containing non-detectable levels of one of the POPs were given the concentration of 0.0015 µg/g for purposes of statistical analyses. This level corresponds to a concentration below the detection limit. For HCH, one sample was below detection limit; for PCB-105, 36 samples; for PCB-118, one; for PCB-156, seven; 4,4‘-DDT, 16, and musk xylene, one. The mean for the SPCB (twice the sum of PCB’s 138, 153, and 180) was 1.7 µg/g lipid, and the geometric mean 1.3 µg/g lipid; 93 milk samples (18.6%) had a SPCB >2.5 µg/g. There were 10 samples being above a 6 µg/g limit To get an impression of the extent of contamination of the breast milk of the Faroese mothers with persistent organic pollutants, the concentrations of the present cohort were compared to the reference values given by the German Federal Agency for the Environment (Institut für Wasser-, Boden und Lufhygiene, 1999) These values represent the 95th percentile of the concentrations found in unselected breast milk sample in 1994 (N=1757). The limits for the two di-ortho congeners IUPAC number 180 and 153 were exceeded by more than one-third and nearly half of the Faroese samples, respectively (table 6.2.13). Table 6.2.13 Concentrations of POPs in breast milk and German reference values
As for mercury, the range for each substance was very wide. The ratio between the highest and the lowest concentrations varied between 28 for HCB and 420 for PCB-118 (table 6.2.12). The ratio of DDT to DDE was calculated in order to obtain some information about the origin of dioxins: If the share of DDT is higher, it would suggest a recent exposure to DDT trough food contaminated by current use of DDT in nearby regions. If DDE dominates, this will indicate that DDT has accumulated in the food chain over a longer period, possibly from far-away sources (AMAP, 1997). For the mothers of the study group only very low values for the DDT/DDE-ratio were found, thus indicating no direct contact to DDT. With the ban of DDT in the region in effect, this was to be expected. Still, the continued presence of DDT many years after the ban in the EU suggests that current or recent use of DTT elsewhere adds to the marine contaminantion. 6.2.3.4.3 Correlations between exposure data The six different PCB congeners measured in breast milk were all significantly correlated to each other (Spearman‘s rho correlation coefficient >0.8 for most substances), therefore suggesting a common source for the contamination. HCB, DDT, DDE, and trans-nonachlor also correlated very well with all PCB congeners: SPCB and HCB: r=0.85; SPCB and DDT: r=0.85; SPCB and DDE: r=0.88; SPCB and trans-nonachlor: r=0.93. However, methyl mercury and PCB congeners were related to each other to a much smaller degree (SPCB and MeHg: r=0.39). Also the correlation between the PCB-congeners and b-HCH was only weak (SPCB and b-HCH: r=0.28). Musk xylene is correlated with DDE (p=0.042) and the sum of DDT + DDE (p=0.048). The higher the DDT/DDE-ratio the lower the concentration of musk xylene that was found in breast milk (p=0.017). The DDT/DDE – ratio is higher in the milk of mothers with higher hair mercury, higher HCB, trans-nonachlor, PCB-105, PCB-118 (p<0.01 for all of them), and musk xylene (p=0.013). Because the lipophilic contaminants originate form blubber and mercury from meat, the association demonstrate that mothers eating blubber are also likely to eat whale meat. However, in this regard the relatively short biological half-life of methyl mercury in the body (as compared to PCB and DDE) should be kept in mind. The complete set of correlations can be found in table 6.2.22 in the appendix. 6.2.3.4.4 Parental characteristics and exposure values Increased maternal age is significantly correlated with higher levels of b-HCH, HCB, all PCB-congeners, DDT, DDE, and trans-nonachlor (p-value <0.001). The association is likely due to accumulation of these persistent compounds with age. Higher parity also leads to an increase in mercury, HCB, all measured PCB-congeners, DDT, DDE, and trans-nonachlor (p-value for 2-tailed significance of Spearman‘s rho for the correlation: <0.001 for each of them). However, when controlling for maternal age, the picture changes: while mercury still increased significantly (p-value <0.001), b-HCH decreased with parity (p-value <0.001). For most other substances weak negative correlations were found. A significant positive correlation was found for pre-pregnancy BMI with ß-HCH, HCB (p-value 0.005 for Spearman‘s rho), musk xylene, PCB-105, sum of the three measured mono-ortho PCB-congeners (PCB-105, PCB-118, and PCB-156), DDT, and DDE, and for maternal weight with HCB, b-HCH, PCB-105, PCB-118, DDT , DDE, and musk xylene. But the data analysis did not reveal a significant correlation with maternal height. A negative correlation appeared for weight gain during pregnancy with mercury, ß-HCH, HCB, PCB-105, PCB-118, PCB-138, PCB-153, PCB-156, DDT, DDE , and trans-nonachlor. Mercury in hair (p=0.012) and b-HCH (p=0.003) in breast milk were positively correlated with the mother‘s consumption of alcohol during pregnancy. The geometric mean of all other measured contaminants was higher in mothers who confirmed any consumption of alcohol during pregnancy. The ratio of DDT/DDE in these mothers was significantly higher than the one in teetotalers (P=0.020). Smoking was associated with lower concentrations of musk xylene, PCB-105 (p=0.070), and DDT while the concentration of the other pollutants increased with the number of cigarettes smoked by the mother. The mothers were interviewed about complaints about previous fertility problems. Those who reported problems with getting pregnant had significantly higher PCB-118 (p=0.049), PCB-138 (p=0.016), PCB-153 (p=0.026), PCB-156 (p=0.030), PCB-180 (p=0.034), DDE (p=0.040), and trans-nonachlor (p=0.050) than those who became pregnant without problems or delay. Mercury was lower (p=0.003) in mothers who had troubles with infertility. The data showed a tendency to a higher rate of spontaneous early abortions with higher concentrations of mercury (p=0.050), HCB (p=0.083), PCB-118 (p=0.021), PCB-105 (p=0.015), DDE (p=0.018), and DDT (p=0.024). Cases of late abortion, i.e. during 16th to 28th week of gestation, more frequently occurred at higher mercury concentrations (p=0.034). The same tendency was seen for b-HCH and HCB (p=0.092 and 0.097, respectively): higher contamination levels thus seem to increase the risk for abortions. On the other hand, age and parity may be important covariates that need to be concidered. Because previous infertility and the number of abortions is strongly correlated with maternal age, the connection between both variables and the exposure data was analyzed once more after controlling for maternal age. The significant correlations remained unchanged. Solely the significance of MeHg as protection against infertility vanished. Further exploration of these issues seems indicated. For the relation between contaminants and complications during parturitions significant correlations were found for: HCB (p=0.027), b-HCH (P=0.005), PCB-105 (p=0.033), PCB-118 (p=0.037), PCB-138 (p=0.035), PCB-156 (p=0.026), and DDE (p=0.036). For the cases where complications during child birth were recorded, the concentrations of pollutants uniformly was higher than for those with an uncomplicated birth. Significant correlations (p-values for 2-tailed significance of Spearman‘s rho are given in parentheses if they were £0.05 and ³0.001, all other p-values were <0.001) were found between mother‘s education, profession, and present occupation with the exposure parameters. Higher maternal education lead to lower mercury (0.047), higher b-HCH (0.001), PCB-105 (0.006), PCB-118 (0.007), PCB-138 (0.011), PCB-153 (0.005), PCB-156 (0.001), PCB-180 (0.001), DDT, DDE (0.007), trans-nonachlor (0.027), and musk xylene (0.034) is found with higher maternal profession; higher maternal occupation is significantly correlated with higher HCB (0.005), b-HCH, PCB-105 (0.012), PCB-118 (0.018), PCB-138 (0.009), PCB-153 (0.003), PCB-156, PCB-180, DDT (0.008), DDE (0.039), and trans-nonachlor (0.022). If the same analyses were done for the father / the partner of the mother, the results were: higher school education of father is correlated with a lower MeHg in mother‘s hair (0.016), with a lower HCB (0.020), PCB-105 (0.002), PCB-118 (0.003), PCB-138 (0.002), PCB-153 (0.005), PCB-156 (0.045), PCB-180 (0.026), DDE (0.008), and trans-nonachlor in mother‘s milk; higher values of HCB (0.012), b-HCH (0.020), PCB-105 (0.023), PCB-118 (0.008), PCB-138 (0.015), PCB-153 (0.006), PCB-156 (0.010), PCB-180 (0.004), DDT, DDE (0.003), and trans-nonachlor (0.025) correlate significantly with a higher score for father‘s profession, while for father‘s occupation significant correlation could be found solely for b-HCH (0.011), PCB-118 (0.047), and DDT (0.003). Overall, these associations perhaps reflect a lower educational level in subjects involved in whaling, perhaps also in the degree that governmental advisories are taken into regard. Further studies are needed to clarify these aspects and their associations with age. When exposure data were inspected with respect to mother’s nationality, contaminants were higher in the samples of Faroese women. Only b-HCH tended to be slightly lower in Faroese women (p=0.129). The differences in exposure were highly significant for all measured PCB-congeners, trans-nonachlor, and DDE (2-tailed significance of results of T-test for independent samples test: <0.001). These differences were not explained by confounding by maternal age, weight, BMI and / or parity. The impact of the father’s nationality was much weaker and not significante. Table 6.2.14 Summary of correlations between contaminants and parental characteristics
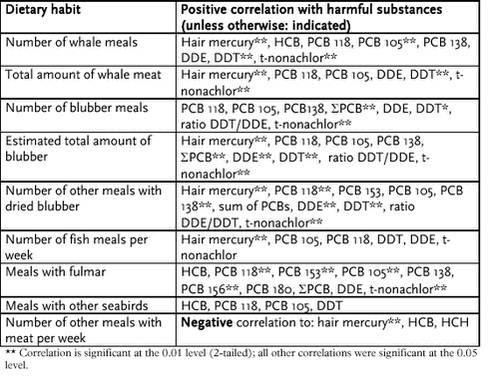
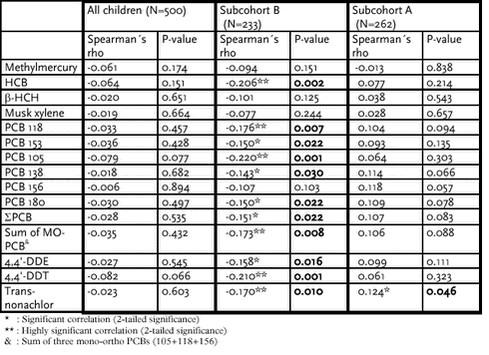
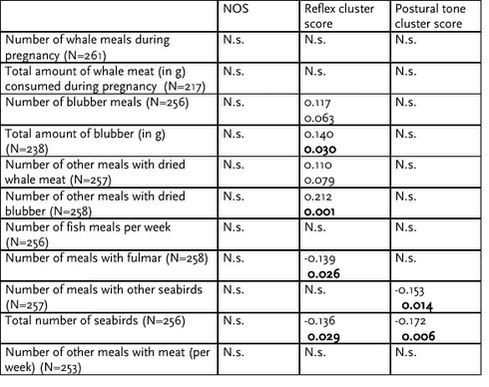
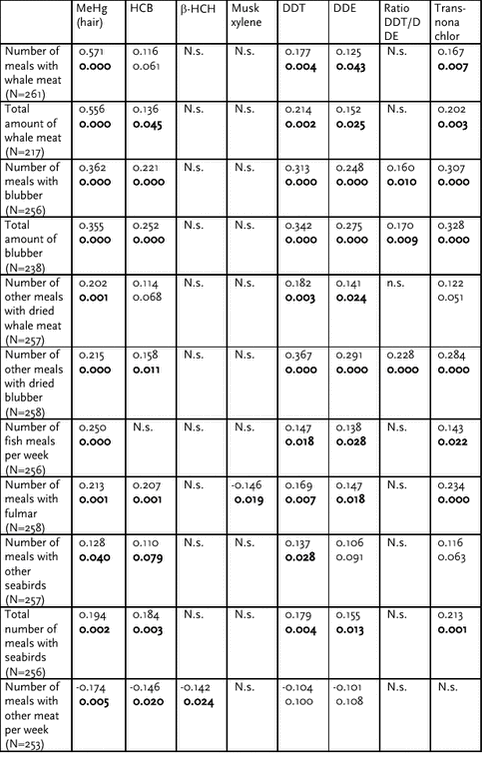
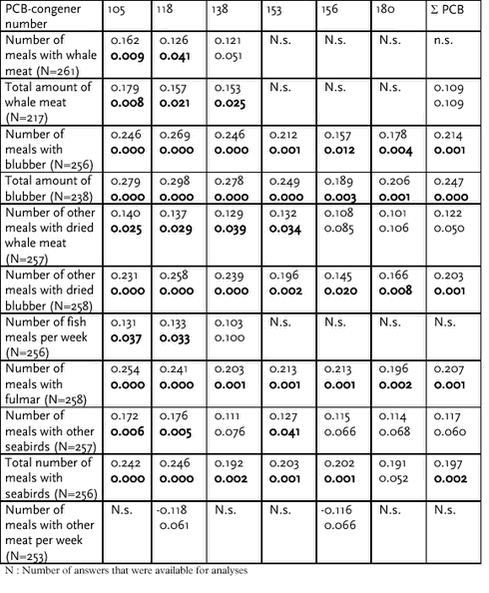
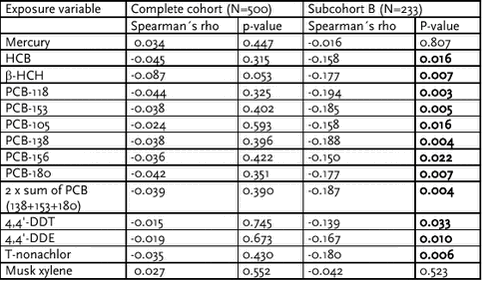
6.2.3.5 Correlations between exposure variables and diet In this section, the association between dietary habits is examined with regard to contamination with particular pollutants. The highest correlation between mercury in mother’s hair and food was found for the number of meals containing whale meat. But also blubber consumption, the number of fish meals per week, and the number of fulmars eaten during pregnancy showed a very close correlation to hair mercury of the mother (table 6.2.23). However, these dietary habits were also intercorrelated. HCB, DDT, DDE, and trans-nonachlor were very closely correlated with the consumption of blubber and fulmar. The concentration of these pollutants also increased significantly with the consumption of whale meat and the meat of other seabirds. The amount of DDT ingested with blubber seems to be higher than that of DDE resulting in a significant increase of the DDT/DDE-ratio in the milk of these mothers (table 6.2.23). A detailed assessment of the contribution of these dietary items will depend on data on pollutant concentrations in these items. Concentrations of PCB-105, 118 and 138 in breast milk are very well correlated to the consumption of any form of whale products (meat or blubber, dried or fresh) and the number of fulmars eaten during pregnancy. The consumption of blubber (dried or fresh) and fulmars seem to best predict the concentration of the PCB-congeners 153, 156, and 180 in breast milk, while whale meat is only a minor source of these congeners (table 6.2.24). No significant positive correlation was observed between any kind of food mentioned on the questionnaire and b-HCH or musk xylene. The consumption of which food leads to a significant change of the load with the different pollutants? Information to the question is collected in table 6.2.15. Dried blubber and fulmar seem to be the two sources that add the highest number of contaminants in significant amount. Not all possible foods containing the measured pollutants were registered in the questionnaire. More information about the sources of the contaminants may be revealed by further research. Table 6.2.15 Correlations between dietary habits and exposure variables
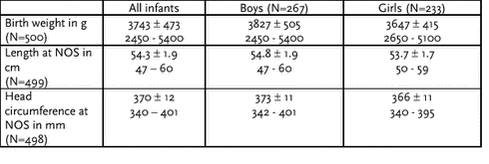
6.2.3.6 Dependent variables, part I: Anthropometric data, gestational age, and gender 6.2.3.6.1 Anthropometric data of infants 6.2.3.6.1.1 Description A wide range of birth weight was found with a Gaussian distribution. Boys were heavier than girls at birth, they were longer, and had a bigger head circumference (length and head circumference were measured at the neurological examination). The differences of all three measurements between both sexes were highly significant (p-value <0.001) (table 6.2.16). Table 6.2.16 Anthropometric data (mean, SD, second line in each cell: range of parameter)
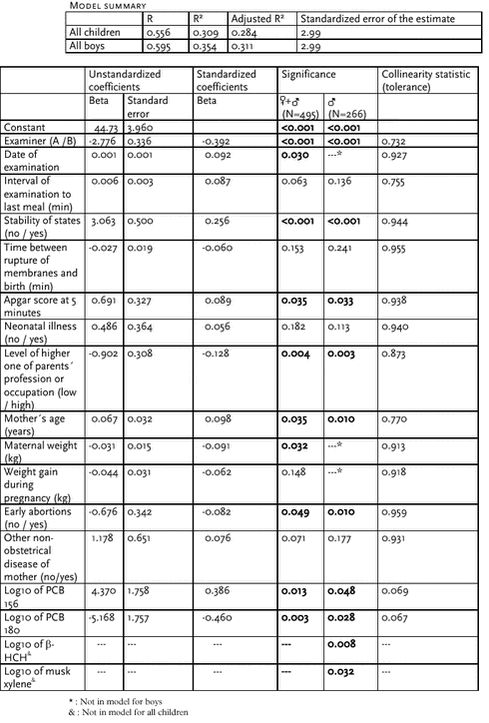
6.2.3.6.1.2 Correlations 6.2.3.6.1.2.1 Correlations of anthropometric variables and gestational age with parental attributes The birth weight of infant was positively correlated with BMI of the mother (p=0.002), weight gain during pregnancy (p=0.048), mother‘s weight (p <0.001), mother‘s height (p <0.001), mother‘s age (p=0.020), parity (p <0.001), and the fact that the mother suffered from diabetes (persistent or gestational) (p=0.013). A reduction of birth weight was linked to maternal smoking (p=0.003) and arterial hypertension (p=0.041). The analyses about a correlation between the metric data (mother‘s weight, height, BMI, age, parity, and weight gain during pregnancy) were repeated while controlling for gestational age in days. The results remained virtually unchanged. Birth weight is higher in infants of Faroese mothers as compared to those of non-Faroese mothers (p=0.002). The head circumference of these infants was also bigger (p=0.033) while the difference in length did not reach significance. No major difference in these correlations was seen between boys and girls. Gestational age (in days) increased with a higher maternal weight (p=0.030). Alcohol consumption during pregnancy appeared to prolong gestation (p=0.011). Arterial hypertension already present before pregnancy (p=0.043) and hypertension early in pregnancy (p=0.016) led to a shorter gestation. These tendencies are obviously affected by obstetric interventions. 6.2.3.6.1.2.2 Correlation of anthropometric outcome and gestational age to exposure variables A positive correlation between all exposure variables and birth weight were observed except for b-HCH. A significant positive influence on birth weight was reached for PCB-105 and PCB-118, and the sum of the three measured mono-ortho PCBs (congeners 105, 118, and 156). To differentiate between possible effects of pollutants on birth weight, the data were re-analyzed while controlling for gender. As already mentioned, the birth weight of boys was significantly higher than that of girls (see table 6.2.16).The boys showed a high sensivity to HCB, PCB-105, PCB-118, and DDT, while for girls no significant effect of exposure variables on birth weight could be found (table 6.2.25 in the appendix). For boys a highly significant relation between the DDT / DDE-ratio and birth weight was seen: the higher the ratio, the higher the birth weight (p=0.003). No new information was achieved if partial correlation coefficients were calculated while controlling for gestational age, maternal age, parity, and log10 of mother‘s BMI. Effects of exposure on head circumference measured at the neurological examination were weak. (table 6.2.26 in the appendix). If the analysis for the correlation between head circumference at neurological examination and exposure data was repeated after controlling for corrected age at neurological examination, a significant positive influence of MeHg, PCB- 105, and PCB-118 was seen for the whole cohort, while only PCB-105 increased the head circumference in boys (table 6.2.27). When taking the percentile of head circumference, the impact of all measured contaminants is greater in boys. HCB, PCB-118, 105 and 138, sum of the three mono-ortho PCBs, DDT, and trans-nonachlor reached significant levels of correlation. In girls no significant correlations between either head circumference – controlled for age – or percentile of head circumference at NOS and exposure data were found (table 6.2.28 in the appendix). For the complete cohort, no significant correlation was found between length at NOS and exposure data. All correlations were, however, positive except for b-HCH which gave a weak negative correlation (table 6.2.29 in the appendix). After further controlling body length for corrected age after expected date of delivery at neurological examination, for maternal height and weight, parity, and for log 10 of PCB-105, the relation between length and exposure data became more clear: HCB, b-HCH, DDT, and DDE significantly decreased the length (table 6.2.30). 6.2.3.6.1.2.3 Linear regression model for calculation of birth weight All the identified major factors influencing birth weight were used to create a linear regression model. The log10-transformed values of PCB-105 and SPCB served as independent variables. Gestational age (in days), maternal height, weight, and parity were introduced as covariates. As further important factors for birth weight, sex, Faroese and non-Faroese mother, mother with and without diabetes mellitus, and smoking of mother during pregnancy were added. For a summary of the model see table 17. The R² for the model was 0.274 (adjusted R² 0.259). Table 6.2.17 Linear regression for birth weight (in grams)
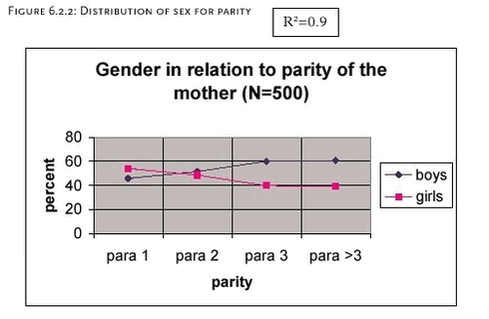
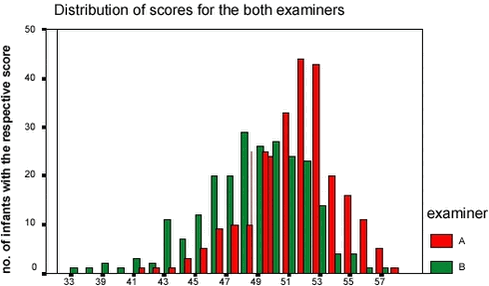
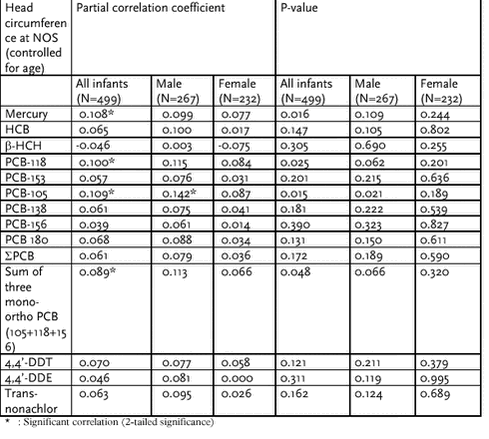
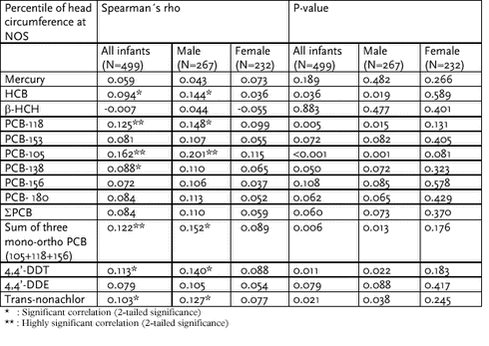
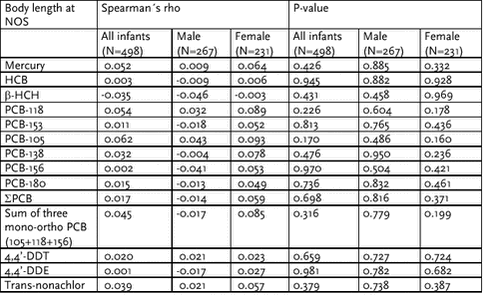
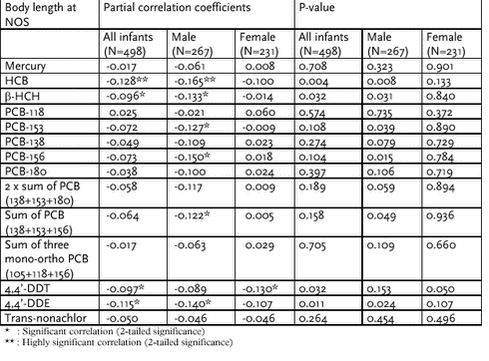
Unstandardized regression coefficients can be used to calculate the change of birth weight (in grams) per unit change in each variable, e.g. if gestation is one day longer, the birth weight can be expected to be 18g higher. For the log10-transformed exposure variables, a 10-fold change will cause a change of birth weight in the magnitude of the correlation coefficient, i.e. a plus of 221g for a 10-fold increase in PCB-105 and a minus of 315g for SPCB. The results shown indicate that several factors impact on birth weight. The effect of PCB congeners in different directions may be a statistical phenomenon due to collinearity, but it is also possible that PCB congeners may exert different effects. 6.2.3.6.2 Gestational age Duration of gestation was mostly influenced by maternal condition during the present, but also during former pregnancies: Arterial hypertension in the first trimester of pregnancy as well as any complication during a previous pregnancy led to a significantly earlier delivery (4 resp. 2 days). Other non-obstetrical disease during the present pregnancy (excluding diabetes, epilepsy, hypertension, and heart diseases) was also correlated with a significant shortening of gestation (mean of gestation for healthy mothers: 284 days, for those with disorders: 280 days; p=0.039). Previous spontaneous abortion (one or more) resulted in a shorter gestation for the child: 284 days if no abortion was reported, 282 days for any number of early abortions <16 weeks (p=0.025). The same difference in duration of gestation was found for primi-parae versus women with at least one previous birth (p=0.031). For the next pregnancies (third or more deliveries) a significant additional shortening of gestation was found (p=0.024). Exposure variables were only weakly associated with gestational age. Mothers of boys were about one year older than those of girls (p=0.046). This might explain why all measured contaminants were found in a slightly higher concentration in boys except for b-HCH that was higher in girls. None of the differences reached significance level. Since parity is also known to be of major influence on the load of contaminants, the infants were grouped after parity of mother. The sex distribution shows a higher ratio of girls for primipara (opposed to general experience which predicts a higher ratio of boys) and it changes after the second pregnancy to the expected distribution. To confirm this strange finding, the sex of all infants with known parity and who were born in the Tórshavn hospital during a period of 28 months (15.11.1997 to 15.3.200, N=1251) were analyzed, but the result remained unchanged (R² of trend line was 0.89). (Fig. 6.2.2). It is still unclear wheter this tendency is accidental or related to some form of selection bias. 6.2.3.7 Dependent variables: neurological outcome Analysis of neurological outcome in relation to exposure variables is divided in the results for the neurological optimality score (NOS) and the analysis of further neurological signs which were measured as a part of the neurological examination such as abnormal high or low muscle tonus, reduced amount of spontaneous movements (hypokinesia) and so on. 6.2.3.7.1 Neurological outcome, part I: NOS In general the total score of the NOS became higher towards the end of the examination period (correlation between date of examination and NOS highly significant, p-value for the Pearson correlation was <0.001). For the first 250 infants the mean of the NOS was 49.6 points out of a maximum of 60 points, for the second half of the children 50.3. 6.2.3.7.1.1 Description of results Most of the children, i.e. 368 or 73.6% were examined at the optimal age for the neurological examination (between 10 and 21 days after the expected date of birth). A total of 33 children (6.6%) were younger than 10 days, and 99 (19.8%) older than 3 weeks (see figure 6.2.4 in the appendix). This variation in age is obviously an effect of scheduling problems for mothers not reciding in Tórshavn. The examination started in four children directly after the last meal. The largest interval between last meal and examination was 5 hours. The majority of children (323 /467 or 69.2%, for 33 infants this value was unknown) was seen between 1½ and 3 hours after the last meal. 262 children were examined by pediatrician A, 233 by pediatrician B. The remaining 5 infants were seen by pediatrician C. The mean as well as the median of the sum score was 50 (out of 60) with a standard deviation of 3.6. The child with the lowest score archived 33 points, the highest score was 58. P10 was 45, P25: 48, P75: 52, P90: 54. For 8 infants (1.6%) the clinical diagnostic classification was suspect, none of the infants were considered abnormal. The clinical diagnosis sorted after examiner were: 262 / 262 children seen by A were normal, 226 / 233 children seen by B were normal, 7 abnormal. C examined 5 children, one of them was classified as suspect. As already mentioned in paragraph 6.2.3.2.1, the result of the NOS was significantly higher in infants, examined by A. The distribution of the scores given by the two main examiner can be seen in figure 6.2.3. Figure 6.2.3: Distribution of Neurological Optimality in dependence of examiner (A/ B) result of the neurological examination (points out of 60) 6.2.3.7.1.2 Association / correlation with parental / gestational data A negative correlation of NOS was found with the percentile of head circumference (p=0.012) and percentile of length (p=0.010), i.e. infants with a larger head or longer length scored lower. In the subcohort of infants seen by B the large-for-gestational-age infants (percentile of birth weight >90) had a significantly lower NOS than infants with a birth weight that was small or appropriate for gestational age (p=0.021). Parental smoking (sum of score for maternal and partner‘s smoking during pregnancy) is correlated to a less favorable diagnosis of NOS (suspect or abnormal result of neurological examination) (p=0.036). The higher the score for mother‘s education (or the higher one of the scores for parents school education) the more likely was the diagnoses “normal” in the summary for the neurological examination (p=0.034; for parents‘ education, 0.009). If the result of NOS in infants whose parents had a higher level of profession or occupation (see paragraph 6.2.2.5.5) were compared to those with a lower level of profession or education, there was a significant decrease in NOS (p=0.017). In the B-subcohort, infants who were large-for-gestational age (birth weight >P90) had a significant lower result in the neurological examination (mean of NOS for large-for-gestational age infants: 47.2, appropriate- or small-for-gestational age: 48.7; p=0.021). This findings will be further analysed, and regard will be taken of the potential risk of birth complications associated with large birth size. 6.2.3.7.1.3 Correlation of NOS with exposure data An increase in concentration of 4,4’-DDT in breast milk led to a less favorable NOS diagnosis, i.e. more frequently a suspect result was given (p=0.026). No other significant correlations between exposure and NOS could be found in the complete group. In the children examined by B, clear correlations of the NOS with the exposure data were seen: PCB-118, PCB-105, DDT, and trans-nonachlor led with high significance to a lower NOS. Also HCB, PCB-138, PCB-180, and DDE caused a reduction of NOS, the connection between NOS and contaminants being significant (p<0.05). For full detail of correlation coefficients and level of significance: see table 6.2.18. Table 6.2.18 Correlation of NOS with exposure data, differentiated for examiner
The correlation between NOS and exposure data were also calculated while controlled for corrected age at neurological examination, for environmental temperature, for interval since last meal, and for weight gain of mother during pregnancy. Boys reacted more strongly in respect to their neurological performance to the PCB-congeners, to DDT, DDE, and trans-nonachlor. For HCB, a highly significant negative correlation with the NOS was found in boys while the substance had no apparent influence in girls. The significant negative effect of b-HCH in boys converted in girls into a significant positive factor for the NOS. Mercury acted as a weak positive factor on NOS in boys while it decreased the performance in girls, nearly reaching significant level of correlation. The complete list of correlations and p-values can be found in table 6.2.31 in the appendix. 6.2.3.7.1.4 Linear regression model for calculation of NOS The list of influences on the neurological status of a newborn infant is long. Therefore models that show the effects of prenatal contaminants on the neurological presentation have to be very complex. They will include many factors. The summary of one model using multiple linear regression is presented in table 6.2.19. As in table 6.2.17, the change of one unit of a variable will cause a change of the NOS in the magnitude of the respective Beta-coefficient (for log10-transformed variables, a change with the factor 10 of the variable will cause a change of one unit of the NOS). R² was 0.221, adjusted R² 0.198. For the children examined by B another model was constructed which gave a R² of 0.273 (adjusted R²: 0.228), see table 9.2.7 in the appendix. If in this subcohort only the boys were tested, the R² came up to 0.566 (adjusted R² 0.514) while the same model did not fit for girls again suggesting that different mechanism are responsible for the performance in boys and girls. Table 6.2.19: Linear regression model for NOS (for children seen by A and B)
It is noteworthy that two PCB congeners caused effects in different directions. Colliniarity problems limit the validity of this findings. However, in conjunction with the associations with birthweight, the possibility exists that dioxin-related PCB congeners have toxic potentials that differs from other PCBs. 6.2.3.7.1.5 Correlation between diet during pregnancy and neurological status at 2 weeks For the combined cohort no relation between the result of the neurological examination and one of the recorded dietary habits could be shown. However, the reflex cluster score improved with a higher number of meals with dried blubber and the total amount of blubber, consumed during pregnancy, but the consumption of fulmar led to a reduction of the score. Seabirds but not fulmar caused a significant reduction of the postural tone cluster score (table 6.2.10). When the analyses were repeated for the subcohort of children examined by A and the one seen by B, the results did not differ much. Additionally a highly significant correlation was found between the number of fish meals per week and the NOS (p=0.008) for subcohort B. Diverging from the result of the combined cohort, the girls examined by B showed a very strong reduction of the reflex cluster score with an increasing number of meals with or total amount of blubber (p=0.007 and 0.008). Table 6.2.20 Spearman‘s rho and p-values (if p-value was £0.10)
6.2.3.7.2 Neurological outcome, part II: other neurological signs 6.2.3.7.2.1 Hypokinesia Interval between last meal and neurological examination and severeal exposure variables weakly increased the probability to get the diagnose “hypokinesia” in the summary of the neurological examination. A higher concentration of mercury leads apparently to more activity: the diagnose “hypokinesia” was given less frequently (p=0.119; for boys only 0.038). PCBs, 4,4‘-DDE, and trans-nonachlor showed stronger effects in girls. For details: see table 6.2.33 in the appendix. 6.2.3.7.2.2 Postural tone cluster score Significantly lower results of postural tone cluster score were achieved by children with icterus at neurological examination (mean for the children without icterus: 8.2 versus 6.5 for those with icterus; p=0.001. In children of Faroese mothers, the tone cluster was significantly lower than in those of foreign mothers (mean 8.1 versus 9.1; p=0.034). No influence of the father‘s nationality was found. A significantly higher postural tone cluster score (p=0.020) was found in infants who needed transfer to the neonatal ward for observation or treatment directly after birth (muscle hypertonia caused by mild asphyxia?). When testing all boys, a negative influence on the result of the postural tone cluster score of all measured PCB-congeners, DDT, DDE, HCB, b-HCH, and trans-nonachlor was seen. For girls the tonus cluster score increased with increasing b-HCH (Spearman‘s rho 0.132, p-value 0.045), the same was true for the PCB-congeners, HCB, dioxins, trans-nonachlor. For mercury a mild negative correlation with the tonus score of girls was found (p=0.212). Testing the partial correlations for postural tone cluster score (controlled for corrected age at neurological examination, environmental temperature, interval to last meal, and weight gain), for the combined cohort a very weak negative influence of all substances was found. The separate analysis of boys and girls revealed obvious differences in their reaction to the exposure variables: while mercury was negatively correlated to the tone score in girls, all other substances slightly improved the result. In boys, for all contaminants a negative correlation to the tone cluster was seen, the strongest the one with PCB-118 (p=0.105). The negative influence of mercury on the tonus in boys was much weaker than in girls. If only the tone of the legs was tested in the B-subcohort a significant negative influence of MeHg could be shown for the whole group (p=0.021) as well as for the girls (p=0.032). No clear influence of exposure data on the muscle tonus of the legs in the children examined by A. 6.2.3.7.2.3 Opisthotonus Pediatrician A never found opisthotonus in the infants examined, so only the subcohort B was used. Children with the diagnosis “opisthotonus” had significantly lower levels of PCB- 118 (p=0.030), PCB-153 (p=0.012), PCB-138 (p=0.015), PCB-156 (p=0.024), PCB-180 (p=0.012), DDE (p=0.019), and trans-nonachlor (p=0.028) in breast milk. In girls the apparent preventive effect of the named pollutants against the diagnose “opisthotonus” was stronger than in boys. 6.2.3.7.2.4 Reflex cluster score When the complete cohort was analyzed, all of the POPs except musk xylene showed a weak negative influence on the reflex cluster score. When the correlation was controlled for corrected age at NOS, environmental temperature, interval to last meal, and maternal weight gain during pregnancy the negative correlation between b-HCH and HCB with the reflex cluster score became significant (p=0.029 and 0.031). As for the postural tone cluster score the separate analysis of boys and girls revealed differences in their reaction to the exposure variables: Mercury was positively related with the reflex cluster score in boys, but negatively in girls. The observed negative correlations between all of the POPs in boys were much stronger (especially for DDT) than in girls. The bivariate correlation of the reflex score with the contaminants were also tested for the two subcohorts. For the subcohort A a positive correlation between reflex score and all exposure data, including mercury was found, but none of the correlations reached significance (all p-values >0.10). An uniform negative relation between all exposure data and the reflex cluster score were found in the children examined by B. Beside mercury and musk xylene the correlations were significant for b-HCH, PCB-118, PCB-153, PCB-138, PCB-180, and trans-nonachlor (see table 6.2.34 in appendix). 6.2.3.8 Different reactions in boys and girls Here a short summary of the diverging reactions on the different pollutants in boys and girls will be given. First the effects on growth are discussed. Then the results of the neurological examination in dependence of gender follow. PCB-105 had the strongest impact on birth weight, length and head circumference. In boys, the positive correlation between the concentration of this congener in breast milk was much higher than in girls. When the exposure of the other pollutants was controlled for PCB 105, all visible influences were still greater in boys: percentile of head circumference increased more with higher concentrations of contaminants than in girls; length was reduced more (except for DDT which affected girls more than boys) by all pollutants in boys. Mercury had a “positive” influence on the NOS in boys, an adverse one in girls. b-HCH led to a lower NOS in boys, to higher one in girls. In both cases the correlation was a significant one. HCB didn’t influence the neurological outcome in girls, while in boys a significant negative influence was observed. The negative impact of all tested PCB-congeners (IUPAC numbers 105, 118, 138, 153, 156, and 180) was much weaker in girls than in boys. The same was true for DDE, DDT, and trans-nonachlor. The diagnosis “opisthotonus” was given less frequently with higher exposure to contaminants. This effect was stronger in girls than in boys, but musk xylene in girls leads to opisthotonus in girls, while seemingly preventing it in boys. Reflex cluster score improved with increasing maternal hair-mercury in boys, while becoming lower in girls. All other contaminants showed a stronger negative impact on reflex cluster score in boys, especially DDT and b-HCH. The correlation of hypokinesia with pollutants was more marked in girls for all measured PCB congeners, for DDE, DDT, and trans-nonachlor. On the other hand, boys tended more frequently to obtain the diagnosis “hypokinesia” with higher b-HCH and musk xylene. A list of the observed differences in the neurological outcome in boys and girls is given in table 6.2.35. 6.2.4 DiscussionIn considering the findings of the present study, the complexity of the exposure situation must be appreciated. More than 200 PCB-congeners exist. The number and position of the chlorine is responsible for the toxicity of a particular congener. Usually sums of PCB-congeners were used. They were introduced to reflect the total toxicity – including dioxin-like effects – of a certain mixture by adding few of the measurable congeners. But the mixtures found in seafood will vary depending on the sources. Therefore, the special effects of particular congeners such as PCB-105 reported here, might easily have been overlooked. The same difficulty arises for some of the other POPs where only few substitute substances are measured. Other, until now unknown substances might accompany the POPs in whale products, fish, or other specific food (seabirds) eaten by Faroese mothers. Thus the measured substances could function as a surrogate variable for the unknown substance. If the concentrations of the measured and the surrogate substance are not strongly correlated, interpretation of results becomes difficult. Some other habits, dietary or otherwise, which were not recorded in the present study, might also be the origin of an exposure which causes results that contradict the conclusions of other studies. Only further research, especially the examination of the effect of the particular PCB-congeners, will help to resolve these problems. 6.2.4.1 Characteristics of parents, life style factors, dietary habits of mothers and exposure data Several correlations between maternal attributes and the load of POPs have been described in the literature: The positive correlation of the concentration of all substances with maternal age was already reported in 1984 (Fein et al., 1984). In Germany, values for contaminants in a 40-years old primipara are about 1.5 to 2.0 higher than in a 20-year old mother of a first child (Institut für Wasser-, Boden- und Lufthygiene des Bundesunweltames, 1999). There is a simple explanation for this phenomenon: the amount of organochlorines in body fat increases with age because of continuous human exposure to low levels and long biological half-lives of these chemicals (Schade et al., 1998; Vartiainen et al., 1998). In our cohort, maternal age was highly significantly correlated to all of the organochlorines. Higher age and higher parity are connected with each other. While some authors found a negative correlation of exposure data to parity (Fein et al., 1984), in another Faroese cohort increased parity or age were associated with slightly increased mercury concentrations in cord blood and hair (Weihe et al., 1996). In a Finish study, PCB concentrations in human milk in primiparae increased with age (Vartiainen et al., 1998). Breast-feeding of previous children can result in a decrease of body fat depots and it constitutes an important route of excretion for persistent organochlorines; the same is true for previous pregnancies (Fein et al., 1984; Schade et al., 1998). Not knowing how long the mothers nursed their children and lacking any information about weight gain or loss of weight during these period(s), exposure data were analyzed for the present cohort with respect to maternal age and parity. Not all of the organochlorines were reduced by a higher number of pregnancies and thus – for most of the Faroese mothers will nurse their infants for at least half a year – longer total period of breast-feeding. Higher pre-pregnancy BMI was strongly correlated with an increase in many of the pollutants measured in breast milk in our cohort. Post-pregnancy BMI was measured in other settings and found to be a significant predictor of the likelihood of having higher concentrations for the sum of DDT and DDE, HCB, and ß-HCH while leading to lower concentrations for PCB levels (Schade et al., 1998). Mothers who were more highly exposed to PCB had a lower weight gain during pregnancy than non-exposed women (Fein et al., 1984). For the Faroese mothers, a negative correlation could be shown between weight gain and mercury in mother‘s hair and most of the tested other POPs (b-HCH, HCB, DDT, DDE, and trans-nonachlor) in breast milk. A higher weight gain during pregnancy may lead to a dilution of POPs previously accumulated, thus giving lower concentrations of the named contaminants in breast milk. To answer this question in detail the mother‘s load with pollutants has to be known before pregnancy. The influence of alcohol consumption during pregnancy on the reduction of mercury concentrations in mothers is well known (Weihe et al., 1996; Dunn et al., 1981). However, mercury in hair in this study increased significantly with mother‘s consumption of alcohol during pregnancy. Because of the low alcohol intake levels, this association is likely to be spurious and not an indication of toxicokinetic interactions. In German and Canadian breast milk samples consumption of spirits (alcoholic beverages) led to an increase of ß-HCH and HCB (Schade et al., 1998; Dewailly et al., 1996). The reason for the relationship is not clear. Alcohol abuse can induce chronic liver damage, which may in turn reduce the biotransformation rate of the measured chemicals. Alternatively, alcohol could increase absorption of organochlorines by raising the solubility of the substances in gastrointestinal fluids. Another and more likely explanation could be that alcohol intake is related to specific eating habits, especially to a diet containing more fat (Schade et al., 1998). In the presented study, DDT was higher in alcohol-consuming mothers. Also the ratio DDT/DDE in these mothers was significantly higher than the one in teetotal mothers which either could be caused by the fact that the life style of mothers who consume alcohol leads to a higher ingestion of DDT or that the conversion to DDE is delayed by a hampered or changed metabolism. Mothers who drank alcohol reported a higher amount of whale meat, a higher number of meals with dried whale meat, and a lower number of fish meals per week consumed during pregnancy. This supports the hypothesis that alcohol consumption is related to a different diet, which increases their load of pollutants. Smoking showed no significant association with organochlorine compounds in breast milk also reported by other authors (Schade et al., 1998; Vartiainen et al., 1998). According to Lackmann SPCB (also true for the all single congeners except PCB 180) and HCB increase in a smoking mother (more in active than in passive smoking mothers) (Lackmann et al., 2000). Again, any toxicokinetic impact is questionable. positive correlation between maternal age and occupational or professional status of both parents.Low score in school education and low score in mother‘s occupation are correlated with a higher consumption of whale meat during pregnancy while no influence on the number of fish meals per week could be seen. There are two possible explanations for the observation: either the lower education led to an ignorance of governmental recommendation concerning the consume of whale products or the living place of the mother functioned as confounder for a lower school education and occupation on one side and a higher availability of whale meat on the other side. A connection of social data like school education or present occupation of parents with the place of mother‘s residence was not yet possible. That preference and availability of whale products influence the load with contaminants became clear when correlating nationality and exposure data: higher concentrations of nearly all contaminants were found in Faroese women who can be assumed to be used to the consumption of whale products and seabirds and to have a better access to both. 6.2.4.2 Non-neurological characteristics of the infants An apparently positive influence of all pollutants on birth weight was seen. After splitting the PCB-congeners into the individual congeners that were measured in breast milk it became clear that mainly the mono-ortho congener PCB-105 increases the birth weight, while PCB-153 (a di-ortho PCB) leads to a significant reduction of birth weight. In boys, the changes in both directions were stronger than in girls. Additionally a negative effect of DDE, HCB, and trans-nonachlor could be shown. A negative effect of POPs, especially of PCB on birth weight corresponds to the experience of several other authors (Fein et al., 1984; Schade et al., 1998; Brouwer et al., 1995; Patandin et al., 1998). However, because of collinearity these effects may be difficult to disentangle. The linear regression model explaining birth weight resembles well the one for another Faroese cohort (Grandjean et al., 2001), but some additional factors influencing the birth weight could be identified: maternal weight, diabetes of mother, and mother‘s nationality, the last one probably reflecting the preference or availability of some food items or the presence of other ingredients in the dietary which differ in native people and foreigners. Thus, in our previous study, we showed the strong effect of polyunsaturated fatty acids present in fish oil, but these parameters were not assessed in the present study. For head circumference, the same pattern of positive influences (especially the significantly positive correlation with HCB, PCB-105, PCB 118, DDT, and trans-nonachlor were found. The length of boys measured at the neurological examination decreased in dependence of the concentration of b-HCH, HCB, PCB-153, PCB-156, and DDE. In girls no significant effects on birth weight and head circumference were seen; solely their length increased significantly with increasing concentrations of contaminants. Possible mechanisms by which PCB-105, PCB-118, HCB, 4,4‘-DDT, and trans-nonachlor may affect birth weight and head circumference may relate to a growth-hormone-like effect of the substances or in their effect similar to other hormones. The effects of the contaminants as hormone active agents (DDE acting antiandrogenic, some of the PCB-congeners and DDT causing estrogen-like effects) might explain why reactions to the pollutants differ between boys and girls. Altogether the girls appear less vulnerable than the boys. The incidence of hypospadias and cryptorchism that might be a sequel of disturbances in the early development of male sex organs caused by hormone active agents was too low to be tested statistically. No significant correlation between either diet or one of the pollutants and length of gestation was found in this study, but was reported in other studies in the Faroe and elsewhere (Fein et al., 1984; Grandjean et al., 2001). But the concentration of fatty acids in maternal or cord serum that are responsible for a prolongation were not available for this cohort. Our data suggest a relationship between sex and parity as well as sex and concentration of contaminants: the higher the parity, the higher the percentage of boys. First pregnancies resulted in more girls than boys, after the second child the boys outweighed the girls. The proportion of boys increased with each pregnancy. This may confirm the findings of other authors: Mocarelli and Brambilla reported an excess of female offsprings of parents who were exposed to high concentrations of dioxin after the Seveso accident (Mocarelli et al., 1996). Brouwer et al (Brouwer et al., 1995), found fewer boys than expected born to fishermen wives from the Swedish East Coast, whose pooled blood samples were found to have higher PCB levels than those of the Swedish West Coast. PCB levels and the concentration of POPs in breast milk were lower in primi-parae in our study. Still more girls than boys were born to primi-parae. Probably not only dioxin but a mixture of several substances are responsible for this phenomenon. 6.2.4.3 Neurological outcome The interpretation of the neurological results is made difficult by several potential obstacles: For the second half of the study period higher NOS scores were achieved. This might be caused by (1) a higher percentage of children examined by A (48.2% versus 57.6%) who tended to give higher scores for the examination during the later part of the study or (2) because both examiners increased their scores during the study. As already discussed above (6.2.3.2.) it is not easy to get comparable results for the NOS if different persons carry out the examination. Thus the cohort had to be separated for most of the analyses of the neurological outcome. Many other factors can be of major impact on the performance, some of them like environmental temperature and interval between last meal and examination could be identified. But there well might be some important unknown factors that change the result of the examination. An overall negative correlations was found between all exposure variables and NOS for the complete cohort and the subcohort B. In the subcohort the correlation often reached significance level especially if controlled for gestational age. The most important substances that caused a reduction of the NOS were HCB, PCB-105 (as well as the sum of the three measured mono-ortho PCB-105, 118, and 156), trans-nonachlor, and 4,4-DDT. For the subcohort A mostly a positive influence of the substances on the neurological performance of the infant was found. Only the concentration of mercury in maternal hair (very weakly correlated) showed a negative effect on the neurological outcome of the newborn. A positive correlation between prenatal exposure to POP is against the experience from former studies (Committee on Hormonally Active Agents in the Environment, 2001; Huisman et al., 1995; Rogan et al., 1986; Steuerwald et al., 2000). Because the examination and the scoring for the NOS is a highly subjective, it has to be assumed that the explanation for the unexpected results in the subcohort A was caused by spurious variation. Unfortunately a regular interrater-reliability control or a control of the examination technique of the examiners, which could have helped to reduce differences, was not possible. Postural tone cluster score was weakly reduced by most of the contaminants. This confirms the findings of other authors who also described a decrease of muscle ton with increasing concentrations of PCB (Huisman et al., 1995; Fein et al., 1984; Rogan et al., 1986). The impact of the pollutants on the reflex cluster score was stronger: for the subcohort B a highly significant negative correlation between reflex score all tested substances except MeHg and musk xylene was apparent. In other words: POPs led to a hyporeflexia in this group of infants. Rogan saw a negative influence of PCB on reflexes (Rogan et al., 1986). and DDE levels in breast milk as low as 4 µg/g lipid can suppress reflexes in newborns (AMAP, 1997). The eight infants who were exposed to such a high concentration of DDE in our study, had a lower reflex cluster score (and NOS) but the difference from the other infants did not reach significance. Mercury was positively associated with abnormal reflexes in boys, but not in girls (hyperreflexia). Hyperreflexia and exaggerated deep tendon reflexes were observed in boys with high mercury exposures during pregnancy, but the present study could not confirm this association (WHO, 1990). As to the anthropometric results, the associations with the contaminants differed in boys and girls, e.g. b-HCH increases the probability for the diagnosis “hypokinesia”, but reduces it in girls (both correlations were not significant). After controlling for some of the covariates which were found to have an impact on the NOS (namely corrected age in days at the neurological examination, environmental temperature during examination, and log10-transformed maternal pre-pregnancy BMI), the NOS in girls was negatively related to mercury (in the B subcohort), but boys showed a weak positive correlation. On the other side a significant (in the B subcohort) an influence of nearly all other pollutants could be shown in boys while for girls no correlation of the same substances on NOS was seen. A possible mechanism that might explain the phenomen was mentioned in section 6.2.4.2. 6.2.4.4 Diet and exposure variables As has been known for some time (Grandjean et al.,1992) the amount of whale meat consumed during pregnancy is the best predictor for maternal MeHg exposure. Blubber and to a much lesser degree fish may add some more mercury to the maternal load. Any form of blubber - dried or fresh – seems to be the major source not only for PCB but also for DDT, DDE, and trans-nonachlor. The consumption of fulmar showed positive correlations to PCB, DDT, DDE, and trans-nonachlor. High levels of PCB were already described to be most likely the effect a diet of sea mammals, fatty fish, and perhaps eggs from seabirds (AMAP, 1997). It is known that also other seabirds, especially those which eat fish, have high levels of PCB and DDT. The puffin is one of them, and it is frequently consumed in the Faroe. The contamination of migratory seabirds like the fulmar often originates from pollution of their wintering areas. The concentration of pollutants in the eggs of the birds often approaches the levels where effects like embryo deformities and failing of hatching might occur (AMAP, 1997). The questionnaire used did not ask about consumption of seabird eggs. However, of the seabirds eaten by the mothers, the correlation with fulmar exeeded those for other seabirds. Recommendations about the consumption of seabirds and eggs might be considered as a consequences of these findings. The consumption of all different whale products – meat or blubber, fresh or dried – is interrelated, i.e. those who have access to whale products are likely to use them all. Those who eat fulmar tend also to eat other seabirds, but only the consumption of dried whale meat is significantly correlated to the number of fulmars eaten during pregnancy. Probably this is a sign of traditional lifestyle that leads to a very high exposure to the potentially harmful substances. Fish meals as such seem to be less important when looking for the sources of contaminants. The number of fish meals correlates with mercury in maternal hair and milk, DDT, DDE, and trans-nonachlor. Of the PCB-congeners the concentration of PCB-105 and PCB-118 increased with the number of fishmeals per week, but not the other congeners. High HCB-concentration resulted from the consumption of whale meat, blubber, and fulmar but not from fish. Musk xylene showed mainly negative associations. Again this might reflect a certain traditional life style that reduces the use and contact with preparation containing musk xylene. Consumption of other meat, (e.g. chicken, lamb or beef), serves as a protective factor against the exposure of the infant and foetus by the potentially harmful substances as indicated by negative correlations with the pollutants. Maternal smoking and smoking of partner is found more often in families where the mother reported that they had eaten whale meat and / or blubber on two consecutive days. This might suggest an overall unhealthy life style where recommendations for an optimal outcome of pregnancy are unknown or ignored. 6.2.4.5 Comparison of present exposure data with those from earlier studies The geometric average of hair-mercury in about 1,000 Faroese women of children born in 1986 and 1987 was 4.3 µg/g, with 130 samples above 10 µg/g; the maximum was 39.1 µg/g. Only 5% of the Faroese women had hair-mercury concentrations below 1 µg/g (Grandjean, 1992). Compared to this cohort, slightly lower overall mercury concentrations were found in a second cohort that was created in 1994 and 1995 with geometric means of 4.1 µg/g (Steuerwald et al., 2000). In the present data a geometric mean of 2 µg/g was found. Now only 5% of the samples exceeded a concentration of 10 µg/g and 18% were below 1 µg/g. The highest load with a concentration of 32.7 µg/g did not differ much from the one reported for the earliest cohort. Thus mercury concentration has clearly decreased since the establishment of the first cohort, probably as result of changed recommendations for the population about the consumption of whale products. Differences in the load with PCB are much smaller due to the longer half-lives of these compounds which despite of changed dietary habits will take longer time to decrease. For the second cohort (for the first cohort only PCB-levels in umbilical cord for half of the children were available) SPCB in breast milk from day 4-5 had a geometric mean of 1.52 µg/g lipid (total range 0.07-18.5 µg/g) (Steuerwald et al., 2000) which is nearly identically to the values resulting from this cohort (1.33 µg/g lipid with a total range of 0.08-17.6 µg/g lipid). However, as the analyses were conducted by the same laboratory, the slight decrease indicated may reflect a real change. In the second cohort, DDE in maternal milk reached a geometric mean of 0.87 µg/g lipid, the interquartile range was 0.49 – 1.55 µg/g, with a total range of 0.05 – 13.7 µg/g (Steuerwald et al., 2000). If compared with the values of the present cohort, a slight decline in this contaminant as well was found, with 0.60 µg/g for the geometric mean, an interquartile range of 0.36 – 0.99 µg/g, and a total range of 0.06 – 11.35 µg/g. Whether the described decline of MeHg, SPCB, and 4,4‘-DDE is solely caused by the changed recommendation about the consumption of whale meat and blubber, a higher awareness of the population about the potential harm of whale-products especially for the foetus and young infant, or whether this is an effect of reduced load of the whales themselves after implementation of strict regulations and bans of some of the substances cannot be decided by these data. In addition, maternal age may be considered as a covariate, the mothers from cohort 2 now being about 5 years older at the time of the generation of the present cohort 3. 6.2.5 ConclusionsMarine food / traditional food provides many benefits: Marine mammals and fish are rich in polyunsaturated fatty acids. A diet high with PUFA has been associated with lower risk for heart disease. Whale skin and other marine foods are rich in selenium. Selenium may perhaps reduce the toxic effect of mercury, may increase the body’s antioxidant defence, and may protect against cancer and possibly against heart disease. High levels of vitamin A are found in animal liver and blubber. In general, traditional diets therefore provide a strong nutritional base for health (AMAP, 1997). But the growing foetus is exposed to contaminants in the womb, and the levels in the mother‘s body will determine its dose of persistent organic pollutants. By the time a woman knows that she is pregnant, she can only partially influence this dose by changing her food habits. Most of the exposure comes from persistent organic pollutants she has accumulated in her body since she was born. An important way to reduce fetal exposure to POPs is therefore to develop dietary advice for girls, women of child-bearing age, and pregnant women to promote the use of less contaminated local food to help reduce POP intake (AMAP, 1997). Realizing the hazard resulting from the present contaminations and as a consequence of the findings of studies in the Faroes, new recommendations on the consumption of whale products were issued by the government in 1998. Adults should refrain from having more than one or two lunches of whale meat (corresponding to 300g whale meat each second week) or blubber per month. Girls and women should not eat blubber at all before the end of the reproductive period. Women who intend to get pregnant during the next three months, women who are pregnant or those who are breastfeeding should not eat any whale meat at all. Livers and kidneys of whale should not be eaten by anyone at all (Heilsufrøðiliga Stravsstovan, 1998). Whale meat contains about 1.9 mg/kg. i.e. much more than mercury levels in Faroese fish. This is the background for the above-mentioned recommendation for whale meat. Because of the beneficial effects of fish consumption, the long-term goal needs to be a reduction in the concentration of MeHg in seafood rather than a replacement of fish in the diet by other foods. In the interim, the best method of maintaining fish consumption and minimizing Hg exposure is the consumption of fish known to have low mercury concentrations (Committee on the Toxicological Effects of Methylmercury, 2000). Another easy recommendation should be added for nursing mothers: while a higher weight gain during pregnancy leads to a reduction of the concentration of contaminants in the body, this advance has to be weighed against the higher incidence of complications during delivery, lower Apgar scores and other disadvantages of the maternal weight gain. A reduction of maternal weight during the lactation period leads to a very high concentration of all compounds in breast milk, and therefore should be avoided (Institut für Wasser-, Boden- und Lufthygiene des Bundesumweltamtes, 1999). PCB and HCB have carcinogenic and teratogenic properties, and tumor-promoting properties if applied together with tobacco-specific carcinogens (Lackmann et al., 2000). Therefore tobacco smoking together with eating whale products and seabirds (probably also eggs of seabirds) should be strongly discouraged in the whole population. Further effects especially those of the hormone active agents will have to be examined in some years. 6.2.6 SummaryEffects of prenatal exposure to methyl mercury and persistent organic pollutants originating from marine food were studied. Data collection took place during a two-year period and involved a cohort of 500 mother-infants pairs. Information about socioeconomic and obstetrical conditions and the dietary habits of the mother during pregnancy was recorded. As outcome parameters length of gestation, growth and sex were recorded. Neurological performance was tested at the adjusted age of about two weeks. Exposure was determined by analyzing maternal hair for mercury and transitional breast milk for persistent organic pollutants. An adverse influence of these contaminants on the outcome variables could be shown. Differences in results in boys and girls are in agreement with the ability of several of the substances to mimic or disturb the function of sex hormones. When comparing the exposure in the present study with previous established Faroese cohorts it could be shown that contamination with mercury now amounts to only half of the exposure 15 years ago. Concentration of POPs in breast milk were almost unchanged since 1994. Further activities of health authorities are necessary to reduce the still high exposure of the population. In addition to whale meat and blubber, attention should also be paid to fulmars and perhaps also other seabirds as sources of exposure. 6.2.7 Appendix
6.2.7.2 Tables Table 6.2.21 List of items included in the Obstetrical Optimality Score
Table 6.2.22 Correlation coefficients (Spearman) between different groups of persistent organic pollutants in breast milk
Table 6.2.23 Correlation coefficients (Spearman) between dietary habits and mercury (in mother‘s hair) and different POPs (in breast milk)for all p-values £ 0.100. In the second line in each row, the p-values significance are given. Those reaching a significance level of 0.05 are written in bold numbers.
Table 6.2.24 Correlation coefficients (Spearman) and p-values between different PCB congeners and dietary habits during pregnancy (for p £ 0.1). In the second line in each row, the p-values for the two-tailed significances are given. Those reaching a significance level of 0.05 are written in bold numbers.
Tables 6.2.25 –6.2.30 Bivariate / partial correlations between anthropometric data and exposure variables; p-values of significant correlations are written in bold letters Table 6.2.25 bivariate correlation between birth weight and exposure data
Table 6.2.26 Bivariate correlation between head circumference and exposure data at NOS
Table 6.2.27 Head circumference and exposure data: partial correlation, controlled for corrected age in days at NOS; for exposure variables, the log10-transformed values were used
Table 6.2.28 Bivariate correlation between percentile of head circumference and exposure Table 6.2.29 Bivariate correlation between body length and exposure data, all children
Table 6.2.30 Body length and exposure data: partial correlation, controlled for age at NOS, for maternal weight and height, for parity, log10 of PCB 105 - all children)
Table 6.2.31 Partial correlation between NOS and exposure data, cohort divided after sex (corrected for corrected age at NOS, environmental temperature, interval to last meal, and weight gain of mother during pregnancy)
Table 6.2.32 Linear regression model for NOS (examiner B only) Model summary
Table 6.2.33 Correlation between hypokinesia and exposure data* (T-test)
Table 6.2.34 Bivariate correlation between reflex cluster score and exposure data Table 6.2.35 Summary of neurological effects, differentiated after sex
6.2.7.3 Figures Figure 6.2.4 Distribution of corrected age of infants in days (age after expected date of delivery, which was calculated after last menstrual period) at neurological examination.
6.3 Dietary Survey of Faroese Women in Third Trimester of Pregnancy6.3.1 Material and Methods:In August 1998 Faroese health authorities recommended women to reduce their intake of pilot whale meat and blubber in order to protect the foetus against adverse effects from food contaminants. This study describes the effects of this recommendation. To cover the daily variations we used 24 hour recall (24 h recall), as well as a food diary (FD), where all food consumed during one day at a time was reported. To adjust for seasonal variations the women answered a food frequency questionnaire (FFQ) where what is considered Faroese food was listed and we asked about consumption during the past 12 months. General information about height, weigh and smoking and drinking habits, previous deliveries and educational level were recorded. Blood samples were taken in the 37th week of pregnancy and analysed for heavy metals and organochlorines. The registration sheets were in accordance with a previously performed dietary survey in the Faroes and in accordance with datasheets approved upon in the human health group of AMAP. In the Faroe Islands there are three delivering units, one main unit at the main hospital in Tórshavn and the other two at hospitals in Tvøroyri and Klaksvik. When a woman becomes pregnant, the GP reports this to the delivering unit where she is expected to give birth. We used these lists with names, ID numbers, addresses and term dates to enter the participants in a data base designed for this purpose, and each subject was assigned her own file number. A standard letter, where the purpose of this study was explained and how we were obtaining the information, was sent to the women when they were 24-26 weeks pregnant. They could respond themselves by returning the signed form but often we contacted them by telephone approximately one week after the letters were sent, to provide further information and ask if they wanted to participate. We sent letters for one month at a time. The data collection was done for 51 weeks, from Oct. 2000 until Sep. 2001. Two individuals served as interviewers, one clinical dietician and one trained midwife. During this period there were a total of 486 pregnant women and 298 = 65,6% were invited to participate. 100 women did not want to participate, but did not give any specific reason, 3 women had had a miscarriage, in 2 women the term date did not equal the list we had and they were too close to term date and 4 women were abroad. A total of 189 (66,4%) agread to participate. During the investigation period 8 subjects (2,7%) did not want to continue, 14 subjects (4,7%) did not take the blood sample and dropped out, 10 subjects (3,4%) did accept to participate but an appointments was not made and 9 subjects (3%) did accept to participate but we could not accommodate the interviews because of lack of time. We ended up with 148 (49.7%), who participated in the entire project. Data Collection: We interviewed the women at home when they were about 28, 33 and 38 weeks pregnant. They received a telephone call the evening before to make an appointment, at 8:30–10:00 p.m. The usual time for supper in the Faroe Islands is around 6:30 p.m. and by calling them at this time we assumed that most of the meals that day already had been consumed. In some cases we called the morning of the interview. To estimate the amount consumed we used (food) models and pictures completed with instructions where the weight of the food was defined in proportion to the models/pictures. These models and matching instructions were borrowed from The National Food Agency in Denmark. We made models for Faroese food items as needed. First visit: 24 h recall, starting with first item consumed the previous day and during the next 24 hours in the order of time of consumption, what was consumed and how much according to the food models. Then the Food Frequency Questionaire (FFQ) was answered and the questionnaire on general questions. Sheets for Food Diary (FD) for 3 days were handed out with a detailed explanation about recording everything consumed during the days agreed upon. We included always one weekend in the FD. Second visit: 24 h recall questionnaire performed as at the first visit. The FD recording was checked with the subjects using the models to quantify the consumption. FD-recording sheets for three more days were handed out. Third visit: 24 h recall questionaire performed and the Food Diary checked with the subjects. All together there were obtained 409 24h recall interviews from the 148 women (116 did all three interviews, 29 two interviews and 3 women only one interview). The main reason for not doing all three interviews was delivery and scheduling difficulties. In total 732 FD recordings were collected (in average five FD‘s per woman. The reasons for not doing all six were mainly delivery and lack of motivation. Altogether this totals 1,141 recordings. Before the data collection started we completed 17 interviews as pilot tests covering all parts of our concept, equally divided between the interviewers and mutually observed. During the collection period we tried to keep the participants separate so that the interviewer who started also finished each participant, but for different reasons this was not possible for all women. A total of 97 women only had one interwiever as intended and 51 saw both interviewers during the data collection phase. 26 times the interviewers supervised each other, and weekly meetings ensured continuity of data quality. After each home visit all food items were estimated according to the models and recorded with name of item and matching weight on a sheet designed for this purpose. When all data collection was done the clinical dietician reviewed all 1,141 recordings to confirm all data and ensured consistency. Data entering: After confirming of all the data two assistants were reading while the interviewers keyed in all the data. For data entering we used the dietary evaluation soft-ware Dankost 3000. The calculation is based on Atwater. This program calculates the macro- and micronutrients. Food items, which did not exist in Dankost 3000 beforehand, were entered form Faroese- and Icelandic food records. For some food items we used the declaration on the package. For many of the items entered the only available information was the macronutrients and a few micronutrients. In some cases, mostly sweets with no declaration on the package, the clinical dietician decided which food item with known values came the closest. For statistical purposes data were exported to ACCESS and SPSS. 6.3.2 Results6.3.2.1 Lifestyle factors among 165 pregnant women according to the food frequency questionnaire (AMAP questionnaire), administered by the interviewers: Sample caracteristics:
Smoking:
Alcohol Consumption in Pregnancy:
Pilot whale for dinner in average during the last 12 months:
Ocean fish for dinner in average during the last 12 months:
Birds for dinner in average during the last 12 months:
6.3.2.2 Characteristics of the diet based on calculations of the 409 24-h recall interviews and the 732 food diary recordings:
The dietary intake of pilot whale meat and blubber is remarkably low compared with the last dietary survey in 1981-82, where the average consumption of pilot whale meat among adult men and women was 12 grams per day and of blubber 7 grams. This reduction is most likely to be a result of the recommendations to pregnant women to avoid contaminated seafood, such as pilot whale meat and blubber. 6.3.2.3 Contaminants in the blood of the mothers in 38th week. Mean Concentrations of Organochlorines in Maternal Blood Serum - Wet Weight Basis (means, ug/l)
Mean Concentrations of Metals in Maternal Blood, Whole Weight Basis (means ug/l)
6.3.3 Discussion:The PCB concentrations are elevated, as seen in other studies among pregnant women in the Faroes. In 1994 the sum of PCBs (geometric mean of (PCB 138+153+180) * 2 was 1.12 µg/g lipid. The corresponding value from this study is 0.94 µg/g lipid. The reduction of PCB‘s in pregnant women is moderate compared to reduction of mercury, which is dramatic. Cord blood mercury concentrations in 1,023 births in 1986/87 was 24,2 µg/l (median). In this study the median is only 1,4 µg/l. The results from the dietary survey showed a very significant reduction in whale meat and blubber intake, and blood analysis shows a corresponding reduction in the mercury exposure. However, the PCB levels are still high and must be considered to be a potential health problem in the Faroese community. According to the dietary survey the daily intake of both whale meat and whale blubber has been reduced up to one order of magnitude. However, the concentration of organochlorines has not declined to the same extent as the mercury, indicating that organochlorines can have other significant sources, e.g. seabirds. The longer half-life of most of some organochlorines compared to methylmercury may be too be an explanation of this observation. 6.4 Exposure to Seafood Contaminants and Immune Response in Faroese ChildrenFrom the fall of 2000 the youngest subset of Cohort 3 (N = 130) was invited for a check-up before and after the scheduled childhood vaccination at age 12 months. All infants had followed the normal vaccination program for Danish and Faroese children and were vaccinated with tetanus toxoid (TT), diphtheria toxoid (DT), pertussis toxin (acellular pertussis antigen), polio (inactivated polio virus I, II and III) mixed in one syringe, and Haemophilus influenzae type b polysaccharide (HibCP) conjugated to TT (ActHib®) in another. Vaccinations were given approximately at the ages of 3 months, 5 months and 12 months. Serum antibody concentrations against TT, DT and HibCP were determined at the State Serum Institute in Copenhagen, which also produced the vaccines and delivered ActHib (from Avantis Pasteur). TT and DT are classical protein antigens depending on a T-cell help for both primary and recall antibody responses (T-cell dependent antigens). In contrast, as a polysaccharide antigen coupled to a protein carrier (TT), HibCP relies on T-cell function for the primary activation of naive B-cells in infants, while boosting of the response in connection with subsequent vaccination can be elicited by the capsular polysaccharide alone (T-independent activation). The results of this study will be available in the near future. 6.5 Exposure to mercury and organochlorines 1985-2001.6.5.1 IntroductionSeveral large studies have taken place in the Faroe Islands (table 6.5.1) to examine the effects of contaminated seafood on pregnancy outcome and neurodevelopment. A total of five cohorts with 2,400 persons were generated. Exposure data obtained in these studies are collected in this section in a way to provide the best possible basis for comparison of exposure levels of the different groups during the 15-year period. A summary of the most important characteristics of the study cohorts can be found in table 19 in this section (Description of study populations). The exposure variables are listed in the following paragraphs. Table 6.5.1 List of studies
6.5.2 Mercury in maternal bloodAnalyses of total and inorganic mercury in whole blood and serum in the 53 women living in Leirvík of the pilot study in 1985 resulted in the following values (Grandjean et al., 1992): Table 6.5.2
Inorganic mercury represented an average of 11.0 ± 1.85% of the total mercury concentration (Grandjean et al., 1992). In the following cohort, mercury in maternal hair and in umbilical cord blood were used as biomarker for the exposure during pregnancy. 6.5.3 Mercury in maternal hair samplesThe geometric average hair-mercury concentration in 1,020 Faroese women from Cohort 1 (children born in 1986/1987) was 4.5 µg/g, with 130 samples (12.7%) above 10 µg/g (50 nmol/g). Five samples (0.5%) exceeded 25 µg/g (125 nmol/g). The maximum was 39.1 µg/g (195 nmol/g). Only 5% of the Faroese women from Cohort 1 had hair-mercury concentrations below 1 µg/g. Compared to Cohort I, a slightly lower mercury concentration was found in Cohort 2, with a geometric mean of 4.1 µg/g. Fifteen hair samples (10.4%) exceeded a mercury concentration of 10 µg/g (Steuerwald et al., 2000). The most recently established cohort (cohort 3) showed a geometric mean for mercury in maternal hair of 2.2 µg/g. In this cohort, which was created in the years 1998 to 2000, only 2.4% (15 of 617) had a mercury concentration above 10 µg/g while in 17.7% (109/617) the concentration was below 1 µg/g (See section 6.2.). Table 6.5.3 Mercury in maternal hair
6.5.4 Mercury in umbilical cord bloodIn cohort 1, the geometric mean for the mercury concentration in umbilical cord blood was 24.2 µg /L. 250 of the 1,023 samples (25.1%) had a blood-mercury concentration that exceeded 40 µg /L (200 nmol/L). Twenty samples (2.0%) exeeded 100 µg /L (500 nmol/L) (Grandjean et al., 1992). The highest level that was measured for this cohort was 351 µg /L (1,755 nmol/L) (Weihe et al., 1996). Again, the concentrations measured in cohort 2, which was established eight years after cohort 1, were slightly lower: the geometric mean for mercury in cord blood reached 20.4 µg /L (Steuerwald et al., 2000). Table 6.5.4 Mercury in umbilical cord blood (µg/L)
Cord blood mercury concentrations from cohort 3 are being analyzed and are not yet available for reporting. For comparison the total mercury concentration in 124 pregnant women in 38th week was only 1,26 microgram/l in Cohort 4 (see section 6.3. in this report). For comparison, mercury concentrations in cord blood are usually about 25-50% higher than in maternal blood. 6.5.5 Mercury in breast milkDuring a one-month period (Grandjean et al., 1992) 88 samples of transition milk were collected from mothers from Cohort 1. Total mercury concentration was between 1 and 4 µg /L for most of the samples with a median of 2.45 µg/L and a maximum of 8.7 µg /L (Grandjean et al., 1995). No further results of mercury in breast milk are available, but the results suggest that human milk may contribute an important exposure source. 6.5.6 MeHg in hair in childrenOf about half of the cohort 1-children (583 children or 57.0%) a hair sample of at least 100 mg could be obtained at the age of about 12 months (Grandjean et al., 1994). A second sample of the children was collected when they were 7 years old. At that age the geometric mean for methylmercury was nearly threefold the concentration found at the age of one year (Grandjean et al., 1999). Table 6.5.5 Methylmercury in children’s hair at different ages (in µg/g)
6.5.7 Mercury in children at age 7 yearsIn 672 children out of the 1,024 children of cohort 1, a blood sample was analyzed at 7 years. The geometric mean for mercury was 8.82 µg /L with an interquartile range of 4.8 to 18.2 µg /L (Grandjean et al., 1999). Children from cohort 2 have just reached 7 years, and blood samples are being collected. However, no comparable data for this age group are available at the moment. 6.5.8 PCB in maternal serumMaternal serum was collected at week 32 of pregnancy for cohort 2 and at week 34 – 36 for cohort 3. In cohort 2, the geometric mean of SPCB (sum of 28 PCB congeners, namely IUPAC nos. 28, 52, 56, 66, 74, 99, 101, 105, 110, 118, 138, 146, 153, 156, 170, 172, 177, 178, 180, 183, 189, 193, 194, 195, 201, 203, and 206) was 0.86 µg/g lipid (Grandjean et al., 2001). Results of the analysis of the samples collected for cohort 3 are not available yet. Table 6.5.6 Sum of PCB in maternal serum
6.5.9 PCB in cord bloodFor cohort 2 cord blood values of SPCB are available, but not for the other cohorts. Results are not published. But the relation between lipid-based PCB values in maternal and cord serum samples is about 1:1 (Steuerwald et al., 2000). Thus the magnitude of the values in cord blood can be estimated when using the numbers given in table 5. In Cohort 1, instead of cord blood, 435 umbilical cords were examined for their PCB content. The mean of the measured sum of PCB (calculated as twice the sum of congeners 138, 153, and 180) was 1.12 ng/g wet weight with an interquartile range of 0.57 to 1.55 ng/g. The lipid content of the tissue showed an average of 2.2 mg/g (Grandjean et al., 1997). 6.5.10 PCB in breast milkFour pooled samples collected while establishing cohort 1 in 1987 showed a total PCB concentrations of 1.9 to 3.5 µg/g lipid (Grandjean et al., 1995). PCB in breast milk from day 4-5 in cohort 2 reached a geometric mean of 1.52 µg/g (total range 0.07-18.5 µg/g) (Steuerwald et al., 2000). The lipid-based concentrations of PCB in maternal serum were closely associated with those of the corresponding milk sample (r=0.92). The concentrations in transitional milk were generally higher than in maternal serum with the milk/serum ratio being 1.44 (Winnecke, 1999). However, note must be taken that milk analysis results were recovery-adjusted, but serum results were not (average recovering of PCB confiners was about 65%). Table 6.5.7 PCB in breast milk
Table 6.5.8 Specific PCB-congeners in breast milk of Faroese mothers (µg/g lipid)
6.5.11 Lead in cord bloodLead in cord blood was measured in cohort 1; the median of 1015 samples was 82 nmol/L with P25 at 58 nmol/L and P75 at 106 nmol/L. In the 52 women of the pilot study, whole blood lead was measured with a median of 96 nmol/L (range 39 – 174 nmol/L (Grandjean et al., 1992). 6.5.12 SeleniumBlood selenium was analyzed in 1020 cord blood samples of cohort 1. The median was 1.4 µmol/L (110 µg /L) with P25 of 1.27 µmol/L and P75 of 1.55 µmol/L (Grandjean et al., 1992). 84 transition milk samples were analyzed for their selenium content. The concentrations ranged between 6.7 and 38 µg /L with a mean of 19.1 µg /L (Grandjean et al., 1995). In cohort 2, the mean of cord blood selenium was 1.31 µmol/L (103.4 µg /L) with a standard deviation of 0.18 µmol/L (14.2 µg /L) (Grandjean et al., 2001). 6.5.13 Other contaminants in maternal serumTable 6.5.9 Other contaminants in maternal serum of Faroese mothers (µg/g lipid)
Table 6.5.10 Mean concentrations of other organochlorines and persistent pesticides in breast milk of Faroese mothers (µg/kg lipid)
In cohort 2, the range of p,p’-DDT was 0.05 – 13.7 µg/g lipid, P25 and P75 reached 0.49 respective 1.55 µg/g lipid (Steuerwald et al., 2000). 6.5.15 Contamination levels in two consecutive pregnanciesIt was possible to compare exposure data in two following pregnancies for few mothers in cohort 2: 10 women provided two children from two different pregnancies to the cohort. Birth weight, length at birth and head circumference, length of gestation and maternal pre-pregnancy BMI and weight gain during pregnancy did not differ significantly between the group of earlier and later born infants. Four boys and six girls resulted from the earlier pregnancy, the distribution of gender for the next parity was converted: six boys and four girls. For nine of the mothers two samples of hair were collected and analyzed for methylmercury. The interval between the first and the second samples ranged from 13 to 23 months (average of 18.8 months). The mean of mercury concentration in the second samples was lower but the difference was not significant. If the values measured in the individual mothers in connection with the earlier and the later pregnancy were compared, in three of them a slightly higher value was found in the second samples. The differences between the first and the second sample were 27.3%, 9.6%, and 1.7%. The decrease in the remaining six sample pairs were 30.3%, 48,5%, 70.1%, 70.7%, 71.0%, and 73.8%. For analysis of organochlorines one earlier sample of breast milk was missing, thus giving the possibility to compare two milk samples of 9 mothers. The means for the different organochlorines as well as for all the PCB-congeners were lower in the following pregnancy. But none of the differences was significant. When looking at the individual mothers, musk xylene increased in four mothers, PCB 138 in three mothers, b-HCH, PCB 180, and trans-nonachlor in two, HCB and SPCB in one. All other contaminants were lower or at the same concentration in the following pregnancy. This observation finds to the observations of other authors who reported lower values of contamination in the following pregnancy. 6.5.16 Influence of dietary recommendationAfter the results of the earlier studies became available, new recommendations for consumption of whale products were published by the health authorities (Heilsufrøðiliða Starvsstovan, 1998). To examine the effects of the new recommendations, a questionnaire was sent out to all women residing in the Faroe Islands, aged 26 to 30 years. They were asked about their dietary habits. Those who wanted to could send a sample of hair to be analyzed for mercury. One year later all women were contacted again with the offer to send a new hair sample for analyses. 45.7% of questionnaires could be used for statistical analyses. 370 single hair samples were available taken either after the first or after the second letter. 146 women provided two hair samples. The geometric mean methylmercury in the first samples was 2.57 µg/g (arithmetical mean 3.54 µg/g with a standard deviation of 2.90 µg/g). In the second sample the results were 1.83 µg/g (2.56 µg/g ± 2.22 µg/g). The difference between the two concentrations is highly significant (Man-Withney U-test: p<0.001; CI95 0.52 – 1.44) (see section 6.3 in this report). 6.5.17 Diet during pregnancyData or dietary habits during pregnancy were obtained from the cohorts (table 6.5.10). In Cohort 2, about 60% og the women had whale meat for dinner, and slightly more than one-half had whale blubber, for dinner at least once per month; Most women (147 or 82.6%) had not changed their dietary habits in this regard during the pregnancy (Grandjean et al., 2001). Table 6.5.11 Dietary habits during pregnancy
Unfortunately the questionnaire about the dietary habits during pregnancy differed slightly. Therefore, it is not clear how far the number really represent the same consumption. In the second cohort, the majority of the participating women resided outside of the capital Tórshavn and it suburbs. The availability of whale meat and blubber was higher in the small villages. Thus lower percentages of mothers who reported no or only few dinners with whale products might not only be caused by the awareness of the women of the potential endangerment related to food and the new recommendation from the national health authorities. The reduced access to whale products might also be have caused lower numbers. 6.5.18 Comparison of contamination in Faroese and non-Faroese mothersWhen comparing exposure data of Faroese (N=562) and non-Faroese (N=21) women participating in cohort 3 it was found that the level of all contaminants are higher in Faroese mothers except for b-HCH. The difference is highly significant for all measured PCB-congeners and trans-nonachlor. Arithmetic means in Faroese mothers are 1.3-fold to 4.2-fold the means of non-Faroese mothers. b-HCH was twice the value in non-Faroese mothers than in Faroese mothers, the level of significance for the difference was 0.069 (see section 6.2 in this report). 6.5.19 Description of study populations
6.6 AcknowledgementWe are grateful to the cohort families for their loyal support, to professor Philppe Grandjean for valuable advice and support, and to the competent staff at the Department of Occupational and Public Health, especially secretary Elsa Olsen, nurse Mari Ann Ellendersen, laboratory technician Marita Arge Magnussen and clerk Ronny Jacobsen for their managment of the projects. 6.7 ReferencesArtic Monitoring and Assessment Programme (AMAP). Artic pollution issues: a state of arctic environment report. Oslo, Norway: AMAP, 1997. Ashby JR, Craig PJ. Organometallic compounds in the environment. In: Harrison RM, ed. Pollution: Causes, effects and control. Cambridge: Royal Society of Chemistry, 1990: 309-42. Brock J, Burse VW, Ashley DL, Najam AR, Green VE, Korver MP et al. An improved analysis for chlorinated pesticides and polychlorinated biphenyls (PCBs) in human and bovine sera using solid-phase extraction. J Anal Toxicol 1996; 20: 528-36. Brouwer A, Ahlborg UG, Van den Berg M, Birnbaum LS, Boersma ER, Bosveld B et al. Functional aspects of developmental toxicity of polyhalogenated aromatic hydrocarbons in experimental animals and human infants. Eur J Pharmacol 1995; 293: 1-40. Centers of Disease Control and Prevention. Blood and Hair Mercury Levels in Young Children and Women of Childbearing Age - United States, 1999. Morb Mort Wkly Rep MMWR 2001; 50 (8) (online version). Committee on Hormonally Active Agents in the Environment, Board on Environmental Studies and Toxicology, Commission on Life Sciences, National Research Council. Hormonally active agents in the environment. Washington, DC: National Academy Press, 1999. Online version: (http://books.nap.edu/html/hormonal_agents/, accessed on May 4, 2001). Committee on the Toxicological Effects of Methylmercury, Board on Environmental Studies and Toxicology, Commission on Life Sciences, National Research Council. Toxicological effects of methylmercury. Washington, DC: National Academy Press, 2000. Online-version: (http://books.nap.edu/books/0309071402/html, accessed on April 30, 2001). Dewailly E, Ayotte P, Laliberte C, Weber JP, Gingras S, Nantel AJ. Polychlorinated biphenyl (PCB) and dichlorodiphenyl dichloroethylene (DDE) concentrations in the breast milk of women in Quebec. Am J Public Health 1996; 8: 1241-6. Dewailly E, Dodin S, Verreault R, Ayotte P, Sauve L, Morin J et al. High organochlorine body burden in women with estrogen receptor-positive breast cancer. J Natl Cancer Inst 1994; 86: 232-4. Dunn JD, Clarkson TW, Magos L. Interaction of ethanol and inorganic mercury: generation of mercury vapour in vivo. J Pharmacol Exp Ther 1981; 216: 19-23. Fein GG, Jacobson JL, Jacobson SW, Schwartz PM, Dowler JK. Prenatal exposure to polychlorinated biphenyls: effects on birth size and gestational age. J Pediatr 1984; 105: 315-20. Grandjean P, Bjerve KS, Weihe P, Steuerwald U. Birthweight in a fishing community: significance of essential fatty acids and marine food contaminants. Int J Epidemiol 2001; 30: 1272-8. Grandjean P, Budtz-Jørgensen E, White RF, Jørgensen PJ, Weihe P, Debes F, Keiding N. Methylmercury exposure biomarkers as indicators of neurotoxicity in children aged 7 years. Am J Epidemiol 1999; 150(3): 301-5. Grandjean P, Jørgensen PJ, Weihe P. Human milk as a source of methylmercury exposure in infants. Enivon Health Perspect 1994; 102(1): 74-7. Grandjean P, Weihe P, Jørgensen PJ, Clarkson T, Cernichiari E, Viderø T. Impact of maternal seafood diet on fetal exposure to mercury, selenium, and lead. Arch Environ Health 1992; 47(3): 185-95. Grandjean P, Weihe P, Needham LL, Burse VW, Patterson DG, Sampson JrEJ, Jørgensen PJ, Vahter M. Relation of a seafood diet to mercury, selenium, arsenic, and polychlorinated biphenyl and other organochlorine concentrations in human milk. Environ Res 1995; 71: 29-38. Grandjean P, Weihe P, White RF, Debes F, Araki S, Murata K et al. Cognitive deficit in 7-year-old children with prenatal exposure to methylmercury. Neurotoxicol Teratol 1997; 19(6): 417-28. Harada M. Minamata disease: methylmercury poisoning in Japan caused by environmental pollution. Crit Rev Toxicol 1995; 25: 1-25. Heilsufrøðiliga Starvsstovan, Landslæknin og Deildin fyri Arbeiðs- og Almannaheilsu [Hygienic Institute, Chief Medical Officer, and Department for Occupational and Public Health]. Kosttilmæli um grind [Dietary recommendations about pilot whale consumption]. Tórshavn, Faroe Islands: Heilsufrøðiliga Starvsstovan, 1998. Huisman M, Koopman-Esseboom C, Fidler V, Hadders-Algra M, Paaw-vd CG, Tuinstra LGMT et al. Perinatal exposure to polychlorinated biphenyls and dioxins and its effect on neonatal neurological development. Early Hum Dev 1995; 41; 111-27. Institut für Wasser-, Boden- und Lufthygiene des Bundesumweltames, Kommission “Human-Biomonitoring” des Umweltbundesamtes – Berlin [Institute for the quality of water, soil, and air of the Federal Agency for the Environment, committee “Human-Biomonitoring” - Berlin]. Referenzwerte für HCB, b-HCH, DDT und PCB in Frauenmilch [Reference values for HCB, b-HCH, DDT, and PCB in human breast milk]. Bundesgesundbl 1999; 42: 533-9. Jacobson JL, Jacobson SW, Humphrey HEB. Effects of in utero exposure to polychlorinated biphenyls and related contaminants on cognitive functioning in young children. J Pediatr 1990; 116: 38-45. Kafferlein HU, Goen T, Angerer J. Musk xylene: analysis, occurence, kinetics, and toxicology. Crit Rev Toxicol 1998; 28; 431-76. Lackmann GM, Angerer J, Töllner U. Parental smoking and neonatal serum levels of polychlorinated biphenyls and hexachlorobenzene. Pediatr Res 2000; 47: 598-601. Mersch-Sundermann V, Reinhardt A, Emig M. Untersuchungen zur Mutagenität, Genotoxizität und Kogenotoxizität umweltrelevanter Nitromoschusverbindungen [Mutagenicity, genotoxicity, and cogenotoxicity of environmental relevant nitro musk compounds] (in German). Zentralbl Hyg Umweltmed 1996; 198: 429-42. Mocarelli P, Brambilla P et al. Change in sex ratio with exposure to dioxin. Lancet 1996; 348: 409. Olsen SF, Joensen HD. High liveborn birthweights in the Faroes: a comparison between birthweights in the Faroes and in Denmark. J Epidemiol Community Health 1985; 39: 27-32. Patandin S, Koopman-Esseboom C, de Ridder MAJ, Weisglas-Kuperus N, Sauer PJJ. Effects of environmental exposure to polychlorinated biphenyls and dioxins on birth size and growth in Dutch children. Pediatr Res 1998; 44: 538-45. Poland A, Knutson JC. 2,3,7,8-tetrachlorodibenzo-p-dioxin and related halogenated aromatic hydrocarbons: examination of the mechanism of toxicity. Ann Rev Pharmacol Toxicol 1982; 22: 517-54. Porterfield SP. Thyroidal dysfunction and environmental chemicals – potential impact on brain development. Environ Health Perspect 2000; 108 (Suppl 3): 433-8. Prechtl HFR. The neurological examination in the full-term newborn infant. 2nd ed. Clinics in Developmental Medicine, No. 63. SIMP. London: Heinemann, 1977. Prechtl HFR. The optimality concept. Early Hum Dev 1980; 4: 201-5. Rogan WJ, Gladen BC, McKinney JD, Carreras N, Hardy P, Thullen J et al. Neonatal effects of transplacental exposure to PCBs and DDE. J Pediatr 1986; 109: 335-41. Schade G, Heinzow B. Organochlorine pesticides and polychlorinated biphenyls in human milk of mothers living in Northern Germany: current extent of contamination, time trend from 1986 to 1997, and factors that influence the levels of contamination. Sci Total Environ 1998; 215: 31-9. Seegal RF, Shain W. Neurotoxicity of polychlorinated biphenyls: The role of ortho-substituted congeners in altering neurochemical function. In: Isaacson RL, Jensen KF (eds.): The vulnerable brain and environmental risks. New York: Plenum Press, 1992: 169-95. Sørensen N, Murata K, Budtz-Jørgensen E, Weihe P, Grandjean P. Prenatal methylmercury exposure as a cardiovascular risk factor at seven years of age. Epidemiology 1999; 10: 370-5. Steuerwald U, Weihe P, Jørgensen PJ, Bjerve K, Brock J, Heinzow B et al. Maternal seafood diet, methylmercury exposure, and neonatal neurological function. J Pediatr 2000; 136: 599-605. Toppari J, Larsen JC, Christiansen P, Giwercman A, Grandjean P, Guillette LJ et al. Male reproductive health and environmental xenoestrogens. Environ Health Perspect 1996; 104 (Suppl 4): 741-803. Touwen BCL, Huisjes HJ, Jurgens-vdZee AD, Bierman-van Eendenburg MEC, Smrkovsky M, Olinga AA. Obstetrical condition and neonatal neurological morbidity. An analysis with the help of the optimality concept. Early Hum Dev 1980; 4: 207-28. Tryphonas H. The impact of PCBs and dioxins on children‘s health: immunological considerations. Can J Public Health 1998; 89 (Suppl 1): 49-52. Vartiainen T, Jaakola JJK, Saarikoski S, Tuomisto J. Birth weight and sex of children and the correlation to the body burden of PCDDs/PCDFs and PCBs of the mother. Environ Health Perspect 1998; 106: 61-6. Weihe P, Grandjean P, Debes F, White R. Health implications for Faroe Islanders of heavy metals and PCBs from pilot whales. Sci Total Environ 1996; 186: 141-8. Winnecke G (scientific coordinator) 1999. Neonatal PCB-exposure and neurodevelopmental deficit: inclusion of a high risk cohort to supplement ongoing neuropaediatric studies. Medical Institute for Environmental Medicine at the Heinrich-Heine-University, Düsseldorf, Germany. Study report. World Health Organisation (WHO). International Programme on Chemical Safety. Methylmercury. Environmental Health Criteria 101. Geneva: WHO, 1990. |