Environmental Project No. 1323, 2010
The Greenhouse gases: HFCs, PFCs and SF6
- Danish consumption and emissions, 2008
Contents
Appendix 1: GWP values for F-gases
Appendix 2: GWP contribution from HFCs, PFCs, and SF6, 1993-2020.
Appendix 3: Specification of methods and assumptions for emission calculation
Appendix 4: Assessment of Good Practice Guidance compliance in DK F-gas calculation 2008
Preface
On behalf of the Danish Environmental Protection Agency (Danish EPA), the consulting firm PlanMiljø ApS carried out the emission calculation of Danish emission of F-gases, 2008. The emission calculation is carried out in continuation of previous years emission calculations /27/ and references herein.
The F-gas emission calculation and reporting is assessed by Danish EPA and National Environmental Research Institute, Denmark (NERI) and the consultant. Further the draft report is send to central stakeholders for comments and general information.
The assessment group consisted of:
- Mikkel Aamand Sørensen, Danish EPA
- Erik Lyck, Danish National Environmental Research Institute (NERI), University of Aarhus
- Tomas Sander Poulsen, PlanMiljø ApS
Other central stakeholders, who are invited to comment the report:
- Torkil Høft, KMO
- Sven-Erik Jepsen, Confederation of Danish Industries (DI)
The objective of this project was to determine the Danish consumption and actual emissions of HFCs, PFCs, and SF6 for 2008. Further, if methodology changes are made in connection to the work on 2008 data, the data for previous years are considered and updated accordingly.
The emission calculation is partly prepared to enable Denmark to fulfil its international obligations to provide data and information on F-gas emissions, and partly to follow the Danish trend in consumption and emissions of HFCs, PFCs, and SF6. Examples of reporting of Danish emissions is given in reference /18, 19, 21, 23, 24, 26/, and most recently, in reference /28/.
Greenhouse gases cause an increase in the ability of the atmosphere to retain surplus heat radiated from the earth. Consequently the temperature of the earth’s surface and lower atmosphere is rising and this leads to climate changes. There are several ozone-depleting substances that also have a strong greenhouse effect. These substances are regulated under the Montreal Protocol.
The potential effect of different greenhouse gases varies from substance to substance. This potential is expressed by a GWP value (Global Warming Potential). The so-called F-gases (HFCs, PFCs and SF6) that do not have an ozone-depleting effect, but which have high GWP values are regulated by the Kyoto Protocol under the United Nation Climate Change Convention.
The Danish EPA has published a booklet on the ozone layer and the greenhouse effect /5/, and the Danish EPA has also published a report on substituting the greenhouse gases HFCs, PFCs and SF6 /10/.
1 Summary
1.1 Danish consumption and emission of F-gases
1.1.1 Consumption
HFCs
In 2008, the total import (minus re-export) of pure HFCs and HFC blends was estimated to 399.4 tonnes. Compared to 2007, where total import was 403.2 tonnes, the import has decreased with 3.8 tonnes.
The 2008 import of HFC-134a increased slightly with 3.8 tonnes compared to 2007 with a total consumption of 164.5 tonnes. The consumption is a bit higher within production of household fridge and freezers in 2008 compared to 2007 and the consumption related to commercial refrigerants has a small reduction.
The import of HFC-404A is reduced with 15.8 tonnes compared with 2007. The total consumption is 114.1 tonnes in 2008. The reduction is coursed by reduction of consumption in commercial refrigeration system.
Import of HFC-407c increased with 26.3 tonnes to 76.8 tonnes in 2008. HFC-407c is a substitute refrigerant for HCFC-22 in refrigerators. Over the last decade there has been an overall increase in import of HFC-407c but the development in consumption has not been stabile and some of the increase can be caused by a number of older refrigeration systems with HCFC-22 are phased out.
There has been no clear reduction in consumption of main refrigerants in 2008 (HFC-134a, HFC-404A and HFC-407c).
SF6
The overall consumption of SF6 in 2008 was approx. 5.9 tonnes. Consumption of SF6 was used for power switches in high-voltage power systems and laboratories. This is a small increase compared with 2007.
PFCs
The Danish consumption of PFCs (per fluoropropane) in 2008 was 0.5 tonnes. The PFC consumption in 2008 derives from to areas:
- optics fibre production
- refrigerants in commercial refrigeration
1.1.2 Emission
The GWP-weighted actual emissions of HFCs, PFCs, and SF6 in 2008 were 895.7 thousand tonnes CO2 equivalents and the emission has increased compared to 2007, where the corresponding emissions were 884.4 thousand tonnes CO2 equivalents as reported in /27/. A new source – Medical Dose Inhalotors - was introduced in the F-gas inventory. Comparing the new time series in this report the 2007 value is 894.3, so the 2008 value is a very little increase only.
The total emission in 2008 has increased for HFCs but decreased for PFCs. The emission of SF6 is increased a little since 2007.
The increase in emissions for HFCs is in particular occurring from increased emissions of HFC-404A and increased emissions of HFC-134a from stock in commercial refrigerants.
In Table 1.1, consumption, actual emissions and stock in products are summarised.
In Figure 1.1, the relative contributions of HFCs, PFCs, and SF6 to the total emission in CO2-equivalents are shown for application areas for 2008.
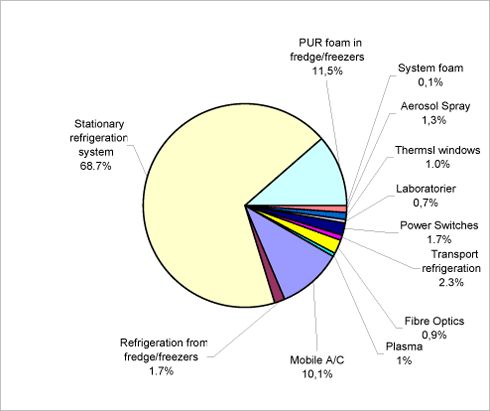
Figure 1.1 The relative distribution of GWP emissions, analysed by application area, 2008
The figure shows that emissions from refrigerants used in commercial stationary refrigerators account for the largest GWP contribution. These refrigerators cover 68.7 per cent of the total actual contribution in 2008. The major contribution is from HFC-404A.
The second-largest GWP contribution, accounting for 11.5 per cent, is emission from release of HFC-134a stock in insulating foam in fridges and freezers.
Emissions of HFC-134a from mobile A/C contribute with 10.1 per cent and emissions of HFC-134a and HFC-404A from transport refrigeration contribute with 2.3 per cent of the total GWP contribution.
The three sources of SF6 emissions in 2008 were power switches, double glazing windows and laboratories/fibre optics. These account for 3.3 per cent of the total GWP contribution.
HFCs contribution is estimated to comprise 94.9 per cent of the overall GWP contribution in 2008, Emissions of SF6 comprise 3.5 per cent and emissions of PFC contribute with 1.5 per cent of the total emission.
The relative distribution is shown in Figure 1.2.
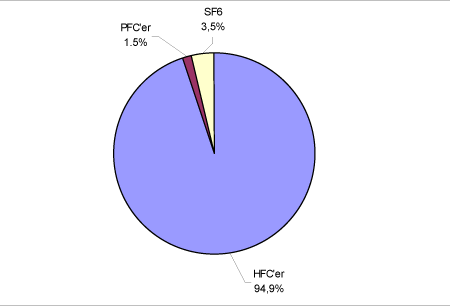
Figure 1.2 The relative distribution of the GWP contribution from HFCs, PFCs, and SF6, 2008.
HFC’s
Actual emissions from HFCs have been calculated to 851 373 tonnes CO2 equivalents. In 2007, emissions were 838 724 tonnes CO2 equivalents, refer /27/. It is an increase of approx. 12 650 tonnes CO2 equivalents.
The actual emission from HFCs has increased to its highest level since HFCs has been monitored.
SF6
Actual emissions have been calculated at 1.3 tonnes, equivalent to a GWP contribution of 31 599 tonnes CO2 equivalents. In 2007, emissions were
30 347 tonnes CO2 equivalents, refer /27/.
PFCs
The emission of PFCs origins from PFCs in production of fibre optics and stock emission from commercial refrigeration containing HFC-413A. The total GWP-weighted PFC emission is 12 791 tonnes CO2 equivalents.
1.1.3 Trends in total GWP contribution from F-gases
Figure 1.3 shows the trend in Danish GWP contributions from HFCs, PFCs, and SF6 for 1992-2008. The differences from the present calculations of the total GWP value compared with earlier calculation methods are illustrated in the figure.

Figure 1.3 Trends in GWP-weighted potential, actual and adjusted actual emissions 1992-2008, 1.000 tonnes CO2 equivalents.
The figure shows that the GWP emission has continued the increase started in 2001 and reached the highest level for calculation of actual emissions. The increase curve from 2007 to 2008 is stagnant and the smallest yearly increase since 2001.
The development in the GWP contribution 1992-2008 can also be seen in Table 1.2 below. A new source is added in the 2008 emission calculation. The new source is MDI, which contain an increasing amounts of HFC-134a as blowing agent.
| Potential | Actual | Actual, adjusted imp/exp. |
New actual, adjusted imp/exp. |
New Actual adjusted imp/exp. Including new source |
|
|---|---|---|---|---|---|
| 1992 | 400 | ||||
| 1993 | 800 | 230 | |||
| 1994 | 1300 | 263 | |||
| 1995 | 1600 | 480 | 344 | ||
| 1996 | 1700 | 520 | 435 | ||
| 1997 | 1700 | 560 | 472 | ||
| 1998 | 625 | 577 | 564 | ||
| 1999 | 700 | 683 | |||
| 2000 | 818 | 793 | |||
| 2001 | 699 | ||||
| 2002 | 719 | ||||
| 2003 | 745 | ||||
| 2004 | 797 | ||||
| 2005 | 829 | ||||
| 2006 | 865 | ||||
| 2007 | 884 | ||||
| 2008 | 886 | 896 |
2 Methodology
The emission calculation is made in accordance with the IPCC guidelines (Intergovernmental Panel on Climate Change) /4/, and following the method employed in previous years calculations.
The methodology includes calculation of the actual emissions of HFCs, PFCs, and SF6. In this calculation of actual emissions, the release from stock of greenhouse gases in equipment and in products has been taken into account, and adjustments have been made for imports and exports of the greenhouse gases in products. Appendix 4 describes the specific emission factors, etc.
2.1 Scope and definition
The emission calculation of the actual emissions of HFCs, PFCs and SF6 has over years become increasingly more comprehensive and accurate along with the development of internationally approved guidelines (IPCC Guidelines) and guidance (IPCC Good Practice Guidance) and the provision of increasingly detailed data.
The evaluation of the actual emissions includes quantification and calculation of any imports and exports of HFCs, PFCs, and SF6 in products, and it includes substances in stock. This is in accordance with the latest and most accurate method of calculation (Tier 2) among the options provided for in the IPCC Guidelines /4/.
Estimation of Consumption and emissions
The calculation of consumption, emissions and stock were carried out on the basis of information from six sources:
- Importers, agency enterprises, wholesalers, and suppliers
- Consuming enterprises, and trade and industry associations
- Recycling enterprises and chemical waste recycling plants
- Danish Environmental Protection Agency
- KMO, the Danish Refrigeration Installers’ Environmental Scheme
- Previous evaluations of HFCs, PFCs and SF6 /2, 11, 13, 16, 25/.
Basis information for the present emission calculation is collected through questionnaire surveys combined with follow up telephone interviews.
The result of the project is primarily based on the information received from enterprise and importer respondents and information from KMO and Danish EPA is used as a supplement to verify parts of the collected data.
The information collected from importers and suppliers is compared with information from consumer enterprises in order to monitor any discrepancies between purchase and sales information and to identify application of the use of substances. In some cases, the use of individual substances was estimated on the basis of two sources, since the majority of the consuming enterprises were known. In cases where not all enterprise end-users had specified the application area for substances, the consumption of individual substances was estimated on the basis of the information provided by importers, suppliers, and any trade and industry-related associations, such as KMO.
There may be inconsistencies between the information provided by suppliers and enterprise end-users. This is partly due to imports from other EU countries, changes in inventories of substances, or a lack of correlation between the quantities sold and the quantities consumed. It is also partly due to a certain amount of uncertainty in the method of calculation used by enterprises. However, sales and consumption information has been harmonised.
The estimated average degree of uncertainty in the report's consumption figures (quantities sold and bought) is about 10-15 per cent, and slightly greater for data regarding application areas. The degree of uncertainty in the calculation of actual emissions is estimated at 20-25 per cent, depending on import/export information for the specific products.
The calculation of F-gas emission is based on a calculation of actual emissions.
Actual emissions are emissions in the relevant year, accounting for the time lapse between consumption and emissions. Actual emissions include Danish emissions from production, from products during their lifetimes, and from the disposal of products. Actual emissions for the specific areas of application are determined on basis of the following approaches:
Tier 2 “Top-down” analysis
In the Tier 2 Top-down analysis, emissions are determined on the basis of information on consumption in the various areas of application and calculated or estimated emissions in the area of application (emission factors).
Tier 2 “Bottom-up” analysis.
In the Bottom-up analysis, the estimated emissions for a specific application area are based on information from producers using substances in production and in products; information on imports and exports of products; information on the technological developments within the application areas; information on the average amount of greenhouse gases contained in products; and information on the lifetime of products and actual emissions during their use and disposal.
Tier 2 bottom-up analysis were carried out within selected areas over a number of years. The analysis quantified the stock and, in some cases, Danish emission factors. Detailed analysis were carried out for commercial refrigerators, mobile A/C systems, fridges, freezers, and SF6 power switches. Analysis were evaluated in separate reports /2, 11, 16/.
Bottom-up comprises:
- Screening of the market for products in which greenhouse gases are used.
- Defining the average content of greenhouse gases per product unit.
- Defining the lifetime and the disposal emissions of products.
- Identifying technological characteristics and trends of significance for emissions of greenhouse gases.
- Calculating imports and exports on the basis of defined key figures, Statistics Denmark's foreign trade statistics, and information from
relevant industries.
Results from this analysis have been expanded in the present evaluation of actual emissions.
As far as possible, the consumption and emissions of greenhouse gases have been evaluated individually, even though consumption of certain HFCs has been very limited. This was done to ensure transparency and consistency in time in the calculation of the sum of HFCs as their GWP value. However, it was necessary to operate with a category for "Other HFCs", as not all importers and suppliers have detailed records of sales of individual substances.
Uncertainty varies from substance to substance. Uncertainty is greatest for HFC-134a due to its widespread application in products imported and exported. The greatest uncertainty in the analysis of substances by application areas is assessed to concern the breakdown of consumption of HFC-404A and HFC-134a between commercial stationary refrigerators and mobile A/C systems. This breakdown is significant for the short-term (about 5 years) emissions calculations, but will balance in the long term. This is because the breakdown is only significant for the rate at which emissions are released.
Appendix 4 shows an overview of all application areas included with descriptions of the bases of calculation.
In Appendix 1, the table shows the F-gases covered by the Kyoto Protocol under the Climate Change Convention, including their chemical formulas and GWP values (Global Warming Potential).
2.2 Explanation of terminology
The following terms and abbreviations are used throughout this report:
- Enterprise end-user: A producer that uses greenhouse F-gases in connection with production processes in the enterprise.
- Emission factor: The factor used in the calculation of emissions from a product or a production process.
- Consumption: Consumption includes the quantities of substances reported in Denmark in the year in question via imports from
wholesalers and information from Danish producers.
- Importer: Enterprises in Denmark that sell the relevant substances
on the Danish market.
- KMO: The Danish Refrigeration Installers’ Environmental Scheme
- Stock: The amount of substance contained in equipment and
products in use in Denmark.
3 F-gas consumption
3.1 Import of substances
An overall picture of the trends in imports of greenhouse gases is given in Table 3.1, based on information from importers for the years 1992, 1994-2008.
3.1.1 HFCs
HFCs were imported by 9 enterprises in 2008. Five of them imports for resale and four of the importers is consumers bying substances directly from another EU country and use the imported substances in production.
In 2008, the total import (minus re-export) of pure HFCs and HFC blends was estimated to 399.4 tonnes. Compared to 2007, where the estimation of total import was 403.2 tonnes, the import has a minor decrease of 3.8 tonnes. The most significant trend in the development is an increase of HFC-407c import and a decrease of the HFC-404A import.
The import of HFC-134a is 164.5 tonnes and has only increased with 3.8 tonnes compared to 2007 and might indicate the stagnation in the trend for import level after full implementation of the regulation where new larger HFC refrigeration systems are banned (1/1 2007). The consumption of HFC-134a in commercial refrigeration is quite similar to 2007 and the consumption has increased slightly for household refrigeration application. In 2008, the import of HFCs in products is associated to an import of HFC-134a in medical doze inhalers of 7.2 tonnes. A time series of this application has been work out since it was registered starting in 1998. The total import (bulk + products) of HFC-134a is thereafter 171.7 tonnes in 2008.
Import of HFC-404A is further reduced with 15.8 tonnes compared to 2007, and the total import in 2008 is 114.1 tonnes. The consumption og HFC 404A in commercial refrigeration system is reduced with more than 20 tonnes. Thus, the consumption of HFC-404A refrigerant in transport refrigeration systems has increased to 8 tonnes.
The third largest HFC import is HFC-407c with an import of 76.8 tonnes in 2008. Compared to 2007, with an import of 50.5 tonnes it is an increase of approx. 26 tonnes. HFC-407c is a substitute refrigerant for HCFC-22 in refrigerators.
The import of HFC-152a was 15 tonnes in 2008. This is a small increase of the import in 2007. HFC-152a is used in thermostats.
Summarizing, the import has increased for HFC-134a, HFC-152a, HFC-407c and HFC-410A. The particular largest increase is the import of HFC-407c. There is no clear explanation for this trend. The largest decreases in 2008 were import of HFC-404A and HFC 507A.
3.1.2 Sulphur hexafluoride
Six importers reported having imported and sold 5.85 tonnes of sulphur hexafluoride in 2008. Sulphur hexafluoride was mainly used in power switches, but smaller amounts are used as an agent for plasma erosion in production of micro chips and in laboratories for analysis purposes.
3.1.3 Perfluorinated hydrocarbons
One importer has reported import of PFC-14 (CF4) and PFC-318 (c-C4F8) of approx. 0.5 tonnes in 2008. The PFCs are used in production of optical fibres which are a relatively new consumption area in Denmark. The consumption is close to the 2007 consumption of PFCs.
Further there has been a small import of 60 kg perfluorpropan C3F8,, which was contained in the blend refrigerant R413A (contain 8% PFC) used in commercial refrigerators.
Click here to see: Table 3.1 Developments in bulk imports of greenhouse gases, tonnes.
Beside the import of substances stated in table 3.1 there is also an import of HFCs for 100% re-export. These amounts are not included in the table. To be mentioned is import and re-export of HFC-365 and HFC-245fa. These HFCs are used in Danish production of PUR system foam (semi manufactured articles). The production is only for export (use of HFC based PUR systems are banned in Denmark). Furthermore the production does not course emissions through the production process. The particular amount is therefore excluded for further calculation of Danish f-gas emissions. The amounts are known by DEPA.
3.2 Consumption by application
The evaluation of consumption divided into application areas is estimated on the basis of information from importers and producers, and on sales reports to the Danish Refrigeration Installers' Environmental Scheme (KMO). Table 3.2 shows consumption distributed according to application.
| 134a | 152a | 401A | 402A | 404A | 407c | 507A | 410A | 413A | 417A | Other HFCs | Total | |
|---|---|---|---|---|---|---|---|---|---|---|---|---|
| Insulation foam | 0.0 | 0.0 | ||||||||||
| Foam systems | 0.8 | 0.8 | ||||||||||
| Soft foam | 0.0 | 0.0 | ||||||||||
| Medical doze inhalers 1) | 7.2 | 7.2 | ||||||||||
| Other applications | 7.1 | 15.0 | 0.6 | 22.7 | ||||||||
| Household fridges/freezers | 37.6 | 2.0 | 39.6 | |||||||||
| Commercial refrigerators | 72.8 | 0.0 | 0.0 | 104.8 | 1.8 | 16.9 | 0.7 | 0.7 | 8.3 | 205.9 | ||
| Transport refrigeration | 0.5 | 7.4 | 7.9 | |||||||||
| Mobile A/C | 35.7 | 35.7 | ||||||||||
| Stationary A/C | 10.0 | 76.8 | 86.8 | |||||||||
| Total | 171.7 | 15.0 | 0.0 | 0.0 | 114.1 | 76.8 | 1.8 | 16.9 | 0.7 | 0.7 | 8.9 | 406.6 |
¹) Bulk import is 164.5 tonnes and including 7.2 tonnes import from MDI in products the total HFC-134a import is 171.7 tonnes
3.2.1 Consumption of HFC refrigerant
The consumption of HFC refrigerants has no general trend. For HFC-134a the consumption is close to be the same as in 2007, but for HFC-404A, we now have the lowest level of consumption since 1997. In relation to HFC-407c the consumption has increased.
The generally low level of refrigerants in commercial refrigeration systems is in particular a consequence of the f-gas regulation where establishment of new HFC installations after 1/1 2007 is banned.
The use of HFCs as refrigerant in commercial refrigeration and stationary A/C systems is covering approx. 72 per cent of the total consumption in 2008. The most commonly used refrigerant in commercial refrigeration is still HFC-404A and HFC-134a.
The consumption of HFC-134a as a refrigerant in fridges/freezers was approx. 10 per cent of the total consumption in 2008. Most producers has substituted to alternative refrigerants or moved production facilities to other countries.
The consumption of refrigerants in vans and lorries for transport refrigeration covers approx. 2 per cent of the total consumption.
Consumption by application area is based on information from producers and importers and on data from KMO, which receives reports of the sales of substances from refrigerator installers and automobile garages, etc. (only when drawing-off is more than 1 kg).
The consumption of refrigerants for household fridges and freezers is calculated on the basis of information from enterprise end-users.
The consumption figures for refrigerants in commercial and stationary A/C systems, and mobile A/C systems and refrigerators are estimated using data from KMO and information from importers as well as statistics on car imports.
The consumption of HFCs in medical doze inhalers are based on product statistics from Danish Medical Agency.
Table 3.3 shows the consumption by weight of refrigerants according to application area.
| Substance | Fridges /freezers |
Commercial refrigerators and StationaryA/C systems |
Mobile A/C systems |
Refrigerated vans and trucks |
Total | In per cent |
|---|---|---|---|---|---|---|
| HFC | ||||||
| tonnes | tonnes | tonnes | tonnes | tonnes | ||
| -134a | 37.6 | 72.8 | 35.7 | 0.5 | 146.6 | 40.0 |
| -401A | - | - | - | - | ||
| -402A | - | - | - | - | ||
| -404A | 2 | 104.8 | - | 7.4 | 114.2 | 31.2 |
| -407c | - | 76.8 | - | - | 76.8 | 20.9 |
| -507A | - | 1.8 | - | - | 1.8 | 0.5 |
| Others | - | 27.2 | - | - | 27.2 | 7.4 |
| Total | 39.6 | 283.4 | 35.7 | 7.9 | 366.6 | - |
| In percent | 10.8 | 77.3 | 9.7 | 2.2 | - | 100 |
Mobile A/C
D.A.F. (The Danish Automobile Dealers Association) publishes annual statistics of the number of vehicles in Denmark /17/. These data form the basis for the calculation below of HFC-134a stock in Danish vehicles. Calculations also include a calculation of the proportion of A/C systems installed in vehicles, still undergoing servicing, and therefore still refilled with refrigerants in connection with leakage and other repairs. This calculation forms the basis for determining the amount of HFC-134a refrigerants refilled in vehicles in Denmark in 2008. Refilled stock = Danish consumption.
The results are shown in the table below.
| No. of Vehicles | Stock, kg, tonnes HFC-134a | Maintenance, filling, tonnes HFC-134a | Average filling per year, tonnes HFC-134a | |
|---|---|---|---|---|
| Private cars | 2.105,049 | 157.9 | 78.9 | 26.3 |
| Busses | 8,968 | 16.1 | 3.2 | 1.1 |
| Vans | 481,734 | 19.3 | 9.6 | 3.2 |
| Trucks | 50,555 | 37.9 | 15.2 | 5.1 |
| SUM | 231.2 | 107.0 | 35.7 |
The total stock of HFC-134a in mobile A/C systems in Denmark in 2008 was calculated to be about 231.2 tonnes, which is a further increase compared to 2007 stock. In 2008, the volume of HFC-134a filled onto mobile air conditioning systems was 35.7 tonnes. This volume of refrigerants was used solely for refilling in connection with the maintenance of existing systems /16/. It is indicated from suppliers of mobile A/C refrigerants, that the consumption is even higher than this estimated. One supplier assumes the consumption to be at least approx. 40 tonnes of HFC-134a per year
3.2.2 Consumption of HFC as foam blowing agent and as propellant
It is considered that the trend in the recent years is a general reduction of the HFC consumption as a blowing agent and this is the direct consequence of a statutory order on phase-out of F-gases, as well as the fact that there are competitive alternative technologies available on the market. As regards production of system foam for production, there is an increase in the recent years in production of system foam for export.
In 2008, the uses of HFCs as propellants in aerosols for specific purposes were about 7 tonnes. This estimate is based on DEPA’s grant of exemptions and production. The consumption seems to be stable tending to a decrease.
In 2008, the consumption of HFCs in products is associated with an import of HFC-134a in medical doze inhalers of 7.2 tonnes.
As in previous years, there have been no reports of consumption of HFCs for chemical production, fire extinguishing equipment, or other application areas apart from those mentioned.
3.2.3 Consumption of SF6
The overall consumption of SF6 in 2008 was estimated to 5.85 tonnes. Consumption of SF6 was used for power switches in high-voltage power systems and laboratories. Consumption of SF6 in production of double glazed thermal windows has been banned since 1. January 2003.
| Application area | DK consumption, tonnes |
|---|---|
| Double-glazed windows | - |
| Power switches in high-voltage plants | 5.6 |
| Laboratories and micro chip production (plasma erosion) | 0.25 |
| Total | 5.85 |
3.2.4 Consumption of PFCs
The consumption of PFCs (per fluoropropane) in 2008 was 0.5 tonnes. The PFC consumption in 2008 derives from to areas:
- optics fibre production
- refrigerants in commercial refrigeration
The optics fibre production used in 2008 PFC-14 (0.1 tonnes) and PFC-318 (0.35 tonnes) for technical purposes.
The consumption of blend refrigerant Isceon 49 contained 60 kg PFC-14 used for refrigeration in commercial stationary refrigeration systems.
4 Emission of F-gases
This section reports the actual emissions of the greenhouse F-gases HFCs, PFCs, and SF6 for 2008. All emissions are calculated as actual emissions according to IPCC’s tier 2 methodology. Thus, a new source (MDI) is included in the 2008 emission calculation.
The calculation is based on the reports on consumption of these substances analysed by application areas (section 3.2). For relevant product groups, adjustments have been made for imports and exports of the substances in products (see also chapter two for principal description of methodology). The specific emission calculation refers to appendix 4 which shows the particular emission factors, calculation method and assumptions, determination of IPPC Tier method etc., in relation to calculation of emissions from individual substance and application areas /4, 16/.
The total GWP-weighted actual emission of HFCs, PFCs, and SF6 in 2008 is calculated to 895.8 thousand tonnes CO2 equivalents. The corresponding emissions in 2007 without emissions from MDI were approx. 884.4 thousand tonnes CO2 equivalents. In absolute figures it corresponds to a calculated total increase of approx. 11.4 thousand tonnes CO2 equivalents, but if emissions from the new MDI source is included (approx. 10 thousand tonnes in 2008) the different between 2007 and 2008 is limited.
The consumption and GWP contribution for HFCs, PFCs, and SF6 for 2007 (without new MDI source) and 2008 are shown in the table below.
| Substance group | Consumption 2007, tonnes |
Consumption 2008, tonnes |
GWP contribution 2007, tonnes |
GWP contribution 2008, tonnes (including new MDI source) |
|---|---|---|---|---|
| HFCs | 403.2 | 454.4 | 838 724 | 851 373 |
| PFCs | 0.7 | 0.5 | 15 362 | 12 791 |
| SF6 | 5.4 | 5.8 | 30 347 | 31 599 |
| Total | 884 434 | 895 763 |
The HFC emission from commercial refrigerators (HFC-134a, HFC-404A and HFC-407c) increased in 2008 as compared to 2007. The increase is coursed solely by stock emission from the commercial refrigerants.
4.1 Emissions of HFCs from refrigerants
As required in the IPCC guidance for calculation of emission of f-gases a distinction is made between:
- Fridges and freezers for household use and retailers etc.
- Commercial refrigeration (in industry and retail) and stationary air conditioning systems
- Mobile air conditioning systems (in cars, trucks, bus, trains etc.)
- Mobile refrigeration systems (in vans and lorries)
Actual emissions from these sources occur in connection with:
- filling of refrigerants (emission is 0.5 percent to 2 per cent of refilled amount depending on application area).
- continual release during the operational lifetime. An assumed average value which account operational leakage including release occurring as a result of accident and damage (depending on application area, the average yearly emission differ from 10 percent to 33 percent).
Release resulting from disposal of items and equipment in the applications is not calculated as a contribution to the total f-gas emissions in Denmark because Danish legislation ensures that management and treatment of refrigerants prevent uncontrolled emissions. Thus, disposal in Denmark is stated as an activity in the calculations where zero emission occurs and this principal statement are used in order to reduce stock (the quantity of substances contained in a product after end life time).
Appendix 3 shows the specific emission factors used in the calculations.
Commercial refrigeration and stationary A/C systems
Commercial refrigeration, used e.g. in retail, supermarket, restaurants etc. or in industry, and stationary A/C systems, also used by retailers and industry, as well in offices, constitute the largest source of emissions. The most commonly used refrigerants in this product group are HFC-134a, HFC-404A and HFC-407c, where HFC-404A stands for the majority of the consumption and emissions in 2008.
In addition, use of the refrigerants HFC-408a, HFC-409a, HFC-410A, and HFC-507c is less common, and HFC-401A and HFC-402A are phased out in Denmark because of the substances contents of ozone depleting substances.
It is not relevant to adjust for imports and exports of HFCs in stationary commercial refrigeration and stationary A/C systems since filling of refrigerants only will take place on site when the units are installed.
Table 4.2 shows the consumption, stock and actual emission for 2008 for the main HFC substances used in Danish commercial refrigeration systems. Emissions for HFCs have been converted to CO2 equivalents in order to take into account the different GWP values of the substances and emission for 2010, 2015 and 2020 in a future scenario is also shown.
The projected future scenario takes into account the effect of a statutory order on phasing-out HFCs etc. and the effect of taxes on F-gases. As the tabel indicates the emissions from commercial refrigeration will continue in several years even there are no installations of new HFC refrigeration systems because of the statutory order which not allow construction of new installations (larger than 10 kg HFC) after 1. January 2007. In the trend analysis, the total emission from this sector is estimated to more than 340 000 tonnes CO2 equivalents in year 2015. But after then a significant reduction is expected and in year 2020 most HFC refrigeration systems is considered phased out.
Refrigerators/freezers
Actual emissions from refrigerants in refrigerators and freezers are determined on the basis of consumption adjusted for imports and exports of HFCs. The calculation assumes that the refrigerant is removed and treated upon disposal so that no emission occurs (see appendix 3).
When adjusting for imports and exports, the estimates of imports/exports in Environmental Project no. 523 are used /2/. In this case, exports are assumed to comprise 50 percent of the consumption pr. year. The calculation is made on the basis of Statistics Denmark's foreign trade statistics /3/ of average figures of the amount of HFC-134a in a standard fridge/freezer manufactured in 1999. This figure has not been updated
Table 4.3 below shows actual emissions from refrigerators/freezers in 2008, 2010 and 2015.
Total emissions of HFC-134a and HFC-404A refrigerants from refrigerators/freezers in 2008 were estimated to 15 100 tonnes CO2 equivalents. In the future scenario of actual emissions, it is estimated that the total emission in 2015 will decrease to 9 600 tonnes CO2 equivalents coursed by a decreasing stock.
Mobile A/C
Emissions from mobile A/C systems are mainly due to leakage and accident damage.
The calculation has been adjusted for import and re-export of HFC-134a, which is the only HFC imported in A/C systems in cars, vans and trucks. In Denmark, the consumption of HFC-134a for mobile A/C systems is used solely for refilling. Initial filling is carried out by car manufacturers in the country of production.
The assumptions used in the calculation of emission and stock in mobile A/C systems appear from Table 4.4. The assumptions have been adjusted according to individual statistical categories for types of transport and they represent estimated values based on information from car importers and refrigerator service enterprises /16/.
| Percentage of vehicles with A/C, % |
Filling pr vehicle kg HFC-134a |
Percentage of vehicles that undergo A/C maintenance, % |
|
|---|---|---|---|
| Cars | 10 | 0.75 | 50 |
| Busses | 20 | 9 | 20 |
| Vans | 10 | 0.8 | 50 |
| Trucks | 50 | 1.5 | 40 |
Table 4.5 shows a projection of the calculated actual emissions from mobile A/C systems and the parameters associated with the calculation.
Within the next five years, emission from mobile A/C is assumed to be the application area with the largest emission of HFC-134a in Denmark.
Vans and lorries with transport refrigeration system
There are an estimated 5 500-6 000 refrigerator vans and lorries in Denmark /16/. These require an average filling of about 8 kg, equivalent to approx. 46-49 tonnes refrigerants (HFC-134a, HFC-404A or HCFC-22) for the total stock in vans and lorries.
Actual emissions from mobile refrigeration systems in vans and lorries in 2008 are stated in the Table 4.6.
There has been no consumption of HFC-402A for refrigerator vans and lorries since this substance has been banned for use in both new and old installations. But the emission from stock is still about 0.2 tonnes HFC-402A, corresponding to 290 tonnes CO2 equivalents.
The total actual emission from mobile refrigeration systems in vans and lorries was estimated to 18 589 tonnes CO2 equivalents in 2008 which is a decrease compared to the 2007 estimate.
4.1.2 Emissions of HFCs from PUR foam products and propellants
Tree calculation principles have been applied in the calculation of emissions of HFCs used in Polyurethan (PUR) foam plastic products, depending on the type of product:
- Hard PUR foam plastics (closed cell)
- Soft PUR foam plastics (open cell)
- Polyether foam (closed cell)
The calculation principles are summerized in table 4.7 below and in appendix four.
| Hard PUR foam | Soft PUR foam | Polyether foam | |
|---|---|---|---|
| Release during production, % | 10 | 100 | 15 |
| Annual loss, % | 4.5 | - | 4.5 |
| Lifetime, years | 15 | - | 1-10 |
Insulation foam
There is no longer production of HFC based hard PUR insulation foam in Denmark. This production has been banned in statutory order since 1. January 2006.
The import of HFC-134a in products with PUR insulation foam, e.g. household fridges and freezers, is considered to 0 in 2008. This assumption is difficult to verify and no applicable method seems available.
The calculation of actual emissions are therefore only from existing stock of household fridges and freezers.
Actual emissions of HFC-134a from insulating foam are summarised in Table 4.8.
Table 4.8 Calculation parameters and emissions of HFC-134a from insulating foam for 2008, 2010 and 2015, tonnes
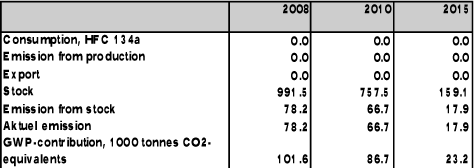
In the projection scenario for 2010 and 2015, it is estimated that the stock will be reduced significantly in 2015 as a result of the phase-out of HFC-134a as blowing agent and from 2018 it is estimated that there will be no more actual emissions from this source.
Aerosol sprays
Emission of HFCs from their use as aerosol spray is estimated as 100 per cent of the consumption in the year of application /4/. Emissions from this use occur during consumption after calculation of imports and exports.
Total emission from this areas amounts in 2008 to 7.1 tonnes of HFC-134a corresponding to 9 165 tonnes CO2 equivalents. Compared with 2007, emission estimates have decreased by approx. 1 700 tonnes CO2 equivalents.
Medical Doze Inhalers (MDI)
The emission of HFC-134a from medical doze inhalers is estimated as 100 per cent of the consumption in the year of application. Calculation of emission from MDI is based on yearly statistics from Danish Medicines Agency. A survey has determined that HFA (HFC 134a) has been fully introduced in all MDI on the Danish market, since 2007. The average contents is 72 mg/pr. doze.
The total emission in 2008 from MDI was 7.23 tonnes of HFC-134a corresponding to 9 398 tonnes CO2 equivalents. A time-series of the emission of HFC-134a from MDI has been included the F-gas inventory since the application was registered in 1998.
Optical fibre production
Both HFC and PFC are used for technical purposes in Danish optics fibre production.
HFC-23 is used as a protection and cleaning gas in the production process. The emission factor is therefore determined as 100 per cent release during production. The actual emission from HFC-23 is 1 404 tonnes CO2 equivalents in 2008.
4.1.3 Emissions of sulphur hexafluoride
The total emission of SF6 in 2008 has been calculated to 1.3 tonnes, equivalent to a GWP contribution of 31 599 tonnes CO2 equivalents.
Emissions derive from three sources - power switches, double-glazed windows and laboratories.
Double-glazed windows
Use of SF6 in double-glazed windows was phased out in 2002, however, there are still emissions from stock in existing double-glazed windows in Danish buildings. The stock is estimated from consumption data from Danish producers of double-glazed windows 1992-2002 and life time for double-glazed windows are determined to 20 years.
Emissions from double glazed windows are calculated on following factors:
- 15 per cent emission from production
- 1 per cent gradual emission from stock pr. year
- 65 per cent emission when disposal after 20 years
Table 4.9 Calculation parameters and emissions of SF6 from double-glazed windows for 2008, 2010 and 2015, tonnes
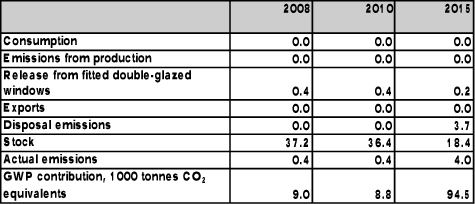
SF6 emissions from existing double-glazed windows will increase in the coming years because of end of life and disposal of old windows containing SF6. The future scenario for GWP contribution from double-glazed windows in 2015 shows an increase to 94.5 ktonnes CO2 equivalents to be compared with 9.1 ktonnes CO2 equivalents in 2008.
Power switches in high-voltage transmission stations
Power switches are filled or refilled with SF6, either for new installation or during service and repair. Filling is usually carried out on new installations and a smaller proportion of the consumption of SF6 is due to refilling /11/.
Emissions from power switches in high-voltage transmission systems are calculated due to the processes involved in the following way:
- release of 5 per cent on filling with new gas (average figure covering normal operation and failure/accidents)
- gradual release of 0.5 per cent from the stock (average figure covering normal operation and failure/accidents)
- release of 5 per cent from drawing off and recycling used gas (average figure covering normal operation and failure/accidents)
These figures are determined in a report of Danish SF6 use in high-voltage power switches /11/.
No emissions are assumed to result from disposal since the used SF6 is drawn off from the power switches and is either re-used internally by the company concerned, or re-used externally through means of a collection scheme. Emissions resulting from external re-use are determined on the assumption that 0.5 per cent of the annual stock is sent for external re-use.
Table 4.10 shows the amounts involved in the processes leading to emissions and calculated actual emissions from SF6 power switches.
Table 4.10 Calculation parameters and emissions of SF6 from power switches in high-voltage plants 2008, 2010, and 2015, tonnes
Laboratory purposes
Consumption of SF6 in laboratories covers two purposes:
- Plasma erosion in connection with the manufacture of microchips in
clean-room laboratories - Analysis purposes to a limited extend.
The emission is calculated to 0.27 tonnes SF6 in 2008 and it was primary for plasma erosion purpose. The emission is 100 % release during consumption and equivilizes 6 450 tonnes CO2 equivalents.
4.1.4 Emissions of per fluorinated hydrocarbons
Commercial refrigerators
The PFC emissions from commercial refrigerators occur from stock and from a smaller use of PFC-14 (R413A which contain 9 % perfluorinated hydrocarbons). The actual GWP-weighted emission from this source is 9 044 tonnes CO2 equivalents, which is a further reduction compared to the last six years.
Stock in commercial refrigerators has been estimated at about 11.3 tonnes in 2008 and trend is going toward phasing out units using HFC blends with PFC refrigerants.
The emission calculations use the same parameters as described for HFC emissions from commercial refrigerators (see appendix 3). Refrigerants containing PFC are only used in stationary refrigerators. Therefore no estimates for imports and exports are relevant.
Table 4.11 Calculation parameters and emissions of PFCs from commercial refrigerators in 2008, 2010 and 2015, tonnes
Optical fibre production
The PFC emission from optics fibre production has decreased in 2008. This sector use PFC-14 and PFC-318 for technical purpose in optics fibre production.
The PFCs are used as a protection and cleaning gas in the production process. The emission factor is therefore determined as 100 per cent release during production. The actual emission from PFC-14 and PFC-318 is estimated to 3 747 tonnes CO2 equivalents in 2008.
5 List of references
| /1/ | Arbejdsrapport nr. 20. Forbrug og emissioner af 8 fluorerede og klorerede kulbrinter (working report no. 20 on consumption and emissions of 8 fluorinated and chlorinated hydrocarbons - only available in Danish), Danish EPA, 1996. |
| /2/ | Miljøprojekt nr. 523. Ozonlagsnedbrydende stoffer og visse drivhusgasser - 1998 (environmental project no. 523 on ozone-depleting substances and certain greenhouse gases - 1998 - only available in Danish), Danish EPA, 2000. |
| /3/ | Udenrigshandelen fordelt på varer og land. Januar-december 1989, 1990-1999 (foreign trade analysed by goods and countries. January-December 1989, 1990-1999 - only available in Danish), Statistics Denmark 1989, 1990-1999. |
| /4/ | IPCC, 1997: Revised 1996 IPCC Guidelines for National Greenhouse Gas Inventories. Available at http://www.ipccnggip.iges.or.jp/ public/gl/i-nvs6.htm (15-04-2008). |
| /5/ | Ozonlaget og drivhuseffekten (the ozone layer and the greenhouse effect - only available in Danish), Danish EPA, April 1996. |
| /6/ | Beskyttelse af ozonlaget - nordisk perspektiv (protecting the ozone layer - a Nordic perspective - not available in English), The Nordic Council of Ministers, October, 1997. |
| /7/ | DEFU Komiterapport 94. Håndtering af SF6 og dets reaktionsprodukter i elforsyningsanlæg (committee report no. 94 from DEFU (Research Institute for Danish Electric Utilities) about management of SF6 and its reaction products in electricity supply plants). |
| /8/ | Methods used to Estimate Emission Inventories of Hydrofluorocarbons, Perfluorocarbons and Sulphur Hexafluoride. Draft report prepared for the UNFCCC secretariat. March Consulting, May 1999. |
| /9/ | Hvor kommer luftforureningen fra? - fakta om kilder, stoffer og udvikling (where does air pollution come from? - facts about sources, substances and development - only available in Danish). Thematic report from NERI, 29/1999. |
| /10/ | Substitutes for Potent Greenhouse Gases - 1998 Final Report (HFCs, PFCs and SF6), Per Henrik Pedersen, Danish EPA 1998. |
| /11/ | Indsamling og genanvendelse af SF 6 fra højspændingsanlæg (collection and reuse of SF6 from high-voltage plants - only available in Danish). Tomas Sander Poulsen et al., Danish EPA 2000. |
| /12/ | Denmark’s National Inventory Report - Submitted under the UN Convention on Climate Change. Illerup, J.B., Lyck, E., Winther, M. Rasmussen, E. NERI, 2000. Research Notes No. 127 (http://arbejdsrapporter.dmu.dk). |
| /13/ | Environmental Project No. 1168 2007: Ozone depleting substances and the greenhouse gases HFCs, PFCs and SF6 - 2005, Danish EPA, 2007. |
| /14/ | Denmark’s National Inventory Report. Submitted under the UN Framework Convention on Climate Change 1990-1999. Emissions Inventories. Department of Policy Analysis. Illerup, Lyck, Winther, 2002. 675 pp Research Notes from NERI 149. (http://www.dmu.dk/1_viden/2_publikationer /3_arbrapporter/rapporter/AR149.pdf). |
| /15/ | Annual Danish Atmospheric Emissions Inventory. 1999. Illerup, Andersen, Winther, Lyck, Bruun. NERI, Denmark. |
| /16/ | Revurdering af emissionsfaktorer for kommercielle køleanlæg og mobile A/C og køleanlæg (re-evaluation of emissions from commercial refrigerators, mobile A/C systems and refrigerators - only available in Danish). Poulsen, T.S, COWI; Environmental report no. 766, Danish EPA, 2002. |
| /17/ | D.A.F prepares statistics of registered vehicles, analysed into various categories of vehicle. These statistics are updated annually and used to calculate Danish filling of HFC-134a in vehicles. |
| /18/ | Denmark's National Inventory Report. Submitted under the United Nations Framework Convention on Climate Change 1990-2001. Emissions Inventories. Department of Policy Analyses. Illerup, Lyck, Nielsen, Winter, Mikkelsen, 2003. Research Notes from NERI no. 181. http://www.dmu.dk/1_viden/2_Publikationer/ 3_ arbrapporter/rapporter/AR181.pdf |
| /19/ | Denmark’s National Inventory Report. Submitted under the United Nations Framework Convention on Climate Change 1990-2002. Emissions Inventories. National Environmental Research Institute, Denmark. Illerup, Lyck, Nielsen, Winter, Mikkelsen, Hoffmann, Sørensen, Vesterdahl, Fauser. 2004. Research Notes from NERI no. 196. http://www.dmu.dk/1_viden/2_Publikationer/ 3_ arbrapporter/rapporter/AR196.pdf |
| /20/ | Anvendelse og håndtering af SF6-gas i højspændingsanlæg over 100kV (use and management of SF6 in 100kV or more high-voltage plant). ELTRA Memo elt2004-47a of 18 March 2004. |
| /21/ | Denmark's National Inventory Report 2005. Submitted under the United Nations Framework Convention on Climate Change. 1990-2003. Danmarks Miljøundersøgelser. Illerup, J.B., Lyck, E., Nielsen, M., Winther, M., Mikkelsen, M.H., Hoffmann, L., Sørensen, P.B., Fauser, P. , Thomsen, M., & Vesterdal, L. (2005): - Research Notes from NERI 211: 416 pp. (electronic). http://www2.dmu.dk/1_viden/2_Publikationer/ 3_arbrapporter/rapporter/AR211.pdf |
| /22/ | Good Practice Guidance. IPCC Switzerland, 2000. |
| /23/ | Denmark's National Inventory Report 2006. Submitted under the United Nations Framework Convention on Climate Change. 1990-2004. Danmarks Miljøundersøgelser. Illerup, J.B., Lyck, E., Nielsen, M., Winther, M., Mikkelsen, M.H., Hoffmann, L., Sørensen, P.B., Fauser, P. , Thomsen, M., & Vesterdal, L. (2005): - Research Notes from NERI 211: 416 pp. (electronic). http://www2.dmu.dk/1_viden/2_Publikationer/ 3_fagrapporter/rapporter/FR589.pdf |
| /24/ | Denmark's National Inventory Report 2007. Submitted under the United Nations Framework Convention on Climate Change. 1990-2005. National Environmental Research Institute, University of Aarhus. Illerup, J.B., Lyck, E., Nielsen, O.K., Mikkelsen, M.H., Hoffmann, L., Gyldenkærne, S., Nielsen, M., Winther, M., Fauser, P., Thomsen, M., Sørensen, P.B. & Vesterdal, L. (2007): - NERI Technical Report 632: 642 pp. (electronic). http://www2.dmu.dk/Pub/FR632_Final.pdf |
| /25/ | Environmental Project No. 1234 2008: Ozone depleting substances and the greenhouse gases HFCs, PFCs and SF6 , 2006, Danish EPA, 2008. |
| /26/ | Denmark’s National Inventory Report 2008. - Emission Inventories 1990-2006 - Submitted under the United Nations Framework Convention on Climate Change. National Environmental Research Institute, University of Aarhus. Nielsen, O.-K., Lyck, E., Mikkelsen, M.H., Hoffmann, L., Gyldenkærne, S., Winther, M., Nielsen, M., Fauser, P., Thomsen, M., Plejdrup, M.S., Illerup, J.B., Sørensen, P.B. & Vesterdal, L. (2008). NERI Technical Report no. 667. 701 pp |
| /27/ | Danish Environmental Protection Agency (DEPA), 2009: The greenhouse gases HFCs, PFCs and SF6. Danish consumption and emissions, 2007. Environmental Project No 1284. http://www2.mst.dk/udgiv/publications/2009/ 978-87-7052-962-4/pdf/978-87-7052-963-1.pdf |
| /28/ | Nielsen, O.-K., Lyck, E., Mikkelsen, M.H., Hoffmann, L., Gyldenkærne, S., Winther, M., Nielsen, M., Fauser, P., Thomsen, M., Plejdrup, M.S., Albrektsen, R., Hjelgaard, K., Vesterdal, L., Møller, I.S. & Baunbæk, L. 2009: Denmark’s National Inventory Report 2009. Emission Inventories 1990-2007 - Submitted under the United Nations Framework Convention on Climate Change. National Environmental Research Institute, Aarhus University. 826 pp. – NERI Technical Report No 724. http://www.dmu.dk/Pub/FR724.pdf |
Appendix 1: GWP values for F-gases
| Substance | Chemical formula | GWP value |
|---|---|---|
| HFCs | ||
| HFC-23 | 2 800 | |
| HFC-32 | CH2FH2 | 650 |
| HFC-125 | C2HF5 | 2 800 |
| HFC-134a | CF3CFH2 | 1 300 |
| HFC-152a | CF2HCH3 | 140 |
| HFC-245 | 950 | |
| HFC-227 | C3HF7 | 2 900 |
| HFC-365 | 890 | |
| HFC-404A¹) | - | 3 260 |
| HFC-401A(²) | - | 18 |
| HFC-402A(³) | 1 680 | |
| HFC-407c(4) | 1 525 | |
| HFC-408A(5) | 1 030 | |
| HFC-409A(6) | 0 | |
| HFC-410A(7) | 1 725 | |
| HFC-507A(8) | 3 300 | |
| Sulphurhexafluoride | SF6 | 23 900 |
| PFCs | ||
| PFC-14 (Isceon 49 contain 9%) | CF4 | 6 500 |
| PFC-318 | 10 300 |
- Mixture consisting of 52 % HFC-143a, 44 % HFC-125 and 4 % HFC-134a.
- Mixture consisting of 53 % HCFC-22, 13 % HFC-152a and 34 % HCFC-124.
- Mixture consisting of 38 % HCFC-22, 60 % HFC-125 and 2 % propane.
- Mixture consisting of 25 % HFC-125, 52 % HFC-134a, and 23 % HFC-32. (5) Mixture consisting of 46 % HFC-143a and 7 % HFC-125.
- A HCFC mixture consisting entirely of HCFCs, where the GWP - in accordance with the climate convention guidelines - is 0, since the mixture does not contain greenhouse gases. The real GWP value is 1,440.
- Mixture consisting of 50 % HFC-32 and 50 % HFC-125
- Mixture consisting of 50 % HFC-125, 50 % HFC-143a.
Appendix 2: GWP contribution from HFCs, PFCs, and SF6, 1993-2020.
The table below shows the time series 1993-2008 and the 2009-2020 projections of F-gases as GWP contributions.
The emission projections are determined by starting with a ‘steady state’ consumption using 2008 as the reference year and the cut-off dates for the phasing-out of specific substances, cf. the Statutory Order regulating certain industrial greenhouse gases.
The calculated GWP contribution expresses actual emissions, adjusted for imports and exports (the latest basis of calculation).
The calculated GWP contribution expresses actual emissions, adjusted for imports and exports (the latest basis of calculation).
Appendix 3: Specification of methods and assumptions for emission calculation
Appendix 4: Assessment of Good Practice Guidance compliance in DK F-gas calculation 2008
The Danish F-gas emissions are calculated for the historical years up to 2008. The time series of emissions are calculated using Good practice principles and the series goes back to 1993, but are to be considered complete from the year 1995.
Key Source Categories
F-gases are determined as a key source category. The contribution of F-gases to national greenhouse gas emission is approx. 1.3 % of total emission excl LULUCF in the most recent historical years of the inventories.
Future trend scenarios
A trend scenario is elaborated until 2020. The scenario is bases on a “steady state” trend but with an inclusion of dates for out phase of determined substances as stated in legal acts.
Methodology
In the following the relevant decision trees from the GPG (Good Practice Guidance) chapter 3 are investigated with respect to the Danish F-gas calculations compliance with GPG.
For the Danish calculation of F-gases it is basically a Tier 2 bottom up approach which is used, while data is reported from identified importers and users of F-gasses in DK. As for verification using import/export data a Tier 2 top down approach is applied. In an annex 4 to the F-gas emission report 2006 (Environmental Protection Agency), there is a specification of the applied approach for each sub source category.
Emission factors
Consumption data of F-gases are provided by suppliers and/or producers. Emission factors are primarily defaults from GPG which are assessed to be applicable in a national context.
In case of commercial refrigerants and Mobile Air Condition (MAC), national emission factors are defined and used. In case of PUR foam blowing of shoe and use of system foam EF are stated by the producer. Because of the relative low consumption from PUR foam blowing of shoes and system foam a certain uncertainty is assessed as acceptable.
Import/export data
Import/export data for sub category sources where import/export are relevant (MAC, fridge/freezers for household) are quantified on estimates from import/export statistic of products + default values of amount of gas in product. The estimates are transparent and described in the annex referred to above.
Import/export data for system foam and commercial refrigerators and stationary air condition are specified in the reporting from importers and users.
Consistency
The time series are consistent as regards methodology. No potential emission estimates are included as emissions in the time series and same emission factors are used for all years.
Reporting and documentation
The national inventories for F-gases are provided on a yearly basis and documented in a yearly report (Environmental Protection Agency, 2004 and 2005).
Detailed data from importers and users and calculations are available and archived in electronic version. The report contains summaries of EF used and information on sources, Further details on methodology and EF are included in annex to the report.
Activity data are described in a spread sheet for the current year. The spread sheet contains the current year as well as the years back. The current version is used with spreadsheet for data for the current year linking to the Danish inventory databases and for the CRF format. In case of changes to the previous reported data this is work out in spreadsheet versions accordingly and reported with explanations as required in the CRF format.
Source specific QA/QC and verification
Comparison of emissions estimates using different approaches
Inventory agencies should use the Tier 1 potential emissions method for a check on the Tier 2 actual emission estimates. Inventory agencies may consider developing accounting models that can reconcile potential and actual emissions estimates and may improve determination of emission factors over time.
This comparison has been carried out in 1995-1997 and for all three years it shows a difference of approx. factor 3 higher emissions by using potential emission estimates.
Inventory agencies should compare bottom-up estimates with the top-down Tier 2 approach, since bottom-up emission factors have the highest associated uncertainty. This technique will also minimise the possibility that certain end-uses are not accounted for in the bottom-up approach.
This exercise has been partly conducted since data from importers (top down) are assessed against data from users (bottom up) to ensure, that import and consumption are more or less equal. The consumption reported from users are always adjusted to the import of substances, which are the most exact data we have.
The uncertainty due to this is, if not all importers are identified because new imported are introduced to the DK market.
National activity data check
For the Tier 2a (bottom-up) method, inventory agencies should evaluate the QA/QC procedures associated with estimating equipment and product inventories to ensure that they meet the general procedures outlined in the QA/QC plan and that representative sampling procedures were used.
No QA/QC plan specifically for the F-gas calculation is developed. However, QC procedures were carried out as described below.
The spread sheets containing activity data has incorporated several data-control mechanisms, which ensure, that data estimates do not contain calculation failures. A very comprehensive QC procedure on the data in the model for the whole time-series has for this submission been carried out in connection to the process which provided (1) data for the CRF background Tables 2(II).F. for the years (1993)-2002 and (2) provided data for potential emissions in CRF Tables 2(I). This procedure consisted of a check of the input data for the model for each substance. As regards the HFCs this checking was done according to their trade names. Conversion was made to the HFCs substances used in the CRF tables etc. A QC was that emission of the substances could be calculated and checked comparing results from the substances as trade names and as the "no-mixture" substances used in the CRF.
Emission factors check
Emission factors used for the Tier 2a (bottom-up) method should be based on country-specific studies. Inventory agencies should compare these factors with the default values. They should determine if the country-specific values are reasonable, given similarities or differences between the national source category and the source represented by the defaults. Any differences between country specific factors and default factors should be explained and documented.
Country specific emission factors are explained and documented for MAC and commercial refrigerants and SF6 in electric equipment. Separate studies has been carried out and reported. For other sub source categories, the country specific emission factor is assessed to by the same as the IPCC default emission factors.
Emission check
Since the F-gas inventory is developed and made available in full in spread sheets, where HFCs data are for trade names, special procedures are performed to check the full possible correctness of the transformation to the CRF-format through Acces databases.
Uncertainties
In general uncertainty in inventories will arise through at least three different processes:
- Uncertainties from definitions (e.g. meaning incomplete, unclear, or faulty definition of an emission or uptake);
- Uncertainties from natural variability of the process that produces an emission or uptake;
- Uncertainties resulting from the assessment of the process or quantity, including, depending on the method used,: (i) uncertainties from measuring; (ii) uncertainties from sampling; (iii) uncertainties from reference data that may be incompletely described; and (iv) uncertainties from expert judgement.
Uncertainties due to poor definitions are not expected as an issue in the F-gas inventory. The definitions of chemicals, the factors, sub source categories in industries etc. are well defined.
Uncertainties from natural variability are probably occurring in a short term time period, while estimating emissions in individual years. But in a long time period – 10-15 years, these variabilities levels out in the total emission , because input data (consumption of F-gases) are known and are valid data and has no natural variability due to the chemicals stabile nature.
Uncertainties that arise due to imperfect measurement and assessment are probably an issue for:
emission from MAC (HFC-134a)
emission from commercial refrigerants (HFC-134a)
lead to inexact values of the specific consumption of F-gases.
The uncertainty varies from substance to substance. Uncertainty is greatest for HFC-134a due to a widespread application in products that are imported and exported. The greatest uncertainty in the areas of application is expected to arise from consumption of HFC-404a and HFC-134a in commercial refrigerators and mobile refrigerators. The uncertainty on year to year data is influenced by the uncertainty on the rates at which the substances are released. This results in significant differences in the emission determinations in the short term (approx. five years), differences that balances in the long term.
I connection to the work on the Danish National Inventory report general uncertainty estimates for F-gases has been worked out to make the uncertainties for the Danish inventories complete. Refer this report given in the reference list in the main report
Further improvement of uncertainty analysis with respect to the calculation of F-gas emissions are to be considered in future calculations.
References.
Danish Environmental Protection Agency (2004). Ozone depleting substances and the greenhouse gases HFCs, PFCs and SF6. Danish consumption and emissions 2002. Environmental Project No. 890.
http://www.mst.dk/udgiv/publikationer/2004/
87-7614-099-7/pdf/87-7614-100-4.pdf
Danish Environmental Protection Agency (2005). Ozone depleting substances and the greenhouse gases HFCs, PFCs and SF6. Danish consumption and emissions 2003. Under publication in English. In Danish: Ozonlagsnedbrydende stoffer og drivhusgasserne HFC'er, PFC'er og SF6. Forbrug og emissioner 2003. Miljøprojekt 987.
http://www.mst.dk/udgiv/publikationer/2005/
87-7614-546-8/pdf/87-7614-547-6.pdf
Version 1.0 March 2010, © Danish Environmental Protection Agency