AMAP Greenland and the Faroe Islands 1997-2001
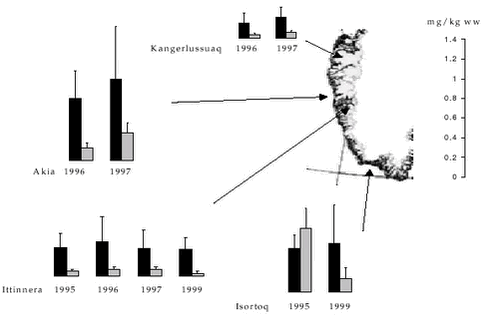
2 Terrestrial Environment2.1 Introduction2.2 Heavy metals 2.2.1 Levels and spatial trends 2.2.2 Temporal trends 2.3 Peat core study 2.4 Organochlorines 2.5 Radionuclides 2.6 References Citation: Riget, F1., M. Goodsite2, H. Dahlgaard3, W. Shotyk4, D.Muir5, P. Johansen1 & G. Asmund1: Chapter 2. Terrestrial Environment. In: Riget, F., J. Christensen & P. Johansen (eds). AMAP Greenland and the Faroe Islands 1997-2001. Ministry of Environment, Denmark 2.1 IntroductionThe contaminant data available for the terrestrial environment since AMAP phase 1 have been collected in connection with the following AMAP projects: “ Biological core programme”, “Mercury in dated peat bogs”, Regional differences in heavy metal concentrations in reindeer”, “Contaminants in Greenland human diet”, “Long term Atmospheric Records of Hg, Pb, Cd and POPs in the Arctic”,”Radionuclides, remaining phase 2 data, 2001”,”Radionuclides 2000” and “Anthropogenic radionuclides in Greenland and the Faroe Islands”. The description of contaminant levels, spatial trends and short-term temporal trends is focusing on the heavy metals Cd and Hg (Se) and on the organochlorines PCBs, DDTs, HCHs, HCB and chlordanes. Appendices A and B shows descriptive statistics of the new available data of heavy metals and organochlorines, respectively. The peat core studies have focused on long-term temporal trends of Hg and Pb. The radionuclide studies focus on deposition of 137Cs and 239,240Pu from 4 different regions in Greenland. 2.2 Heavy metals2.2.1 Levels and spatial trendsIn AMAP phase I, metals were determined in soil, humus, lichens and moss at four location in Greenland and caribou at two locations (Riget et al. 2000a, Aastrup et al. 2000). In general no obvious spatial trends were seen. Differences in metal levels mostly could be explained by natural causes such as bedrock geology, feeding behaviour rather than as consequences of contamination (Aakrog et. al. 1997). Since AMAP phase I, heavy metal data have become available for lichens (Cetraria nivalis), crowberry (Empetrum hermaphroditum), Arctic blueberry (Vaccinium uliginosum), ptarmigan (Lagupus mutus), sheep (Ovis sp.), Arctic hare (Lepus arcticus), caribou (Rangifer tarandus) and musk ox (Ovibos moschatus). Appendix A shows aggregated data together with basic information. Cd concentrations in lichens from Nuuk and Qaqortoq in 1999 were at a similar level as observed during AMAP phase I at four locations around Greenland (Riget et al. 2000a). The Cd concentrations collected in 1999 did not differ between the two locations (t-test of log-transformed data, p=0.96). Cd concentrations in berries (crowberry and Arctic blueberry) from southwest Greenland were low (0.004 and 0.028 mg/kg ww, respectively). Cd concentrations in ptarmigans from Nuuk and Qeqertarsuaq in 1999 show increasing level in the order muscle, liver and kidney. No significant difference was observed in Cd concentrations in liver and kidney between the two locations (t-test of log-transformed data, p=0.62 and p=0.74, respectively). No previous data exist on terrestrial bird species in Greenland. The Cd levels in liver and kidney were similar to those from northern Scandinavia and lower than samples from the Canadian Arctic (AMAP 1998). Cd concentrations in muscle from domestic sheep, Arctic hare and musk ox were low and at a similar level as in caribou. In liver of these terrestrial mammals, Cd concentrations ranged from 0.051 mg/kg ww in musk ox to 0.186 mg/kg ww in Arctic hare, which appears lower than in caribou (se Appendix A). Also in the kidney, the Cd concentrations appeared little lower than in caribou, except for Arctic hare (3.81 mg/kg ww). Cd concentrations in muscle of caribou were at or below the detection limit (0.003 mg/kg ww). Figure 2.2.1 shows the Cd concentrations in liver of caribou from different locations at West Greenland. Cd concentrations in caribou from Akia and Isortoq appear higher than in Kangerlussuaq and Ittinera. Several metals showed the same tendency with the highest levels in caribou from Isortoq and Akia and this probably is caused by higher availability of lichens as winter forage in these areas (Aastrup et al. 2000). The samples in Akia and Kangerlussuaq 1996 and 1997 were taken in the early winter (September 1996) and in the late winter (March 1997). In both areas a small increase of Cd was found from 1996 to 1997 indicating seasonal variation in Cd concentrations. In general, Cd levels in Greenland caribou are similar to levels found in eastern Arctic Canada, but lower than levels found further south in Norway and in Yukon in Canada (Aastrup et al. 2000). Hg-Se Hg concentrations in lichens from Nuuk and Qaqortoq in 1999 were similar to those found in AMAP phase I at four locations around Greenland (Riget et al. 2000a). Both Hg and Se concentrations in lichens from Isortoq in 1999 were significantly higher than in lichens from Nuuk the same year (t-test on log-transformed data, p=0.04 and p<0.01, respectively). Hg and Se concentrations in berries (crowberry and Arctic blueberry) from southwest Greenland were very low. Hg and Se concentrations in ptarmigans from Nuuk and Qeqertarsuaq in 1999 show increasing level in the order muscle, liver and kidney, however not as pronounced from liver to kidney as was the case for Cd. Hg concentrations in ptarmigans from Qeqertarsuaq was higher than in birds from Nuuk, however, this was only significant in case of liver tissue (t-test on log-transformed data, p=0.04 and 0.22, respectively). Se concentrations were not significantly different between the two locations (t-test of log-transformed data, liver p=0.87 and kidney p=0.77). No previous data existed on terrestrial bird species in Greenland. Hg levels in West Greenland ptarmigan liver and kidney were high compared to ptarmigans from Arctic Canada and considerably higher than in birds from northern Scandinavia (AMAP 1998).
Hg and Se concentrations in liver and kidney of caribou were highest in Isortoq and Akia, the two locations with highest availability of lichens as winter food (Aastrup et al. 2000). This geographical pattern was also seen for Cd. The Hg concentrations found in 1999 in caribou from Isortoq (liver: 0.142 mg/kg ww) were lower than found in 1995 (liver: 0.651 mg/kg ww), but still relatively high compared to the concentrations at the other locations (see Appendix A). Hg and Se levels were relatively high, especially at some locations, compared to the levels found in other Arctic regions (AMAP 1998 and Aastrup et al. 2000). 2.2.2 Temporal trends
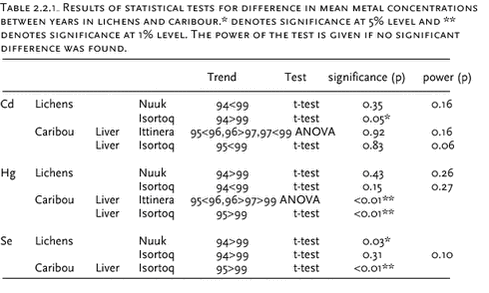
New heavy metal data from the terrestrial environment makes it possible to compare with previously found levels. However, possible differences between levels found in only few years cannot be interpreted as a temporal trend but may be caused by random year-to-year variation. The results may therefore only be indicative. Table 2.2.1 shows the results of the statistical analyses of temporal trends. Cd
In lichens from Isortoq, the Cd concentrations were significantly lower in 1999 than in 1994 (t-test on log-transformed data). However, in liver of caribou, the Cd concentrations were higher in 1999 than in 1995, but not significantly (t-test on log-transformed data). In lichens and caribou from Ittinera, Nuuk no significant difference was found between 1994 and 1999 in case of lichens (t-test on log-transformed data) and between years 1995, 96, 97 and 99 in case of caribou (ANOVA on log-transformed data). Hg/Se No significant difference in Hg concentrations in lichens from Isortoq between 1994 and 1999 was found (t-test on log-transformed data). In caribou liver from the same area, the Hg concentrations were significantly lower in 1999 than in 1994 (t-test on log-transformed data). In both lichens and caribou from Ittinera, Nuuk, the Hg concentrations were lower in 1999 than in 1994 (in case of lichens) and 1995, 96 and 97 (in case of caribou), however, the difference was only significant for caribou (ANOVA on log-transformed data). Se concentrations in lichens and caribou from Isortoq were lower in 1999 than in 1994 (lichens) and 1995 (caribou), however this was only significant in case of caribou (t-test on log-transformed data). Also in Ittinera, Se concentrations in lichens and liver of caribou were lower in 1999 than in 1994 (lichens) and 1995, 96 and 97 (caribou), but this was only significant for caribou (ANOVA on log-transformed data). 2.3 Peat core studyPeat cores were collected from ombrogenic and minerogenic peat deposits in Switzerland, Denmark, Scotland, the Shetland Islands, the Faroe Islands, Finland, Iceland, SW Greenland and the Carey Islands, as well as in the High Arctic of Canada (Bathurst Island, Nunavut). Data have become available from the following AMAP projects: ”Long term records of atmospheric deposition of Hg, Cd, Pb and persistent organic pollutants (POPs) in peat cores from Arctic bogs (Carey Islands, Greenland and Faroe Islands)”, ”Dating of Mercury in Peat Bogs”and ”The dating of transboundary air pollution in the Arctic”. Data also come from the following Swiss and US grants: ”Sources and rates of atmospheric mercury accumulation in the High Arctic of Canada and Europe: long term records (9,000 14C yrs) using peat cores”.Swiss National Science Foundation, ”Long term records of the changing rates and sources of atmospheric metal deposition using peat cores from bogs”. Swiss National Science Foundation, ”Long term records of atmospheric deposition of Hg, Cd, Pb and persistent organic pollutants (POPs) in peat cores from Arctic bogs, and comparison with bogs in the temperate zone”. International Arctic Research Centre, Fairbanks, Alaska. The focus of the projects have been to obtain peat profiles in Arctic regions and analyse them geochemically as well as paleoecologically and date the profiles with as high resolution as possible. The goal has been to establish long term records of Hg, Pb, Cd and POPs in the Arctic, and compare them with continental records. Our primary focus has been mercury, whereas Cd and POP data are not yet available. The data may be used as input for models and obtaining knowledge of past background variations with climate. The distribution of mobile trace elements such as Ca and Sr and redox-sensitive trace elements such as U in the profiles was used to indicate the ombrogenic sections of the peat profiles where Hg was supplied exclusively by atmospheric processes. Age dating of these sections, using both 210Pb and 14C, allows the rates of peat formation to be quantified and this, in turn, is used to calculate the rates of atmospheric Hg accumulation. The fluxes of atmospheric Hg from the post-Industrial period can be compared with those of pre-Industrial and ancient samples, in an effort to distinguish between natural and anthropogenic fluxes. In the modern time the fluxes can also be compared with the 210Pb flux since this is considered atmospheric input as well. The cores represent up to 12,000 14C years of peat accumulation. With respect to the cores from SW Greenland and Denmark, a high resolution chronology (± 2 yrs) has been established for past 50 years using 14C to reconstruct the atmospheric bomb pulse curve (Goodsite et al., 2001). In Greenland, Hg concentrations in the peat samples dating from the 1950‘s are up to 14 times higher than samples dating from AD 890-985 (Shotyk et al., 2002). A similar Hg chronology has been obtained for Hg accumulation in Denmark, but the concentrations tend to be approximately twice those of Greenland. Work is presently focussed on providing reliable estimates of Hg “flux” or net accumulation, since Hg concentrations can appear to be misleading in cores as Hg is concentrated through time in peat, due to natural decomposition of the organic material, and the possibility of perterbation of the true depositional signature/profile due to diagenitic processes/post depositional transformation and mobility are still being studied.. With respect to the cores collected from Bathurst Island, Nunavut, Hg concentrations in surface samples exceed those of deeper, older peat layers by 7 to 17 times. Work is now underway to try to also date these cores using the 14C atmospheric bomb pulse. With respect to the cores collected from lower latitudes, the greatest Hg concentrations were found on the Faroe Islands (up to 700 ng/g) with maximum Hg concentrations decreasing in the order Faroes > Shetland > Scotland > Switzerland. Peat samples dating from the post-Industrial period are clearly enriched in Hg, relative to pre-Industrial samples, at each of these sites. However, at least in the peat core from the Faroe Islands, the relationship between Hg enrichment in the subsurface and redox-related Fe transformations of Fe, requires further study. The cumulative, longterm rates of atmospheric Hg accumulation (µg/m2/yr), averaged over the past 1 to 5 millenia, are Switzerland (2.0-2.3), Scotland (5.1-6.1), Faroes (6.1-7.8), and Shetland (7.9-9.7). The elevated Hg concentrations and net accumulation rates found in deeper peat layers from Scotland, Shetland, and the Faroe Islands, compared to the peat core from an ombrogenic bog in Switzerland, suggests that there may be a significant natural source of Hg in the N Atlantic region. The most obvious possible Hg source is volcanic emissions and degassing of the earth’s mantle in Iceland. The Hg concentrations and fluxes which will be obtained using peat cores from Iceland will test this hypothesis.
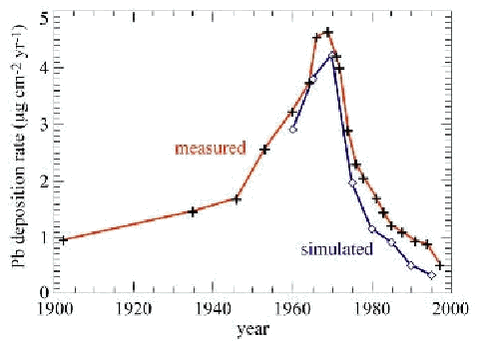
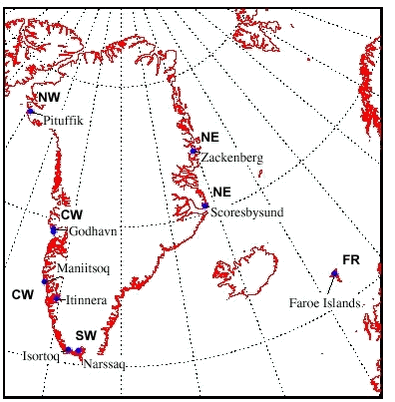
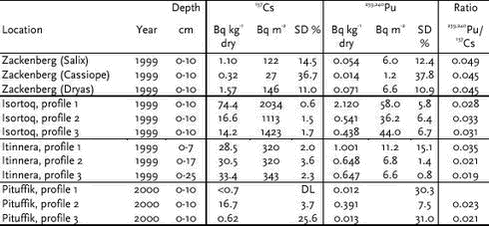
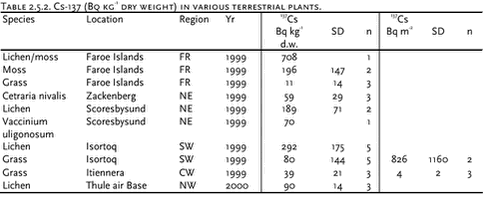
Conclusions and recommendations: The challenging scientific issue regarding interpretation of these records is the lack of scientific understanding of post depositional processes. While it is well documented that Pb is very well preserved, and that data obtained from ombrogenic peat bogs are generally in good correlation with detailed regional models of lead deposition (Figure 2.3.2), there is still much work to be done to show the same for Hg and Cd. For example: the change in time of concentrations or net accumulation recorded in the peat are too fast: i.e. the "slopes" of the deposition versus time in the various media - seem to be much faster than normal atmospheric chemistry and deposition processes allow. Certainly the climate and associated effects greatly affect the total input of mercury, just as things that might have effected the climate in the past (e.g. large amounts of volcanic activity) might have released large amounts of mercury. More study is needed, and a closer look needs to be taken at the data provided by environmental archives to determine if climatic effects outweigh those of anthropogenic effects with respect to end deposition in the Arctic. Certainly there is interdependency, and most likely a synergistic effect. There is yet to be found true ombrogenic peat in the Arctic. The peat deposits found are either minerogenic, or nourished by bird droppings (deposits on top of cliffs like on the Carey Islands). Much work needs to be done, and is underway by the group and others, to be able to properly interpret the profiles measured in Arctic peat. To better understand the supplementary and complementary functions of different environmental archives especially, peat and lake sediment, we need a study, that for the same catchment compares the profiles of e.g. Hg recorded in peat and lake sediment. Research on peat in the future should focus on answering the above questions and should be supplemental to research with other environmental archives. 2.4 OrganochlorinesPrior to AMAP II very little knowledge existed of OC levels in the Greenland terrestrial biota. Few and relatively old studies existed dealing with OCs in terrestrial species such as Arctic fox (Alopex lagopus), sheep (Ovis aries), peregrine falcon (Falco peregrinus), see review by Fromberg et al. (1999). In the project “Contaminants in Greenland human diet” OC data have become available for ptarmigan, hare, lamb and musk ox sampled in 1999 from West Greenland (Appendix B). The National Water Research Institute, Canada (NWOC) has conducted all the OC analyses. In general, OC levels are very low in terrestrial biota compared to marine species (see chapter 4.4). For example in muscle tissue, PCB levels are 10 to 60 times lower in terrestrial than in marine mammals. Even in fat OC levels are low in terrestrial mammals and only slightly higher than in muscle. This is a contrast to marine mammals, in which blubber has the highest OC levels. In Greenland PCB levels in fat are 100 to 1000 times lower in terrestrial than in marine mammals. The dominant OC were ΣPCB. Chlordanes, ΣHCH, and HCB levels were lower and ΣDDT even lower than these. The sum of 10 PCB congeners (28, 31,52, 101, 105, 118, 138, 153, 156, 180) ranged from 0.10 µg/kg ww in hare liver to 2.04 µg/kg ww in lamb liver. 2.5 RadionuclidesArtificial radionuclides have been monitored in the Greenland environment since the 1960’s. The Greenland data have been reviewed in the first Arctic Monitoring and Assessment (AMAP) reports (Aarkrog et al. 1997; Strand et al. 1998). Since the AMAP I assessment, no radioactive contamination of the Greenland environment of significance has been detected. As compared to the previous assessment, the levels measured are thus mainly influenced by environmental redistribution and continued decay and dilution with time. The present account shows averaged values. For individual analytical results, consult the data compilation. The sampling regions are given in Figure 2.5.1. A sampling campaign was carried out to determine the deposition of 137Cs and 239,240Pu from 4 different regions in Greenland. Three soil profiles were taken from different areas in each region. The samples were taken with available tools, i.e., no standard soil profilers were used. The aim was to get area-representative soil samples from relatively flat regions split in 10 cm depth sections. The raw data showed a large variation: in most profiles, only the top 5 or 10 cm were above detection limit, whereas other profiles seemed to have 137Cs distributed to 40 or 50 cm. 239,240Pu was only analysed in the uppermost layers. As 137Cs from fallout, at some sites, has penetrated to 50 cm or more, it should also be expected that a fraction of the 137Cs and the 239,240Pu have been washed out to streams, lakes and fjords. In the results compiled in Table 2.5.1, the significant results have been summed up.
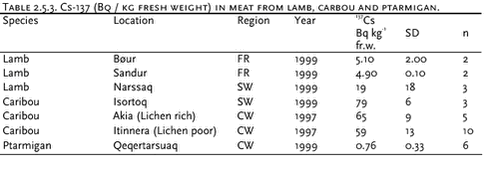
In spite of the variability, the data gives a picture similar to what was seen earlier (Aarkrog et al., 1997), i.e. highest fallout to the south parallel to high precipitation rates. The 239,240Pu / 137Cs activity ratio in integrated global fallout was estimated as 0.0116 without decay correction (Beck & Bennettt, 2002). Decay correcting from 1962 to 2002 changes this ratio to around 0.029, which is relatively close to the measured values. Due to limitations described above, the values given in Table 2.5.1 do not represent the total integrated fallout. The 239,240Pu / 137Cs ratios from Zackenberg are apparently higher than for the other sites and for the samples taken in 1994 (Aarkrog et al. 1997). Table 2.5.3 gives 137Cs concentrations in meat from lamb, caribou and ptarmigan. In 1997, a special sampling of reindeer was performed to evaluate the effect of lichen-rich and lichen-poor areas on the level of 137Cs. This was initiated because the food chain transfer of 137Cs from lichen to reindeer is known to be important for 137Cs (Ahman et al., 2001). The levels observed in Greenland are intermediary between the low Icelandic levels, explained by a low frequency of lichens, and the Norwegian pre-Chernobyl values (Palsson et al., 1994). There was no significant difference between the two groups of caribou sampled. The test is weakened by the fact that the two groups of caribou were shot 16. - 17 September 1997, which is before the main lichen-grazing period. Although lower than in caribou, the transfer of caesium to lamb in south Greenland is high. As seen in the Faroe Islands, high levels in lamb are explained not only by a high fallout, but also by long ecological half-lives and high transfer parameters due to special environmental conditions (Joensen, 1999). This phenomenon deserves further study in Greenland. Conclusions and recommendations
2.6 ReferencesAMAP, 1998. AMAP Assessment Report: Arctic Pollution Issues. Arctic Monitoring and Assessment Programme (AMAP), Oslo, Norway. xii+859 pp.. Aarkrog, A., P. Aastrup, G. Asmund, P. Bjerregaard, D. Boertmann, L. Carlsen, J. Christensen, M. Cleemann, R. Dietz, A. Fromberg, E. Storr-Hansen, N. Z. Heidam, P. Johansen, H. Larsen, G.B.Paulsen, H. Petersen, K. Pilegaard, M.E. Poulsen, G. Pritzl, F. Riget, H. Skov, H. Spliid, P.Weihe and P. Wåhlin, 1997. AMAP Greenland 1994-1996. Arctic Monitoring and Assessment Programme. Danish Environmental Protection Agency, Environmental Project No. 356: 788 pp. Aastrup, P., F. Riget & G. Asmund, 2000. Lead, zinc, cadmium, mercury, selenium and copper in Greenland caribou and reindeer (Rangifer tarandus). Sci. Total Environ 245: 149-159 Ahman, B., S. M. Wright & B. J. Howard, 2001. Effect of Origin of Radiocaesium on the Transfer From Fallout to Reindeer Meat. Sci. Total. Environ. 278: 171-181. Beck, H. L. & B. G. Bennettt, 2002. Historical Overview of Atmospheric Nuclear Weapons Testing and Estimates of Fallout in the Continental United States. Health Phys. 82: 591-608. Fromberg, A., M. Cleemann & L. Carlsen, 1999. Review on Persistent Organic Pollutants in the Environment of Greenland and Faroe Islands. Chemospere (38) 13: 3075-3093 Goodsite, M.E., J. Heinemeier, W. Rom, T. Lange, S. Ooi, P.G. Appleyby, W. Shotyk, W.O.van der Knaap, C. Lohse, C. & T.S. Hansen, 2001. High resolution AMS 14C dating of post bomb peat archives of atmospheric pollutants. Radiocarbon 43:2B: 495-515 Joensen, H. P., 1999. Long-Term Variation of Radiocaesium in the Food Chain of Lamb in the Faroe Islands. J. Environ. Radioactivity 46: 345-360. Palsson, S. E., K. Egilsson, S. Porisson, S. M. Magnusson, E. D. Olafsdottir & K. Indridason, 1994. Transfer of Radiocesium From Soil and Plants to Reindeer in Iceland. J. Environ. Radioactivity 24: 107-125. Riget, F. G. Asmund & P. Aastrup, 2000a. The use of lichen (Cetraria nivalis) and moss (Rhacomitrium lanuginosum) as monitors for atmospheric deposition in Greenland. Si Total Environ. 245: 137-148 Roos-Barraclough, F., H.F. Biester, M.E. Goodsite, A. Martinez-Cortizas, & W. Shotyk, (in press) Analytical protocol for measuring total Hg concentrations in peat cores. Science of the Total Environment, Special Issue on Peat Bog Archives (A.M. Cortizas, Guest Editor). Roos-Barraclough, F., A. Martinez-Cortizas, E. Garcia-Rodeja & W.Shotyk, 2001. 15,000 years of atmospheric mercury deposition controlled by halogens, volcanism, and Man. Earth and Planetary Science Letters (in review). Shotyk, W., M.E.Goodsite, F. Roos, J Heinemeier, W. Rom, P.G. Appleby, R. Frei, G. Asmund, & H.F. Biester, 2002. Atmospheric Hg, Pb, and As in peat cores from Greenland and Denmark dated using the 14C ams bomb pulse technique and 210Pb: concentrations, natural and anthropogenic enrichments, and fluxes. Earth and Planetary Science Letters (revision in preparation). Strand, P., M. Balonov, A. Aarkrog, M. J. Bewers, B. Howard, A. Salo & Y. S. Tsaturov, 1998. AMAP Assessment Report: Arctic Pollution Issues. Chapter 8: Radioactivity. Arctic Monitoring and Assessment Programme (AMAP), Oslo, Norway |
