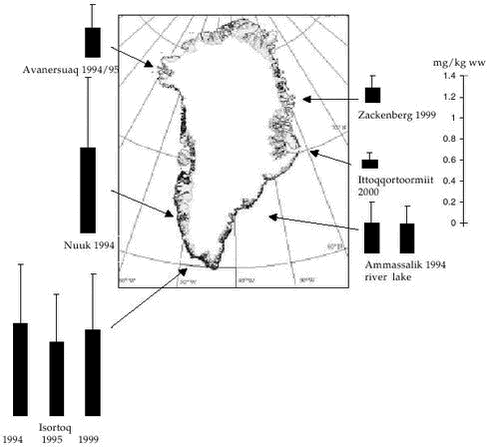
AMAP Greenland and the Faroe Islands 1997-20013 Fresh Water Environment3.1 Introduction3.2 Stable isotopes 3.3 Heavy metals 3.3.1 Spatial and temporal trends 3.4 Organochlorines 3.4.1 Levels and spatial trends 3.4.2 Temporal trends 3.5 Radionuclides 3.6 References Citation: Riget, F1., H. Dahlgaard2 & D. Muir3: Chapter 3. Fresh Water Environment. In: Riget, F., J. Christensen & P. Johansen (eds). AMAP Greenland and the Faroe Islands 1997-2001. Ministry of Environment, Denmark 3.1 IntroductionThe contaminant data available for the Greenland fresh water environment since AMAP phase I have been collected in connection with the following projects: “Biological core programme”, “Temporal time trend programme”,”Radionuclides, remaining phase 2 data, 2001”,”Radionuclides 2000” and ”Anthropogenic radionuclides in Greenland and the Faroe Islands”. Arctic char (Salvelinus alpinus) is the only fresh water species where new contaminant data is available. The description of contaminant levels, spatial trends and short-term temporal trends focuses on the heavy metals Cd and Hg (Se) and on the organochlorines PCBs, DDTs, HCHs, HCB and chlordanes. Appendices A and B show descriptive statistics of the new available data of heavy metals and organochlorines, respectively. Stable isotopes have been analysed in order to facilitate the interpretation of levels and trends. The radionuclides focus on concentrations of 137Cs and 90Sr in fresh water sampled in 4 Greenland regions and the Faroe Islands and 137Cs in Arctic char. 3.2 Stable isotopesStable-nitrogen and stable-carbon isotope ratios were measured in muscle of Arctic char sampled in 1999 and 2000 according to Hobson et al. (1997) at the laboratory of Prairie and Northern Wildlife Research Center, US. Stable isotopes data can be informative about feeding preferences and trophic level (Hobson & Welch, 1995). The reason is that the abundance of Stable isotopes have been determined in the Arctic char sampled in Qaqortoq and Zackenberg, 1999 and in Ittoqqortoormiit, 2000. Table 3.2.1 shows stable-nitrogen and carbon isotope values from the Arctic char populations. No significant difference (p<0.05) in 3.3 Heavy metals3.3.1 Spatial and temporal trendsArctic char is the only fresh water species from which new data are available since AMAP phase I. Cd Hg/Se Hg concentrations in lake resident Arctic char populations in Greenland appear to be at the same levels as found in Arctic Canada and somewhat higher than in Finnish Lapland, Iceland, Norway, Russia and Sweden (Riget et al. 2000b). Temporal trends Hg concentrations in Arctic char from Isortoq in 1999 can be compared with those found in 1994 and 95. No significant difference was found in Hg concentrations between the years (ANCOVA on log-transformed data, p=0.06).
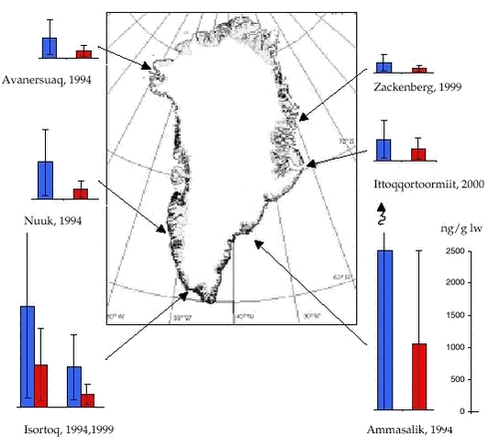
3.4 OrganochlorinesIn AMAP phase I, OCs were determined in four landlocked Arctic char from Avanersuaq, Nuuk, Isortoq (Qaqortoq) and Tasiilaq (Cleemann et al. 2000b). In general, the levels of ΣPCB, ΣDDT, ΣCHL and to a less extent HCB were higher in chars from east Greenland than in chars from west Greenland, whereas. ΣHCH levels were highest in chars from west Greenland. During AMAP phase II, OCs were analysed in chars from Isortoq and Zackenberg (east Greenland) sampled in 1999 and from Ittoqqortoormiit in 2000 (Appendix B). The OC analyses were conducted by NWOC. 3.4.1 Levels and spatial trendsThe OC levels in landlocked Arctic char muscle were in the same range as found in muscle of marine fish species such as Atlantic cod, redfish, Atlantic salmon, capelin and Greenland halibut (Appendix B). The OC levels in char from Isortoq (west), Zackenberg and Ittoqqortoormiit (east) sampled in 1999 and 2000 showed no large differences among locations, although chars from Ittoqqortoormiit tended to have higher levels of ΣPCB-10, ΣDDT, ΣCHL, ΣHCH, and HCB. Thus 1999 and 2000 results do not confirm higher OC levels in chars from east than from west Greenland as seen in 1994. Figure 3.4.1 shows length normalised ΣPCB-10 and ΣDDT concentrations in female char (expressed on lipid basics).
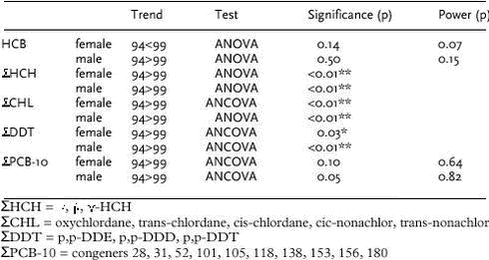
Spatial comparisons of contaminant levels in Arctic char are complicated by the fact that char may be found in two or three co-existing forms which may differ in size, habitat use, diet, reproductive strategy and growth. The occurrence of sympatric forms is influenced by the availability of ecological niches, a parameter, which in turn is dependent on lake morphometry (Riget et al. 2000c). Despite these difficulties, the OCs levels in Arctic char in Greenland appear to be lower than found in Canada, but higher than found in Sweden and Finland (Cleemann et al. 2000b). 3.4.2 Temporal trendsThe Arctic char population in Qaqortoq was also analysed for OCs in 1994 (Cleemann et al. 2000b). NERI performed the chemical analyses. Table 3.4.1 summarises the results of statistical tests of differences in mean OC levels between 1994 and 1999. Prior to the test, data were logarithmic transformed. If the log-OC concentrations were significantly dependent on fish length an analysis of covariance (ANCOVA) was performed, otherwise an analysis of variance (ANOVA) was performed. All OC concentrations, except HCB in females, were higher in chars from 1994 than from 1999. For ΣHCH and ΣCHL both in females and males and for males ΣDDT, the difference was significant at the 1% level. In females, the difference in ΣDDT between years was significant at the 5% level.
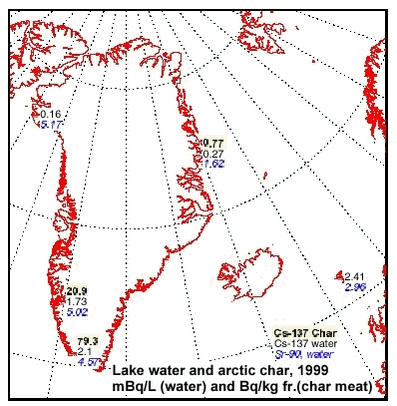
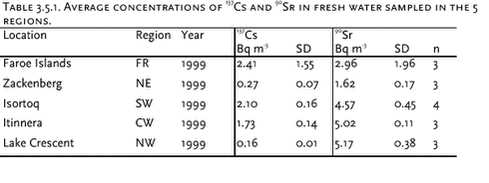
3.5 RadionuclidesTable 3.5.1 and 3.5.2 and Figure 3.5.1 present average concentrations of 137Cs and 90Sr in fresh water sampled in 4 Greenland regions and the Faroe Islands and 137Cs in Arctic char caught in northeast and southwest Greenland. The data indicate a large geographical variability, but reproduce the same trends as seen in the previous AMAP assessment. The highest concentrations of 137Cs and 90Sr in water are found in south and southwest Greenland, where the global fallout was highest. This is concurrent with the highest precipitation rates in these areas. The global fallout showed 137Cs / 90Sr activity ratios around 1.5. The lower ratios in fresh water are due to the larger mobility in the drainage area and the lower association to sedimenting particles of Sr. The present Greenlandic levels vary between 0.03 and 0.46 indicating a large variability in drainage area and lake characteristics. By comparing 137Cs concentrations in Arctic char and fresh water from the same sites, bioaccumulation factors around 2800, 37000 and 12000 Bq kg-1 fresh char meat / Bq L-1 water (or L kg-1) were calculated for Zackenberg, Isortoq and Itinnera, respectively. A relatively high bioaccumulation factor and a long environmental half life for radiocaesium is expected, (Ugedal et al. 1995, Rowan et al. 1998, Jonsson et al. 1999), but the extremely high bioaccumulation factors in south and southwest Greenland are noteworthy. Caesium is transferred preferentially via food and is biomagnified along food chains. The accumulation in fresh water fish is enhanced due to several ecological reasons, e.g. low ionic content, slow growth rates, food choice, age and size (Ugedal et al. 1995, Rowan et al. 1998). The levels at Isortoq and Itinnera are similar to observations in the previous AMAP assessment (Aarkrog et al. 1997), where it could be concluded that only 10% of the Isortoq value was due to Chernobyl derived 137Cs, i.e. the high levels are originating from global fallout in the 1950’s and 1960’s. As large variations between individuals and between different lakes can be expected, it is likely that other lakes in south Greenland will show even higher 137?Cs levels in Arctic char, especially clear-water, low-ionic oligotrophic lakes from areas with a high precipitation. The concentrations of 137Cs in fresh water fish are of no serious radiological concern. However, an annual consumption of 10 kg of the Isortoq char will cause an annual radiation dose of 10 µSv corresponding to a radiological risk which is considered to be at the limit of regulatory concern (EU, 1996).
3.6 ReferencesAarkrog, A., P. Aastrup, G. Asmund, P. Bjerregaard, D. Boertmann, L. Carlsen, J. Christensen, M. Cleemann, R. Dietz, A. Fromberg, E. Storr-Hansen, N. Zeuthen Heidam, P. Johansen, H. Larsen, G. Beyer Paulsen, H. Petersen, K. Pilegaard, M. E. Poulsen, G. Pritzl, F. Riget, H. Skov, H. Spliid, H. Weihe & W. Wåhlin, 1997. AMAP Greenland 1994-1996. Environmental Project 356: 792pp. Ministry of Environment and Energy, Copenhagen Cleemann, M., F. Riget, G.B. Paulsen, J.de Boer, J. Klungsøyr & R. Dietz, 2000b. Organochlorines in Greenland lake sediments and landlocked Arctic char (Salvelinus alpinus). Sci. Total Environm. 245: 173-185. EU. 1996. Basic Safety Standards. Bulletin of the European Union, L 159, 29.6.1996: Fry, B. & E.B. Sherr, 1988. Hobson, K.A. & H.E. Welch, 1995. Cannibalism and trophic structure in a high Arctic lake: Insights from stable-isotope analysis. J. Fish. Aquat. Sci. 52: 1195-1201 Hobson, K.A., J.L. Sease & J.F. Piatt, 1997. Investigating trophic relationships of pinnipeds in Alaska and Washington using stable isotope ratios of nitrogen and carbon. Marine Mammal Science 13(1): 114-132 Riget, F. G. Asmund & P. Aastrup, 2000b. Mercury in Arctic char (Salvelinus alpinus) populations from Greenland. Sci Total Environ 245: 161-172 Riget, F., E. Jeppesen,, F. Landkildehus, T.L. Lauridsen, P- Geertz-Hansen, K. Christoffersen, & H. Sparholt, 2000c. Landlocked Arctic char (Salvelinus alpinus) population structure and lake morphometry in Greenland – is there a connection? Polar Biology, 23: 550-558 Rowan, D. J., L. A. Chant & J. B. Rasmussen, 1998. The Fate of Radiocesium in Freshwater Communities - Why Is Biomagnification Variable Both Within and Between Species? J. Environ. Radioactivity 40: 15-36. Ugedal, O., T. Forseth, B. Jonsson & O. Njastad, 1995. Sources of Variation in Radiocesium Levels Between Individual Fish From a Chernobyl Contaminated Norwegian Lake. Journal of Applied Ecology 32: 352-361. |

