AMAP Greenland and the Faroe Islands 1997-2001
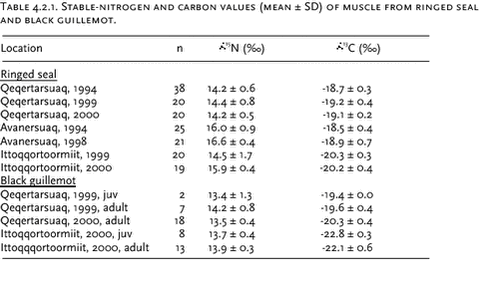
4 Marine Environment4.1 Introduction4.2 Stable isotopes 4.3 Heavy metals 4.3.1 Levels and spatial trends 4.3.2 Temporal trend 4.4 Organochlorines 4.4.1 Levels and spatial trends 4.4.2 Temporal trend 4.5 Radionuclides 4.5.1 Levels of 137Cs, 99Tc, 90Sr, and 239,240Pu in components of the marine environment 4.5.2 Plutonium in Bylot Sound - The Thule Accident 1968 4.6 Lead contamination of Greenland seabirds hunted with lead shot 4.7 Contaminant signatures as reflecting population structure 4.7.1 West Greenland narwhals 4.7.2 North Atlantic minke whales 4.8 References Citation: Riget, F1., P. Johansen1, M. Glasius2, K. Vorkamp3, H. Dahlgaard4, D. Muir5, G. Asmund1 & E.W. Born6: Chapter 4. Marine Environment. In: Riget, F., J. Christensen & P. Johansen (eds). AMAP Greenland and the Faroe Islands 1997-2001. Ministry of Environment, Denmark 4.1 IntroductionThis assessment includes a substantial amount of new heavy metals and OC data in Greenland marine biota, which were collected as part of the following AMAP projects: “Biological core programme”, “Temporal time trend programme”, “Contaminants in Greenland human diet”, “Non-halogenated organic Substances in the Greenland Environment”,”Population structure of west Greenland narwhals”, “Population structure of Atlantic minke whales” and “Effects of Contaminants in the Greenland Sea Polar Bear”. Radionuclides were collected in the projects: “ Radionuclides, remaining phase 2 data, 2001”,”Radionuclides 2000”,”Anthropogenic radionuclides in Greenland and the Faroe Islands” and “Thuleundersøgelse-1997”. The description of contaminant levels, spatial trends and short-term temporal trends focuses on the heavy metals Cd and Hg (Se) and on the organochlorines ΣPCB, ΣDDT, ΣHCH, HCB and ΣCHL. Appendices A and B shows descriptive statistic of the new available data of heavy metals and organochlorines, respectively. Stable isotopes have been analysed in order to facilitate the interpretation of levels and trends. The radionuclides focus on 137Cs, 99Tc, 90Sr and 239,240Pu in components of the marine environment and one section deals with plutonium in Bylot Sound in the Thule area because of a nuclear accident here in 1968. Furthermore, one section deals with Pb contamination of seabirds from hunting with lead shot. One section summarizes the use of contaminant signatures beside other signatures (genetic, stable isotopes, fatty acids) to deduce population structure of minke whales and narwhals in Greenland waters. 4.2 Stable isotopesStable-nitrogen and stable-carbon isotope ratios were measured in muscle of ringed seal (Phoca hispida) and black guillemot (Cepphus grylle) (see Table 4.2.1) according to Hobson et al. (1997) at the laboratory of Prairie and Northern Wildlife Research Center, US. Stable isotopes data can be informative about feeding preferences and trophic level (Hobson & Welch, 1995). The reason is that the abundance of •15(15N/14N) in the tissues of consumers is typically enriched over that in their prey owing to the preferential excretion of the lighter 14N during protein transamination and deamination (Hobson & Welch ibid). Different feeding preferences among populations or between years may lead to different levels of bio-accumulating contaminants. Therefore information about stable isotopes is useful when interpretation contaminant levels. Ringed Seal An analysis of covariance (factor: location combined with sampling year, covariate: age allowing different linear relationships between isotopes (
Both Black guillemot Analysis of variance was performed in order to test differences in mean
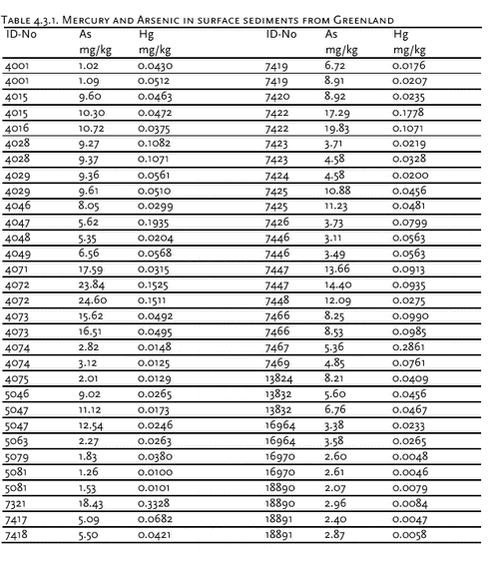
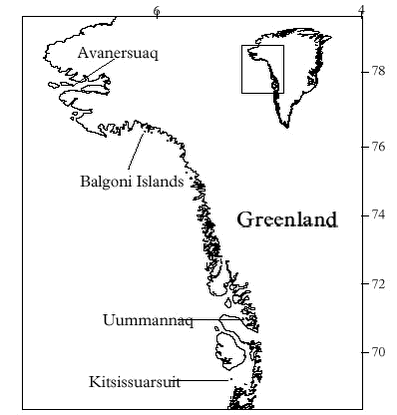
4.3 Heavy metalsIn AMAP phase I, heavy metals were determined in marine sediment, blue mussels (Mytilus edulis), shorthorn sculpin (Myoxocephalus quadricornis), polar cod (Boreogadus saida), glaucous gull (Larus hyperboreus), Icelandic gull (Larus glaucoides) and ringed seals at four locations in Greenland (Riget et al. 2000e). In general, lead levels were found to be low, whereas levels of cadmium, mercury and selenium in Greenland marine biota were high. Cadmium and mercury concentrations increase in higher trophic levels whereas this is not the case for lead and selenium (Dietz et. al. 1996). There was a tendency of higher mercury concentrations in east Greenland, whereas the highest cadmium concentrations were found in central west Greenland (Riget et al. ibid). 4.3.1 Levels and spatial trends4.3.1.1 Arsenic in marine sediments The surface layer of Greenland sediments has been analyzed for arsenic. The background was that very high concentrations of arsenic had been found in some surface sediment from the Pechora Sea (Loring et al. 1995). At a station close to Guba Chernaya the concentration of arsenic was 308 mg/kg. The concentrations decreased seawards from this station to background values of less than 20 mg/kg. Although arsenic data were not available for the other circumpolar sediments, the Pechora Sea Arsenic concentrations were considerably higher than those reported (6 mg/kg) for the Gulf of St. Lawrence sediments. The data indicated that arsenic is enriched in the core samples either by natural and/or anthropogenic processes in the surface and near surface layers. The arsenic correlates with the plutonium derived from nuclear weapons under water tests performed at Guba Chernaya. In a Norwegian AMAP study Maage et al. (unpubl.) found high arsenic concentrations at some locations in the Barents Sea near Svalbard far from nuclear weapon test sites. Concentrations between 50 and 80 mg/kg were regularly found just south of Svalbard. Maage et al. found a mean value of 22 (± 22) mg/kg. Interestingly, looking at the As/Li ratio (mean 0.59 ± 0.42), three of the stations closest to the south tip of Novaya Semlya showed relatively high values with two stations showing higher As/Li-ratios than 1.5. This suggests that a relatively large area around the Noveya Zemlya have elevated As sediment values. The other parts of the Barents Sea as such do not seem to have elevated arsenic in sediments even though high absolute values also were seen along King Carls Land east of Svalbard. The sediment samples from Greenland were collected in the period 1985 to 1994. The top 1cm was analysed for total arsenic by NERI. Loring & Asmund (1996) have previously reported results for several other trace elements in these samples. Analytical results for arsenic and mercury are shown in Table 4.3.1. The average and standard deviation of the arsenic concentrations were 7.87 mg/kg and 5.68 mg/kg. This is much lower than reported by Maage et al. (unpubl.) for the Barents Sea, and comparable to the Gulf of St. Lawrence. The highest concentration found was 24.6 mg/kg. The conclusion is that Greenland marine sediments are not enriched in arsenic as reported for large areas of the Barents Sea. 4.3.1.2 CD Marine fish Seabirds Marine mammals Cd concentrations in ringed seal liver were available from Qeqertarsuaq and Ittoqqortoormiit in 1999 and 2000, and from Avanersuaq 1998. In blubber, Cd concentrations were determined in seal blubber from Qeqertarsuaq in 2000. Cd concentrations in liver ranged from 8.22 mg/kg ww in seals from Qeqertarsuaq in 2000 to 16.8 mg/kg ww in seals from Qeqertarsuaq in 1999. Cd concentrations in seal blubber was low (0.011 mg/kg ww). These values are within the range observed previously in ringed seals (Dietz et al. 1996). Cd concentrations in ringed seals increase with age (Diet et al. 1998). Therefore, seals has been divided into age groups (0, 1-3, 4-6 and above 6 years old) before testing for differences in mean Cd concentrations between Qeqertarsuaq and Ittoqqortoormiit in 1999 and 2000. Cd concentrations were higher for all age groups and both years in seals from Qeqertarsuaq than in seals from Ittoqqortoormiit. However, no significant (at 5% level) differences were found (t-test on logarithmic transformed data, t-test only performed if n>1). The Cd concentrations in seals from Avanersuaq 1998 were similar to those from Ittoqqortoormiit, however, the relative high average age of Avanersuaq seals should be noted. In general, Cd concentrations in ringed seals from west and east Greenland are similar to seals from the Canadian Eastern Arctic but higher than in Alaska and Svalbard. Data of Cd concentrations in narwhals are available from Avanarsuaq, Balgoni Island (Melville Bay), Uummannaq, Kitsissuarsuit (Disko Bay) and Saqqaq (see also chapter 4.7.1).
Cd concentrations in muscle, liver and kidney tissue increase during the first 3 to 4 years of the narwhals life, after which a relatively constant Cd level is observed (a tendency of a slightly decrease can be seen) (Figure 4.3.1). In all tissues (muscle, liver and kidney) the Cd concentrations were significantly higher in females than in males (Riget et al. 2002). A consistent difference between Avanersuaq and Uummannaq was not found in any of the tissues (Figure 4.3.2). In muscle there was significant difference between the samples in 1993 and 1984 from Avanersuaq (Riget et al. 2002). However, the sample in 1985 was not different from the two others. In the sample from Uummannaq 1993, Cd concentrations, especially in females, were higher than in the other samples. Therefore, the year-to-year variation exceeded the geographical differences. In general, the Cd levels in the Greenland narwhals were within the range found in Arctic Canada (Wagemann et al. 1983, 1996).
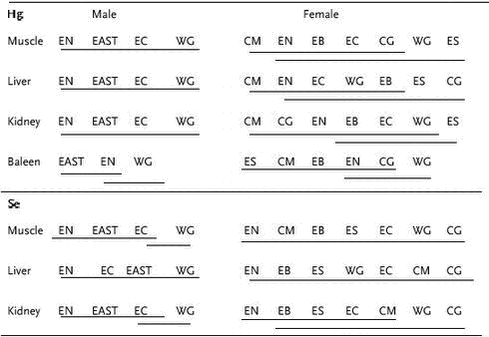
Cd concentrations in blubber of beluga were low (<0.005 mg/kg ww). Cd concentrations in muscle, liver, kidney and baleen of minke whales from the North Atlantic and European Arctic were determined as a part of a multidisciplinary study of population structure of minke whales. Minke whales from west and east Greenland, Jan Mayen, North Sea, Vestfjorden/Lofoten, west Svalbard and the Barent Sea) were included (Born et al. submitted). Only few statistically significant differences among the above mentioned locations were found, however, there were a tendency of Cd concentrations in tissues of Greenland whales to be higher than in whales from the other locations (Born et al. submitted). Cd concentrations in muscle, liver and kidney of polar bears (Ursus maritimus) from Ittoqqortoormiit in 1999 and 2000 have been determined (Appendix A). Cd concentrations in muscle were low (below 0.03 mg/kg ww). In liver, Cd concentrations ranged from 0.73 to 1.82 mg/kg ww) and in kidney from 20.1 to 36.7 mg/kg ww. The Cd levels in all tissues were in the range observed previously (Dietz et al. 2000a). Dietz et al. (ibid) compared Cd levels in polar bears from Avanersuaq with bears from Ittoqqortoormiit and found significantly higher concentrations in liver tissue from Avanersuaq, while no significant difference was found in kidney. Based on age normalised Cd concentrations, a trend could be seen of increasing Cd concentrations in polar bear liver from west Canada to east Canada and west Greenland and then lower Cd levels in east Greenland and Svalbard bears (Dietz et al. 2000a). 4.3.1.3 Hg and Se In this chapter most focus is given to Hg levels. However, in most cases involving determination of Hg in biota, Se levels are also determined. In most Arctic samples, Se is present in a substantial surplus compared to Hg on a molar basis. However, in tissues of marine mammals from Greenland with high Hg concentrations (above approx. 10 nmol/g), a 1:1 molar ratio was found (Dietz et al. 2000b). Se is regarded as an antagonist to Hg and probably Se plays an important role with detoxification of Hg by formation of mercuric selenide complexes (Björkman et al. 1995, Wagemann et al. 1998). Invertebrates Marine fish Seabirds Hg and Se concentrations have been determined in ringed seal, narwhal, beluga, minke whale and polar bear (Appendix A). Hg and Se concentrations in ringed seal liver were available from Qeqertarsuaq and Ittoqqortoormiit in 1999 and 2000 and from Avanersuaq in 1998. In blubber, Hg and Se concentrations were determined in seals from Qeqertarsuaq in 2000. Hg concentrations in liver ranged from 1.78 mg/kg ww in seals from Qeqertarsuaq to 7.13 mg/kg ww in seals from Ittoqqortoormiit. Hg concentrations in seal blubber were very low (<0.005 mg/kg ww). These values are within the range observed previously in ringed seals (Dietz et al. 1996). Hg concentrations in ringed seals increase with age (Diet et al. 1998). Therefore, seals has been divided into age groups (0, 1-3, 4-6 and above 6 years old) before testing for differences in mean Hg concentrations between Qeqertarsuaq and Ittoqqortoormiit in 1999 and 2000. In 1999 no significant (at 5% level) difference in Hg and Se concentrations were found between seals from Qeqertarsuaq and Ittoqqortoormiit, however, for age groups 1-3 and 4-6 years the highest concentrations were found in Ittoqqortoormiit. In 2000, the Hg and Se concentrations were significantly (p<0.01) higher in Ittoqqortoormiit than in Qeqertarsuaq for age group 1-3, which was the only age group allowing statistical testing (t-test on logarithmic transformed data, t-test only performed if n>1). The Hg and Se concentrations in seals from Avanersuaq 1998 were high compared to previously findings in northwest Greenland (Dietz et al. 1996). However, the relative high average age (9.2 years) of Avanersuaq seals and the indication of feeding at a relatively higher trophic level (see chapter 4.2) should be noted. The circumpolar pattern of Hg levels in ringed seal showed the highest levels in Canadian Eastern Arctic, although with high local variability and lower levels in west and east Greenland, Alaska and Svalbard (AMAP unpublished). Data of Hg and Se concentrations in narwhals are available from Avanarsuaq, Balgoni Island (Melville Bay), Uummannaq, Kitsissuarsuit (Disko Bay) and Saqqaq (see also chapter 4.7.1). Hg and Se concentrations in muscle, liver and kidney tissue showed the same relationship with age as shown in Figure 4.3.1 for Cd. In the first 3 to 4 years of the narwhals life the Hg and Se concentrations increase, after which a relatively constant level is observed. Both Hg and Se concentrations in liver were significantly higher in females than in males, while no sex differences were found in muscle and kidney (Riget et al. 2002). As was the case with Cd, no consistent difference between Avanersuaq and Uummannaq was found in either tissue. The between years variation at one location seem to be larger than the variation between location. In general, the Hg and Se levels in the Greenland narwhals were within the range found in Arctic Canada (Wagemann et al. 1983, 1996). Hg and Se concentrations in muscle, liver, kidney and baleen (except Se) of minke whales from the North Atlantic and European Arctic were determined as a part of a multidisciplinary study of population structure of minke whales. Minke whales from west and east Greenland, Jan Mayen, West Svalbard, the Barents Sea, Vestfjorden/Lofoten and the North Sea) were included (Born et al. submitted). Irrespective of gender, Hg and Se concentrations in west Greenland whales were consistently low compared to the other areas (Table 4.3.2). Se and Hg concentrations were positively correlated in all tissues (p<0.001). No significant differences were found of the elements or tissues between west and east Greenland whales. The highest Hg and Se concentrations in most tissues were found in whales from the North Sea and Jan Mayen. Hg and Se concentrations in muscle, liver, kidney and hair (only Hg) of polar bears from Ittoqqortoormiit in 1999 and 2000 have been determined (Appendix A).
Hg concentrations in muscle were lower than in liver and kidney. In liver, Hg concentrations ranged from 4.02 to 16.4 mg/kg ww and in kidney from 8.9 to 29.8 mg/kg ww, lowest in subadult bears. Both Hg and Se levels in muscle, liver and kidney were within the range observed previously (Dietz et al. 2000a). Dietz et al. (ibid) compared Hg and Se levels in polar bears from Avanersuaq with bears from Ittoqqortoormiit and found a tendency of higher Hg and Se concentrations in liver tissue from Avanersuaq. Based on age normalised Hg concentrations, a trend could be seen of increasing Hg concentrations in polar bear liver from Svalbard to east Greenland over west Greenland, peaking in bears from south-west Melville Island. Further eastward the Hg concentrations decreased and the lowest concentrations were found in the Chukchi Sea (Dietz et al. 2000a). 4.3.2 Temporal trend
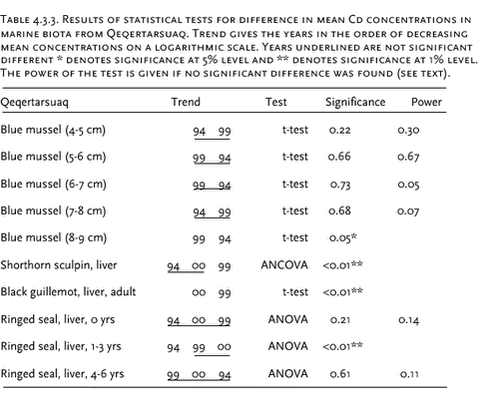
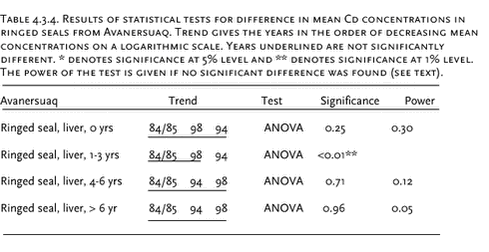
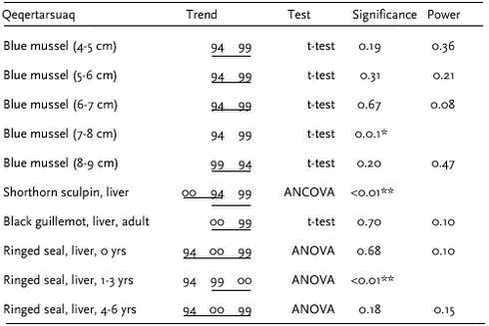
Heavy metal data were logarithmic transformed prior to the statistical analysis. Analysis of covariance was performed in cases were the metals increase with length/age of the animals. Otherwise an analysis of variance or t-test was performed. Pairwise t-test of LSMEAN (least square mean values meaning length adjusted values) or Turkey’s post hoc test was performed to test for differences between years. In case where the statistical test showed no significant difference, the power of the test was estimated according to Cohen (1977). The statistical power is defined as the probability to detect a significant difference. In this case a significance level of 5% is used. 4.3.2.1 Cd Ittoqqortoormiit
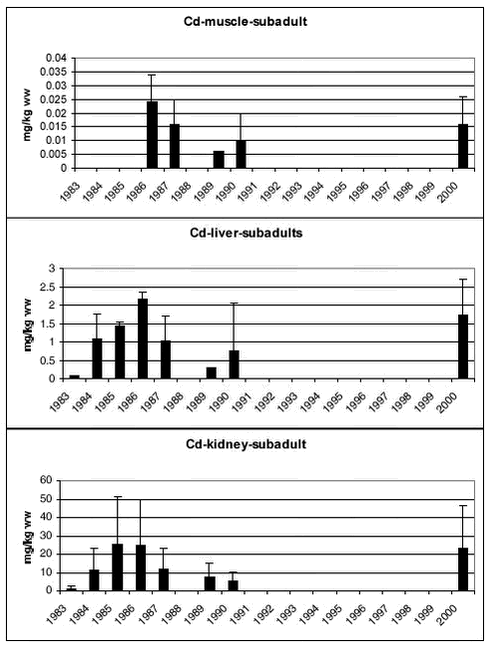
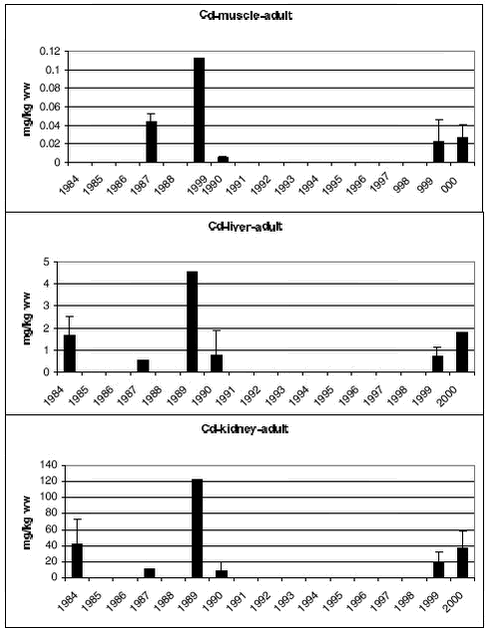
Samples of polar bears tissues have been collected in 5-7 years since 1983. Figure 4.3.3 and 4.3.4 shows mean Cd concentrations in subadult and adult bears, respectively. In both subadult and adult bears no temporal trend is appearent in any of the tissues.
4.3.2.2 Hg
Avanersuaq
Ittoqqortoormiit
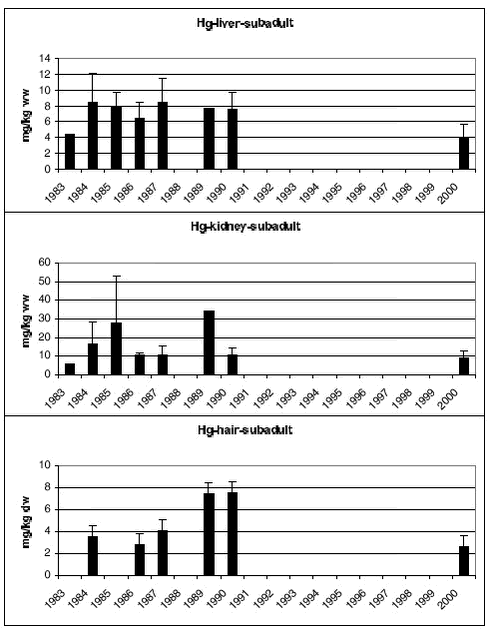
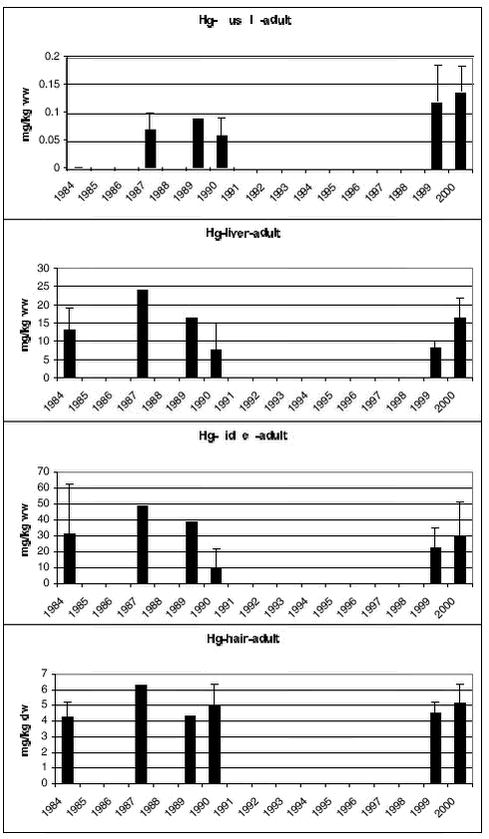
Samples of polar bears tissues have been collected in 5-7 years since 1983. Figure 4.3.5 and 4.3.6 shows mean Hg concentrations in subadult and adult bears, respectively. In both subadult and adult bears no temporal trends is appearent in any of the tissues.
4.4 OrganochlorinesIn AMAP phase I, OCs were determined in marine sediments, blue mussels, shorthorn sculpin, polar cod, glaucous gull, Icelandic gull and ringed seals at four locations in Greenland (Cleemann et al. 2000a,c,d). In general, OC concentrations (except ΣHCH) were higher in the marine biota from east Greenland than from west Greenland. OCs bioaccumulate and the highest concentrations were found in species at the highest trophic levels. 4.4.1 Levels and spatial trendsInvertebrates Fish OCs have been determined in shorthorn sculpin liver from Qeqertarsuaq and Ittoqqortoormiit sampled in 1999 and 2000, and also from the Qaqortoq area in 2000. The relatively high PCB levels found in sculpins from Qaqortoq may be due to local contaminant sources (Vorkamp pers. com.). The ΣPCB-10, ΣDDT, ΣCHL, Seabirds
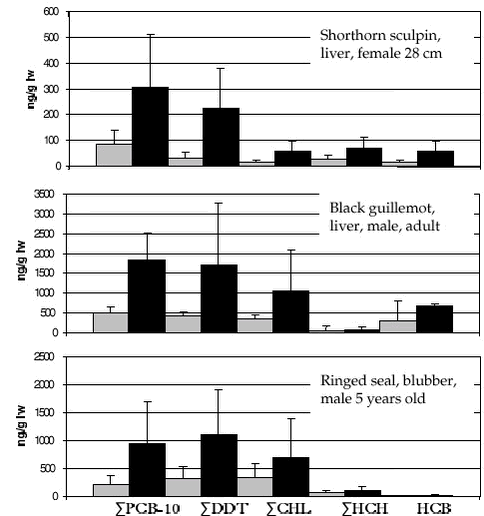
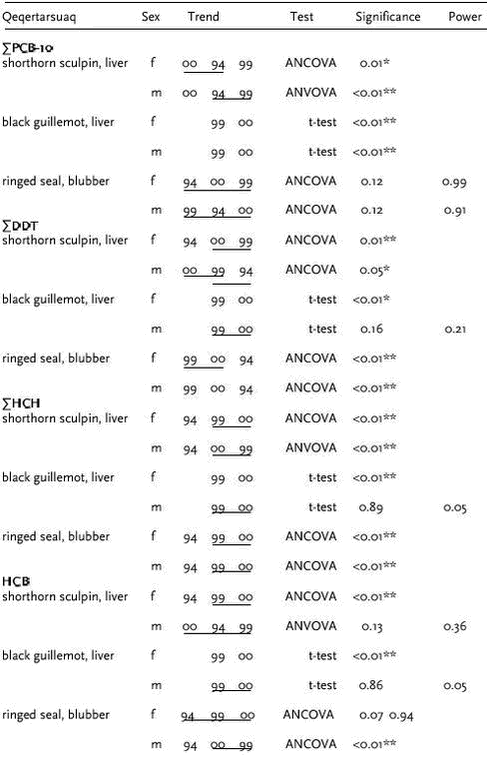
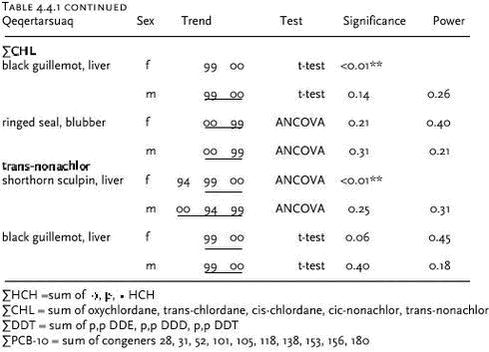
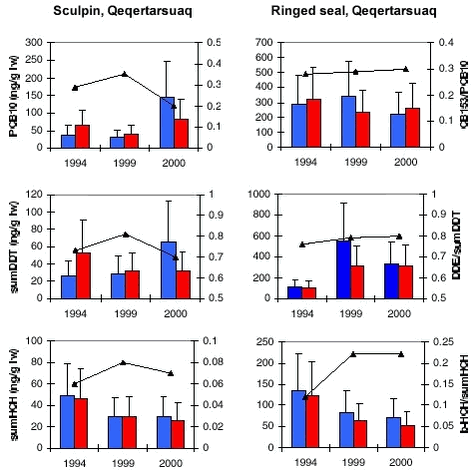
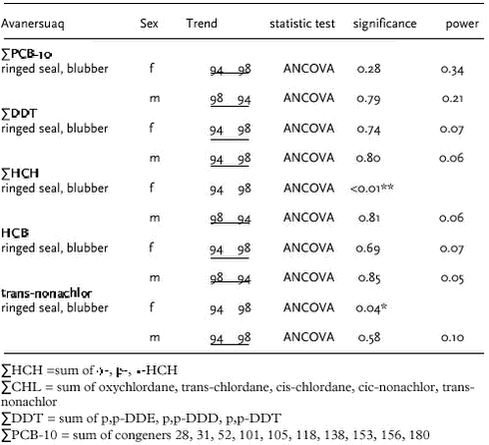
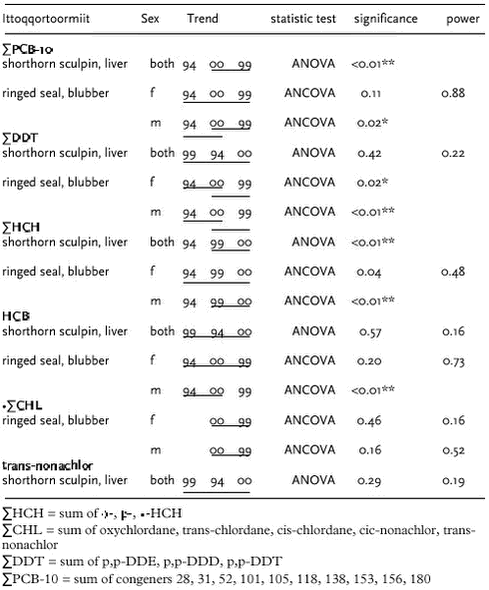
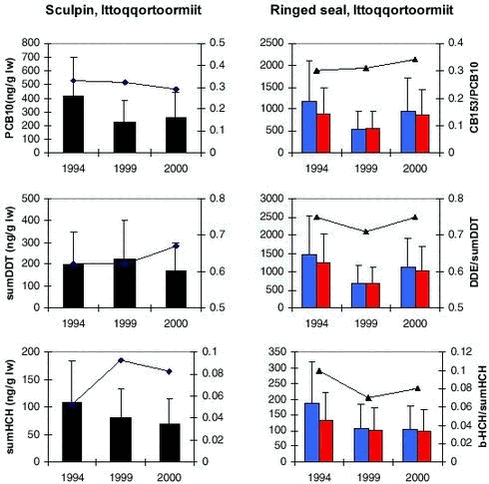
Black guillemot liver and eggs collected in 1999 and 2000 in Qeqertarsuaq (west) and Ittoqqortoormiit (east) were analysed. ΣPCB-10, ΣDDT, ΣCHL, and to lesser extent HCB and HCH levels in birds from east Greenland were higher than in west Greenland (Figure 4.4.1) confirming the spatial trend found previously in glaucous gull (Cleemann et al. 2000d). Marine mammals Ringed seals are not generally considered to be a highly mobile species although some long migrations have been observed (Kapel et al. 1998). Data of OC in ringed seals are available from Qeqertarsuaq, Avanersuaq and Ittoqqortoormiit. In ringed seal, OC levels increase in tissues in the order kidney < liver < muscle << blubber. In general, OC concentrations are higher in male seals than in females, due to elimination of these lipophilic compounds via lactation. The dominant OCs in ringed seal were ΣPCB, ΣDDT and ΣCHL. The OC levels (except ΣHCH) in ringed seals generally were highest in seals from Ittoqqortoormiit, lowest at Qeqertarsuaq and intermediate at Avanersuaq (Appendix B). The higher OC levels in seals from east Greenland than in seals from west Greenland confirms the previous results of AMAP phase I (Cleemann et al. 2000a). However, in that study no difference in OC levels between seals from Qeqertarsuaq and Avanersuaq were found, while in present study seals from Avanersuaq had higher OC levels than seals from Qeqertarsuaq. ΣPCB and ΣDDT showed a circumpolar trend of higher concentrations in ringed seals from The Yenisey Gulf (Russian Arctic), Svalbard and east Greenland than in west Greenland or the Canadian Arctic (Muir et al. 2000a). ΣHCH levels were higher in the Canadian Arctic than in west Greenland, east Greenland and Svalbard (Muir ibid). Data of OC levels in narwhal are available from Avanarsuaq, Balgoni Island (Melville Bay), Uummannaq, Kitsissuarsuit (Disko Bay) and Saqqaq (see also chapter 4.5.1). The dominant OC was toxaphene followed by ΣDDT, ΣPCB and HCB. In general, OC concentrations are higher in males than in females, due to elimination of these lipophilic compounds via lactation following the pattern shown in Figure 5.1.1 for total toxaphene. Based on age normalised OC data on a lipid basic (only males), Riget et al. (2002) found no statistically significant differences in ΣPCB, HCB, and ΣHCH among the locations mentioned above, except Saqqaq (analysis of covariance on logarithmic transformed data). ΣDDT showed significantly higher concentrations in narwhals from Balgoni Island, 1993 than all other location except Kitsissuarsuit, 1990 (Riget et al. 2002). Only few OC data of narwhals exist. Beck et al. (1994) cited in Muir et al. (1999) report on levels in 8 males from Lancaster Sound sampled in 1991. PCB appear to be at a little lower or at the same level in the Greenland samples than in the Canadian samples, whereas ΣHCH and ΣDDT appear to be higher. OC levels in beluga from Saqqaq sampled in 2000 showed similar levels as found in narwhals (Appendix B). As a part of a multidisciplinary study of population structure of minke whales in the North Atlantic and European Arctic (west and east Greenland, Jan Mayen, West Svalbard, the Barents Sea, Vestfjorden/Lofoten and the North Sea), OC levels were determined in blubber from 42 whales from west Greenland and 4 whales from east Greenland (Hobbs et al. in press). The dominant OC was ΣPCB (female mean 2290 µg/kg ww, sum of 102 congeners) followed by ΣDDT (female mean 650 µg/kg ww). Based on the total data available (155 minke whales), ΣPCB and ΣDDT showed significantly higher levels in males than in females, while no significant differences were observed between sex of ΣHCH, ΣCHL and HCB (Hobbs et al. in press). Concentrations of OC groups as ΣPCB, ΣDDT and ΣCHL generally increased from west to east, while ΣHCH showed the opposite trend. Proportions of OC in minke whales did not reveal any major difference among areas except those whales from Greenland waters and the North Sea differed significantly from those from other areas. Blubber of 20 polar bears sampled in Ittoqqortoormiit in 1999-2000 were analysed for OCs. ΣPCB and ΣCHL were the major OCs in blubber of polar bear with mean values of 5983 µg/kg ww and 678 µg/kg ww in female bears (Appendix B). ΣDDT were lower, 282 µg/kg ww in female bears. 4.4.2 Temporal trendVery few data exist to make an assessment of temporal trends of OCs in Greenland biota. In the Greenland AMAP programme biological samples from 1994 and 1999/2000 can be compared. However, data from only two or three years may not give evidence of temporal changes for several reasons, first of all because two or three “data points” are too few. On basis of the results obtained during the Greenland AMAP programme phase I, Riget et al. (2000d) evaluated that a time series of 10-17 years was required to detect a linear trend of 10% per year with a significance of 5% and a power of 80%. Beside the large individual variability in OC levels often observed, a random year to year variability must also be expected. The year to year variability occurs because environmental factors such as temperature, production, prey availability etc. differ between years. Despite these difficulties, it has been found useful to compare OC levels obtained in 1994 (AMAP phase I) with those obtained in 1999/2000. Three laboratories have been involved (NERI, NWOC, GWOC). Therefore it has been necessary to find groups of OCs, which could be compared. These OC groups were: OC data on a lipid basis were logarithmicly transformed prior to the statistical analysis. An analysis of covariance was performed in cases were the compounds increase with length/age of the animals. Otherwise an analysis of variance or t-test was performed. A pairwise t-test of LSMEAN (least square mean values) was performed to test for differences between years. The test was performed for each sex separately if data allowed. In case were the statistical test showed no significant difference, the power of the test was estimated according to Cohen (1977). The statistical power is defined as the probability to detect a significant difference. In this case a significance level of 5% is used. Qeqertarsuaq The OC concentrations in beluga tissues sampled in Saqqaq in 2000 can be compared with samples in Nuussuaq/Disko Bugt from 1989/90 reported by Stern et al. (1994). The comparison can only be indicative because age and sex are unknown for the beluga sampled in 2000. However, the levels of ΣPCB, ΣDDT and ΣCHL appear lower in the recent samples than in the samples from 1989/90.
Avanersuaq Muir et al. (2000b) compared the OC levels in walrus (Odobenus rosmarus) from Avanersuaq sampled in 1978 and 1988. They found significant (p<0.05) increase for ΣHCH in females but no significantly differences for ΣCBz, ΣDDT, ΣPCB. OC levels in males showed no difference between 1978 and 1988 (Muir et al. ibid). A resampling of the Avanersuaq stock would be useful to examine long-term temporal trends of OCs.
Ittoqqortoormiit OC concentrations were determined in 20 polar bears from Ittoqqortoormiit sampled in 1999/2000. Norstrom et al. (1998) analysed OC conceentrations in 18 polar bears sampled in 1990 in Ittoqqortoormiit. The PCB congeners and ΣCHL compounds are not the same in the two studies but they both include the most important ones. In adult males and females levels of ΣPCB and ΣCHL appear to be much lower in 1999/2000 than in 1990 (20-40% of the levels in 1990). No differences were appearent in case of DDE and dieldrin.
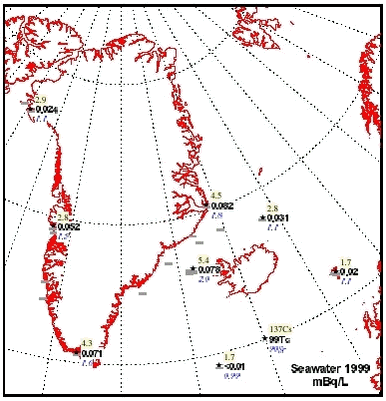
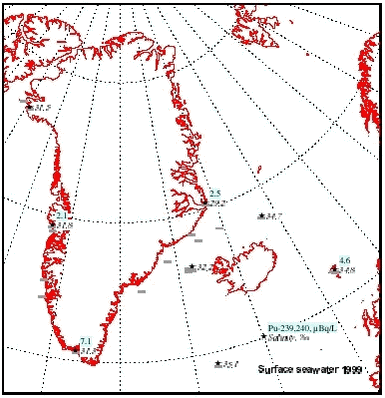
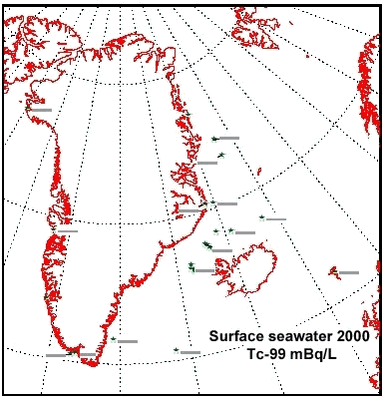
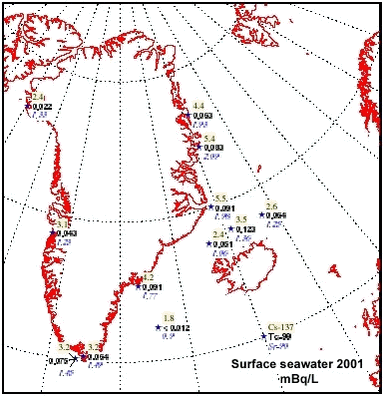
4.5 RadionuclidesArtificial radionuclides have been monitored in the Greenland environment since the 1960’s. The Greenland data have been reviewed in the first Arctic Monitoring and Assessment (AMAP) reports, (Aarkrog et al. 1997; Strand et al.1998). Under the AMAP-II project 1999 – 2002, 137Cs, 90Sr, 239,240Pu and 99Tc have been monitored in selected components of the Greenland marine environment. Furthermore, results from a study in 1997 in Bylot Sound to investigate the fate of plutonium after the 1968 Thule accident is described in chapter 4.5.2. 4.5.1 Levels of 137Cs, 99Tc, 90Sr, and 239,240Pu in components of the marine environmentLarge seawater samples have been obtained by various means – mostly from ship pumps or with buckets from small boats. Biological samples were all from the NERI sampling, i.e. it is the same samples as used for metal and POP analysis. Table 4.5.1 gives average radionuclide concentrations observed in surface seawater samples in 1999. These values and similar data from 2000 and 2001 are furthermore shown in Figures 4.5.1-4.5.4.
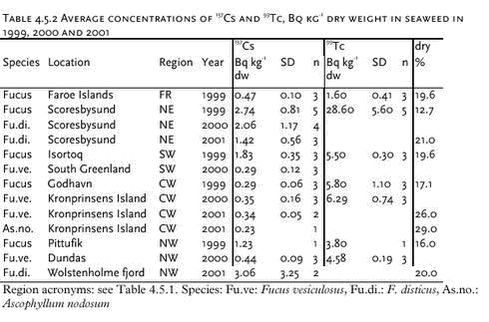
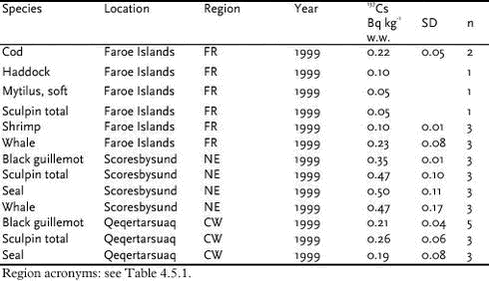
Table 4.5.2 gives average concentrations of 137Cs and 99Tc in seaweed taken 1999, 2000 and 2001 and Table 4.5.3 gives 137Cs concentrations in various edible marine products sampled 1999. The concentrations of several radionuclides in seawater are decreasing in the order northeast Greenland and the coastal East Greenland Current > southwest Greenland > central west Greenland and northwest Greenland >Irmiger Sea ~ Faroe Islands. The same tendency is seen for 137Cs and 99Tc in seaweed and for e.g. 137Cs in seal from east and west Greenland. This is in accordance with long-distance transport patterns from European coastal waters, which are responsible for most of the 99Tc and a large fraction of the 137Cs (Dahlgaard, 1994, Dahlgaard, 1995).
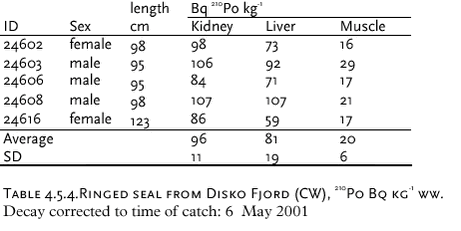
There has been some focus on the levels of 99Tc in seawater and marine products because the British nuclear fuel reprocessing plant Sellafield increased its discharges from 1994 and onwards. From earlier studies (Aarkrog et al. 1983, Dahlgaard et al. 1986, Aarkrog et al. 1987; Dahlgaard, 1994), the 1994-1995 peak discharge may be expected off North East Greenland from year 2000 and onwards. Seawater data for 2000 actually indicated increased levels of 99Tc off NE Greenland (Figure 4.5.3), whereas levels in 2001 seemed to be unchanged. The increased levels in year 2000 samples are probably caused by the increased discharges from Sellafield, but it should be kept in mind that the sampled area is huge and it has not been possible to perform a systematic sampling of the various water masses in the East Greenland Current system. The samples from 1999, 2000 and 2001 are therefore not directly comparable. Shrimp meat samples from southwest Greenland were analysed in 2000, but all results were below detection limits. In normal oxygenated seawater, 99Tc appears mainly as anionic pertechnetate with a low affinity to particles and to most marine organisms except brown macroalgae (Fucus, Ascophyllum) and certain crustaceans such as lobster and shrimp. As a pilot study, liver, kidney and meat from 5 ringed seals caught in Disko Fjord (CW) under NERI’s time-trend programme were analysed for 210Po (Table 4.5.4). 210Po is a naturally occurring alpha-emitter that appears in the 238U decay series after 226Ra, 222Rn and 210Pb, and it is bioaccumulated in aquatic organisms. The present levels are high compared to average global values of 2.4, 15 and 6 Bq 210Po kg-1 (wet weight) in fish, molluscs and crustaceans, respectively, found in an international study (Aarkrog et al., 1997b). That study concluded that 210Po gives rise to a major component of the radiation dose to man from consumption of marine products, but the study did not include marine mammals and doses to Inuits. Consumption of 1 kg of kidney, 1 kg of liver and 4 kg of meat with the present average values would each give a radiation dose around 0.1 mSv. It is thus evident that consumption of fresh seal significantly enhances the natural radiation dose received by Inuits. Canadian caribou holds even higher concentrations in liver and kidney and similar concentrations in meat due to accumulation via lichen (Thomas et al. 1994). 4.5.2 Plutonium in Bylot Sound - The Thule Accident 1968
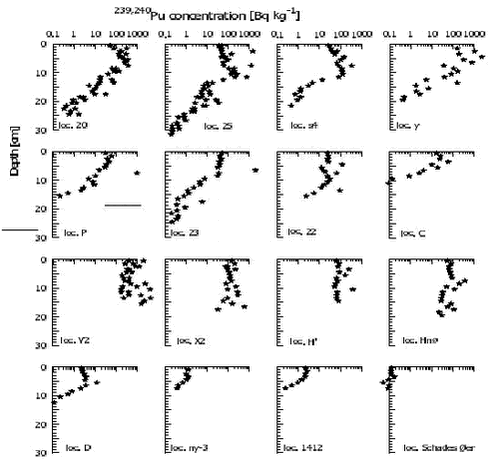
On 21 January 1968, a B-52 aircraft from the US Strategic Air Command crashed on the sea ice of Bylot Sound 11 km west of the Thule Air Base in Greenland. The aircraft disintegrated on impact and an explosion and a fire ensued. The 4 nuclear weapons onboard were destroyed and fissionable material - plutonium and uranium - was dispersed. The benthic marine environment in the 180-230 m deep Bylot Sound was then contaminated with 239,240Pu. The site was revisited August 1997, 29 years after the accident. The following is extracted from Dahlgaard et al. (2001) and Eriksson (2002). 4.5.2.1 Radioactive particles from the Thule accident. The plutonium was present in an insoluble oxide form and mainly associated to particles with an average size of 2 micrometers (U.S.Air Force, 1970). During the months following the accident a clean up program was performed where most of the debris and the contaminated ice was removed from the area. The total amount of plutonium dispersed in the accident was 6 kg of which 3.5 ± 0.7 kg was found on and in the sea ice. Except for an estimated amount of ~1 TBq (~0.4 kg) remaining in the ice after cleaning, most of this plutonium was recovered and shipped to the US (U.S.Air Force, 1970; Strand et al. 1998), i.e., ~3 kg of plutonium may have entered the environment. This amount may be reduced by an unknown amount attached to aircraft debris (Strand et al., 1998). After the accident, the amount of plutonium in the marine sediments in Bylot Sound have been estimated based on samples taken 1970, 1974, 1979, 1984, 1991 and 1997 (Aarkrog, 1971, Aarkrog, 1977, Aarkrog et al. 1984, Aarkrog et al., 1987, Aarkrog et al. 1994, Strand et al. 1998, Eriksson et al. 1999, Dahlgaard et al. 2001). These inventory estimates have been centred on 1 - 1.6 TBq or approximately 0.5 kg. The inhomogeneous nature of the plutonium contamination (Figure 4.5.5) has been noted for many years, but it was earlier assumed not to influence significantly the inventory estimates. The earlier works are solely based on radiochemistry and alpha spectrometry. The hot particles may have been underestimated for two reasons: incomplete dissolution of the particles and in some cases inability to quantify very strong samples because insufficient energy resolution in the alpha spectrometry system used.An improved method to determine the total inventory of a heterogeneously distributed contamination of marine sediments has been described (Eriksson, 2002). The estimate is based on gamma spectrometric screening of the 241Am concentration in 450 one-gram aliquots from 6 sediment cores. The 241Am activity is building up as a decay product of 241Pu (half-life 14.4 yr.) which is present in weapons plutonium as an impurity. Based on radiochemical determination of the plutonium concentration in 20 of these subsamples, the 241Am values are used to estimate the 239,240Pu concentrations. A Monte Carlo programme then simulates a probable distribution of the activity, and based on that, a total inventory is estimated by integrating across the area to 100 km from the point of impact using a double exponential function. Results centre on a total inventory around 9.5 TBq or 3.5 kg 239,240Pu, which is 7 times higher than earlier estimates (0.5 kg). The difference is partly explained by the full inclusion of hot particles in the present methodology. It should however be noted, that only 6 sediment cores are included in the present estimate, and that a large uncertainty is connected to the result. Thus the new result can at the present state not be considered as significantly different from the earlier, although it fits better to the estimate above of the missing 3 kg.
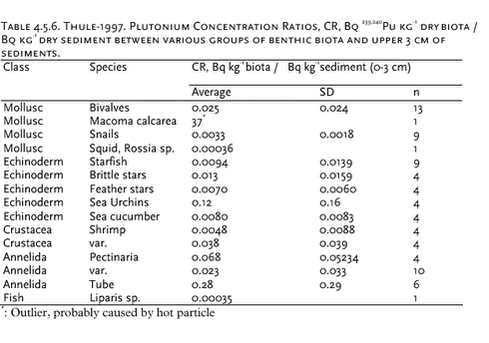
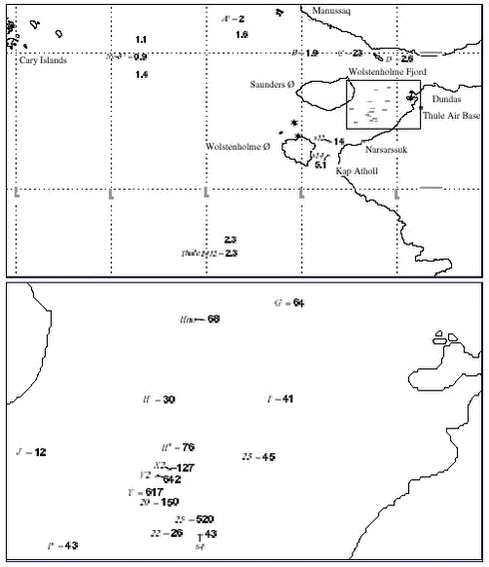
4.5.2.2 Plutonium in water and seaweed. 4.5.2.3 Sediments Plutonium concentrations in surface sediment are shown in Figure 4.5.6. The figure shows that the highest concentrations are centered on the accident site, and it indicates a fairly even distribution in the remaining deep part of Bylot sound, whereas almost fallout background concentrations prevail outside Bylot Sound. The accident site – around location V -with the highest concentrations is situated at water depths of 180 – 230 meters. The two assumed background sites outside Bylot Sound, Ny-3 and 1412, are at depths of 500 and 640 m, respectively. A surface 0-3 cm concentration of 0.12 Bq 239,240Pu kg-1 dry was observed 750 km further south. The surface concentrations outside Bylot sound, locations 1412 and ny-3, are an order of magnitude higher. It is not clear whether this is caused by accident plutonium or it is a natural perturbation caused by differences in sedimentological parameters. At other Arctic marine locations such as the waters south of Spitzbergen, similar levels of plutonium have been ascribed to global fallout. 4.5.2.4 Benthic biota
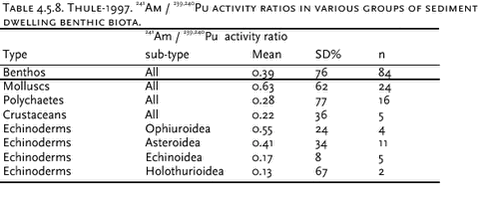
4.5.2.5 Isotope ratios Average isotope ratios, 240Pu / 239Pu atom ratios and 238Pu / 239,240Pu and 241Am / 239,240Pu activity ratios for sediment samples containing more than 20 Bq 239,240Pu kg-1, i.e. at least an order of magnitude above the fallout background, are given in Table 4.5.7. The reference date is the sampling date, i.e. 1997. By comparison of the 241Am / 239,240Pu activity ratios for the sediments (Table 4.5.7) with data for the benthic biota samples (Table 4.5.8), it is seen that some of the biota groups seem to have a higher uptake of americium than of plutonium, especially molluscs and brittle stars (Ophiuroids). A higher affinity for americium than for plutonium in some biota groups is not new. Thus IAEA reported higher CF values for Am than for Pu in molluscs (IAEA, 1985).
Conclusions and recommendations
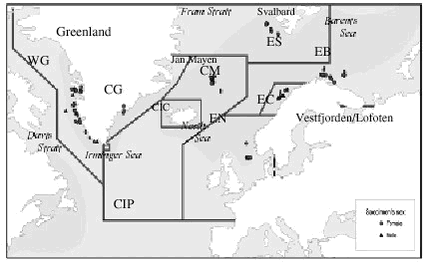
4.6 Lead contamination of Greenland seabirds hunted with lead shotSouthwest Greenland waters are important wintering grounds for seabirds, in particular thick-billed murre (Uria lomvia) and common eider (Somateria mollissima), and during winter substantial numbers, about three hundred thousands, of these two species are killed with lead shot in this region of Greenland. The study referred to here was initiated to assess human lead exposure from eating these birds. Birds killed with lead shot were collected from winter hunting in the Nuuk region (64°N, 51°W), murres in 1998 and common eiders in 2000. Eiders not killed with lead shot were also collected. Each bird was x-rayed and shot pellets were located and counted. Wings, head, tarsus and toes were cut off, the bird was skinned and the viscera were removed. Then each skinned carcass without viscera was boiled according to a recipe often used in Greenland. After boiling, the right pectoral muscle was selected for chemical analysis. If the x-ray photos had shown presence of shot pellets in the muscle, visible pellets were located and removed. We used this procedure to simulate the human lead exposure from eating seabirds in Greenland. After ashing of the entire pectoral muscle in a porcelain crucible, the ash was dissolved in suprapure nitic acid and analysed by AAS. Table 4.6.1 shows the results from the study. As the frequency distribution of data is very skewed, the “bootstrap method” (Efron & Tibshirani, 1993) using 1000 ’resamples’ was chosen to characterize data. 4 single high lead concentrations (above 1000 µg/g ww) were omitted from data treatment, because it was suspected that a whole pellets or large pellet fractions were not detected and removed before analysis. Wingbones from eiders were also analysed, as the lead concentration in bone tissue is considered a good indicator for lead exposure over the lifetime of the individual. The lead level was low, indicating that the eiders only accumulate lead to a small degree and that lead has no toxic effect on the birds. The mean lead concentration 0.73 µg/g ww. in whole murre breasts is 3 to 4 times higher than we found when we analyzed 0.5-1 gram sub samples from the same birds, 0.22 µg/g ww. (Johansen et al., 2001). The 95% confidence limits of the two means overlap, but a contributing explanation of this difference could be that all non-visible lead fragments will be included when the whole breast is analyzed, whereas only a fraction of these fragments is included in the sub sample. Table 4.6.2 compares the Greenland data with similar Canadian and with residue guidelines for lead in Denmark (0.3 µg/g ww (Anon., 2002)) and Canada (0.5 µg/g ww (Scheuhammer et al. 1998)). In murres 11-17% of the observations exceed these residue guidelines, whereas in eiders this is the case for more than half of the birds analyzed. FAO/WHO have established a “Provisional Tolerable Weekly Intake” (PTWI) for lead of 25 µg per kg bodyweight for both adults and children. In general lead levels in Greenland biota is very low, and consequently human lead intake from local food items is also estimated to be low, on average only 15 µg per adult per week (Johansen et al. 2000). However, this estimate does not include any significant contribution from shot pellets, and the use of lead shot in Greenland may increase human lead intake considerably. To illustrate the importance of birds as a dietary lead source we have calculated the lead intake from our analysis of whole breasts. If as an example we consider a meal being 200 gram bird meat, the resulting mean lead intake from such a meal will be 146 µg for murre and 1220 µg for eider. This implies that only one eider meal will result in a lead intake close to the PTWI. For murre the lead intake from one meal will be about 10% of the PTWI. The actual lead intake from birds hunted with lead shot over longer periods will depend on 1) the amount of bird meat per meal, 2) the frequency of bird meals and 3) the lead concentration in the meals. There are not sufficient data to quantify this, but our calculation in the example illustrates that birds hunted with lead shot are a significant lead source and probably the most important single source. The example also indicates that the lead intake must be expected to exceed the PTWI in a number of cases, as both murre and eider are important in the diet, particular in southwest Greenland during winter. 4.7 Contaminant signatures as reflecting population structure4.7.1 West Greenland narwhalsSamples of muscle, liver, kidney, blubber and skin tissues of narwhals from West Greenland collected in the period 1983 to1994 have been analysed for heavy metals, organochlorines, stable isotopes and DNA (Figure 4.7.1) to test a hypothesis that different populations of narwhals in the West Greenland area exist. The obtained results of metal concentrations and DNA were included in the existing database, whereas no previous data on organochlorines and stable isotopes in West Greenland narwhals existed. The results of this study are described in Riget et al. (2002). Metal analysis Organochlorines Stable isotopes Genetic data The population structure with two West Greenland populations suggested by the genetics study could not be supported by the metal and OC concentrations and stable isotopes. 4.7.2 North Atlantic minke whalesIn 1998 samples of tissues of 159 minke whales were collected from: west and east Greenland, Jan Mayen, West Svalbard, the Barents Sea,, Vestfjorden/Lofoten and the North Sea (Figure 4.7.2). Tissues have been analysed for OCs (blubber), elements (muscle, liver, kidney and baleen), stable isotopes (muscle), caesium-137 (muscle), fatty acids (blubber) and genetic studies. The aim of the study was to deduce the population structure of minke whales in the northeast Atlantic and the North Sea. The results of each of the individual studies have been published for OCs (Hobbs et al. in press), element and stable isotopes (Born et al. sumitted, a), caesium-137 (Born et al. submitted, b), fatty acids (Møller et al. submitted) and genetics (Andersen et al. submitted).
The pattern of elements with relatively long biological half life suggested that minke whales have fidelity to certain summer feeding areas at least for several years and the following stocks was inferred: Greenland, Jan Mayen, a northern stock in the Barents Sea, Svalbard and coastal Norway and the North Sea (Born et al. submitted, a). Caesium-137 concentrations also showed differences among the areas, as the significantly highest levels were found in minke whales from the North Sea and the significantly lowest levels in whales from Svalbard (Born et al. submitted, b). The fatty acid composition (a total 43 fatty acids) indicate differences between whales from Greenland (west and east), the Northeast Atlantic and the North Sea (Møller et al. submitted). The genetic study including sequencing of the D-loop in mtDNA and 16 polymorhic nuclear microsatellite markers suggested 4 genetically different sub-populations: a west Greenland, central stock (north of Iceland), northeastern Atlantic and a North Sea sub-population (Andersen et al. submitted). This study also included previous collected samples, in total 306 whales. 4.8 ReferencesAarkrog, A., 1971. Radioecological Investigation of Plutonium in an Arctic Marine Environment. Health Phys. 20: 31-47. Aarkrog, A., 1977. Environmental Behaviour of Plutonium Accidentally Released at Thule, Greenland. Health Phys. 32: 271-284. Aarkrog, A., S. Boelskifte, H. Dahlgaard, S. Duniec, E. Holm & J. N. Smith, 1987. Studies of Transuranics in an Arctic Marine Environment. J. Radioanal. Nucl. Chem. Articles 115: 39-50. Aarkrog, A., E. Buch, Q. J. Chen, G. C. Christensen, H. Dahlgaard, H. Hansen, E. Holm, S. P. Nielsen & M. Strandberg, 1994. Environmental Radioactivity in the North Atlantic Region Including the Faroe Islands and Greenland, 1990 and 1991. Risø-R-622: 88pp. Risø National Laboratory, Roskilde, Denmark Aarkrog, A., H. Dahlgaard & K. Nilsson, 1984. Further Studies of Plutonium and Americium at Thule, Greenland. Health Phys. 46: 29-44. Aarkrog, A., P. Aastrup, G. Asmund, P. Bjerregaard, D. Boertmann, L. Carlsen, J. Christensen, M. Cleemann, R. Dietz, A. Fromberg, E. Storr-Hansen, N. Zeuthen Heidam, P. Johansen, H. Larsen, G. Beyer Paulsen, H. Petersen, K. Pilegaard, M.E. Poulsen, G. Pritzl, F. Riget, H. Skov, H. Spliid, H. Weihe & W. Wählin, 1997. AMAP Greenland 1994-1996. Environmental Project 356: 792 pp. Ministry of Environment and Energy, Copenhagen. AMAP, 1998. AMAP Assessment Report: Arctic Pollution Issues. Arctic Monitoring and Assessment Programme (AMAP), Oslo, Norway. xii+859 pp.. Andersen, L.W., E.W. Born, R.Dietz, T. Haug, N. Øien & C. Bendixen, submitted. Population structure of minke whales (Balaenoptera acutorostrata) from Greenland, the NE Atlantic and the North Sea based on mtDNA-loop and DNA microsatellite variation. Anon., 2002. Bekendtgørelse om visse forureninger i fødevarer. Fødevaredirektoratet 25. marts 2002. Beck, G.G., T.G. Smidt & R.F. Addison, 1994. Organochlorine residues in harp seals Phoca groenlandica from the Gulf of St. Lawrence and Hudson Strait: an evaluation of contaminant concentrations and burdens. Can. J. Zool 72: 174-182 Björkman, L., K. Mottet, M. Nylander, M. Vahter, B. Lind, and L. Friberg, 1995. Selenium concentrations in brain after exposure to methylmercury: Relations between the inorganic mercury fraction and selenium. Archives of Toxicology 69: 228-234. Born, E.W., P. Outridge, F. F. Riget, K.A. Hobson, R. Dietz, N. Øien & T. Haug submitted, a..Stock Structure of North Atlantic Minke Whales (Balaenoptera acutorostrata) Inferred from regional Variation of Elemental and Stable Isotopic Signatures in Tissues. Born, E.W., H. Dahlgaard, F. F. Riget, R. Dietz, N. Øien & T. Haug submitted, b. Regional variation of caesium-137 in minke whales Balaenoptera acutorostrata from West Greenland, the North Atlantic and the North Sea Cleemann, M., F. Riget, G.B. Paulsen, J.de Boer & R. Dietz, 2000a. Organochlorines in Greenland ringed seals (Phoca hispida). Sci. Total Environm. 245: 103-116. Cleemann, M., F. Riget, G.B. Paulsen, J. Klungsøyr & R. Dietz, 2000c. Organochlorines in Greenland marine fish, mussels and sediment. Sci. Total Environm. 245: 87-102. Cleemann, M., F. Riget, G.B. Paulsen, & R. Dietz, 2000d. Organochlorines in Greenland glaucous gulls (Larus hyperboreus) and Icelandic gulls (Larus glaucoides). Sci. Total Environm. 245: 117-130. Cohen. J., 1977. Statistical power analysis for the behavioural sciences. 2nd ed. Hilsdale NJ USA: Lawrence Erlbaum Associates 567 pp. Dahlgaard, H., Q. J. Chen, S. Stürup, M. Eriksson, S. P. Nielsen & A. Aarkrog, 1999. Plutonium Isotope Ratios in Environmental Samples From Thule (Greenland) and the Techa River (Russia) Measured by ICPMS and a-Spectrometry. IAEA-TECDOC-1094 International Symposium on Marine Pollution, Monaco, 5-9 October 1998: 254-259. IAEA, Vienna, Austria Dahlgaard, H., M. Eriksson, E. Ilus, T. Ryan, C. A. McMahon & S. P. Nielsen, 2001. Plutonium in the Marine Environment at Thule, NW-Greenland After a Nuclear Weapons Accident. Kudo, A. Plutonium in the Environment. Radioactivity in the Environment 1, 2nd Invited International Symposium "Plutonium in the Environment". Osaka, Japan, Nov. 9-12, 1999.: 15-30. Elsevier Science Ltd., UK Dietz, R., F. Riget & P. Johansen, 1996. Lead, cadmium, mercury and selenium in Greenland marine animals. Sci Total Environm. 186 : 67-93 Dietz, R., P. Paludan-Müller, CT Agger & CO. Nielsen, 1998. Cadmium, mercury, zinc and selenium in ringed seals (Phoca hispida) from Greenland waters. NAMMCO Sci. Contrib : 242-273 Dietz, R., F. Riget & E.W. Born, 2000a. Geographical differences of zinc, cadmium, mercury and selenium in polar bears (Ursus maritimus) from Greenland. Sci Total Environm. 245 : 25-47. Dietz, R., F. Riget, and E. Born, 2000b. An assessment of selenium to mercury in Greenland marine mammals. Science of the Total Environment 245: 15-24. Efron, E. & J. Tibshirani, 1993. An introduction to the bootstrap. Chapman & Hall. ISBN 0-412-04231-2. Eriksson, M., 2002. On Weapons Plutonium in the Arctic Environment (Thule, Greenland). Risø-R-1321: 150pp. Risø National Laboratory, Eriksson, M., H. Dahlgaard, E. Ilus, T. Ryan, Q. J. Chen, E. Holm & S. P. Nielsen, 1999. Plutonium in the Marine Environment Off Thule Air Base, N.W. Greenland. Inventories and Distribution in Sediments 29 Years After the Accident. Strand, P. and Jølle, T. 4th International Conference on Environmental Radioactivity in the Arctic. Edinburgh 20-23 SEP 99: 60-62. NRPA, Norway Falk, K. & F. Merkel, 2001. Embedded lead shots in Common and King Eiders wintering in West Greenland. Field Report. Ornis Consult and Greenland Institute of Natural Resources, 14 pp. + App. FAO/WHO, 1993. Evaluation of certain food additives and contaminants. WHO Technical Report Series No. 837. Hobbs, K.E., D.C.G. Muir, E.B. Born, R. Dietz, T. Haug, T. Metcalfe, C. Metcalfe & N. Øien, in press. Levels and patterns of persistent organochlorines in minke whale (Balaenoptera acutorostrata) stocks from the North Atlantic and European Arctic. Environ Poll. Hobson, K.A. & H.E. Welch, 1995. Cannibalism and trophic structure in a high Arctic lake: Insights from stable-isotope analysis. J. Fish. Aquat. Sci. 52: 1195-1201 Hobson, K.A., J.L. Sease & J.F. Piatt, 1997. Investigating trophic relationships of pinnipeds in Alaska and Washington using stable isotope ratios of nitrogen and carbon. Marine Mammal Science 13(1): 114-132 IAEA. 1985. Sediment Kds and Concentration Factors for Radionuclides in the Marine Environment. STI/DOC/10/247: 73pp. International Atomic Energy Agency, Vienna Johansen, P., G. Asmund & F. Riget, 2001. Lead contamination of seabirds harvested with lead shot - implications to human diet in Greenland. Environmental Pollution 112: 501-504 Johansen, P., T. Pars & P. Bjerregaard, 2000. Lead, cadmium, mercury and selenium intake by Greenlanders from local marine food. Sci.Total Environ. 245: 187-194 Johansen, P., G. Asmund & F. Riget, 2001. Lead contamination of seabirds harvested with lead shot – implications to human diet in Greenland. Environ. Pollut. 112: 501-504 Kapel, F.O., J. Christiansen, M.O. Heide-Jørgensen, T. Härkönen, E.W. Born, L.Ø. Knutsen, F. Riget & J. Teilmann, 1998. Netting and conventional tagging used to study movements of ringed seals (Phoca hispida) in Greenland. NAMMCO Scientific Publications 1: 211-228 Loring, D.H. & G. Asmund, 1996. Major and trace-metal geochemistry of Greenland coastal and fjord sediments. Environ. Geol 28: 2-11 Loring, D.H.,K. Naes, S.Dahle, G.G. Matishov & G.Illin, 1995 Arsenic, trace metals and organic micro contaminants in sediments from the Pechora Sea, Russia. Marine Geology, 128: 153-167 Maage,A., K. Stange & J. Klungsøyr (unpubl.). Trace elements in fish and sediments from the Barents Sea. Draft report to AMAP. McMahon, C. A., L. León Vintró, P. I. Mitchell & H. Dahlgaard, 2000. Oxidation-State Distribution of Plutonium in Surface and Subsurface Waters at Thule, Northwest Greenland. Appl. Radiat. Isot. 52: 697-703. Mitchell, P. I., L. L. Vintro, H. Dahlgaard, C. Gasco & J. A. Sanchezcabeza, 1997. Perturbation in the Pu-240/Pu-239 Global Fallout Ratio in Local Sediments Following the Nuclear Accidents at Thule (Greenland) and Palomares (Spain). Sci. Total. Environ. 202: 147-153. Muir, D., F. Riget, M. Cleemann, J. Skaare, L. Kleivane, Haruhiko Nakata, R. Dietz, T. Severinsen & S. Tanabe, 2000a. Circumpolar Trends of PCBs and Organochlorine Pesticides in the Arctic Marine Environment Inferred from Levels in Ringed Seals. Environ. Sci. Technol. 34: 2431-2438. Muir, D.C.G., E.W. Born, K.Koczansky & G.A. Stern, 2000b. Temporal and spatial trends of persistent organochlorines in Greenland walrus (Odobenus rosmarus rosmarus). Sci. Total Environ 245 1-3: 73-86 Møller, P., E.W. Born, R. Dietz, T. Haug, D. Ruzzante & N. Øien, submitted. Differences in fatty acid composition of blubber in minke whales (Balaenoptera acutorostrata) from Greenland, the NE Atlantic Ocean and the North Sea, 1998. Nielsen, C.O. & R. Dietz, 1989. Heavy metals in Greenland seabirds. Meddr. Grønland, Bioscience, 29: 26 pp. Norstrom, R.J., S.E. Belikov, E.W. Born, G.W. Garner, B. Malone, S. Olpinski, M.A. Ramsay, S. Schliebe, I. Stirling, M.S. Stishov, M.K. Taylor & Ø. Wiig, 1998. Chlorinated Hydrocarbon Contaminants in Polar Bears from Eastern Russia, North America, Greenland, and Svalbard: Biomonitering of Arctic Pollution. Arch. Environ. Contam. Toxicol. 35: 354-367 Riget, F., P. Johansen & G. Asmund, 1996. Influence of length on element concentrations in blue mussels (Mytilus edulis). Mar. Pollut. Bull. 32: 745-751 Riget F, R. Dietz & P. Johansen, 1997. Zinc, cadmium, mercury and selenium in Greenland fish. Med. Grønl Bioscience 48, 29 pp Riget, F., R. Dietz & M. Cleemann, 2000d. Evaluation of the Greenland AMAP programme 1994-1995, by use of power analysis (illustrated by selected heavy metals and POPs). Sci Total Environ 245: 249-259 Riget, F., R. Dietz, P. Johansen & G. Asmund, 2000e. Lead, cadmium, mercury and selenium in Greenland marine biota and sediments during AMAP phase 1. Sci. Total Environ 245: 3-14 Riget, F., R. Dietz, P. Møller, M. Glasius, P. Pallsbøl, & K. Hobson, 2002. Population structure of West Greenland narwhals. A multidiciplinary approach. NERI Technical Report No. 400, 53 pp. Riget, F. & R. Dietz, 2000f. Temporal trends of cadmium and mercury in Greenland marine biota. Sci. Total Environm. 245: 49-60 Ryan, T. P., H. Dahlgaard, A. M. Dowdall, D. Pollard, E. Ilus, M. Eriksson & J. D. Cunningham, 1999. The Uptake of Plutonium by Some Marine Invertebrates in a Contaminated Zone of Bylot Sound, Thule, Northern Greenland. Strand, P. and Jølle, T. 4th International Conference on Environmental Radioactivity in the Arctic. Edinburgh 20-23 SEP 99: 74-75. NRPA, Norway SAS Institute Inc., 1999-2001. Version 8e. North Carolina, Cary Scheuhammer, A.M., J.A. Perrault, E. Routhier, B.M. Braune, B.M. & G.D. Campell, 1998. Elevated lead concentrations in edible portions of game birds harvested with lead shot. Environ.Pollut. 102: 251-257 Stern, G.A., C.G. Muir, M.D. Segstro, R. Dietz & M.P. Heide-Jørgensen, 1994. PCB’s and other organochlorine contaminants in white whales (Delphinapterus leucas) from West Greenland: variation with age and sex.Meddr. Grønland, Bioscience, 39: 245-259 Strand, P., M. Balonov, A. Aarkrog , M. J. Bewers, B. Howard, A. Salo & Y. S. Tsaturov,. 1998. AMAP Assessment Report: Arctic Pollution Issues. Chapter 8: Radioactivity. Arctic Monitoring and Assessment Programme (AMAP), Oslo, Norway U.S.Air Force. 1970. Project Crested Ice. USAF Nuclear Safety 65: 1-97. Wagemann, R., N.B. Snow, A. Lutz & D.P. Scott , 1983. Heavy metals in tissues and organs of narwhals (Monodon monoceros). Can. J. Fish. aquat. Sci. 40:206-214. Wagemann, R., S. Innis & P.R. Richards, 1996. Overview and regional and temporal differences of heavy metals in Arctic whales and ringed seals in the Canadian Arctic. Sci. Total Environ. 186(1,2): 41-67. Wagemann, R., L. Lochart, M. Kinsley, S. Innes, & G. Bolia, 1998. Methylmercury and heavy metals in tissues of narwhal, beluga and ringed seals. Synopsis of Research Conducted under the 1997/98 Northern Contaminants Program. NCP Minister of Indian Affairs and Northern Development, Ottawa, ON, Canada. 204-209 pp. |
