Ship emissions and air pollution in Denmark
2 Emissions
- 2.1 Introduction
- 2.2 AIS data provided by DaMSA
- 2.3 Vessel data provided by Lloyds
- 2.4 Engine types, fuel types and average engine life times
- 2.5 Traffic forecast
- 2.6 Engine load functions
- 2.7 Fuel consumption and emission factors
- 2.8 Calculation procedure
- 2.9 Results for fuel consumption and emission
- 2.10 Results: Spatial distribution
2.1 Introduction
This chapter provides a comprehensive description of the methodology applied for constructing the detailed AIS-based emission inventories of ship emissions, which form the basis for the further calculations. The inventories are for the years 2007, 2011 and 2020. Furthermore, the chapter summarises results.
After a brief overview of the entire approach, the subsequent sections provide details.
For the 'AIS inventory area' defined in Figure 1.1, AIS data have been requested from the Danish Maritime Safety Administration (DaMSA; in Danish: Farvandsvæsenet). In order to calculate fuel consumption and emissions for ships in the area, these data are used together with vessel technical information from Lloyd’s Register, engine load functions provided by DTU (Technical University of Denmark), and general fuel consumption and emission factors provided by NERI. In order to facilitate the inventory calculations, assumptions are also made regarding fuel type used, engine types and average engine life times.
For each single vessel in the AIS dataset, ship category, engine type, fuel type, main engine and auxiliary engine size are determined using the technical data from Lloyds Register and supplementary information from DTU and MAN Diesel. The vessel sailing speed is found between each AIS signal, and the instantaneous engine load is calculated from basis functions (representing five common ship classes), using main engine size and vessel sailing speed as input.
The fuel consumption and emissions from each vessel during the time between two consecutive AIS signals are calculated by combining engine size, engine load, time duration between the AIS signals, and fuel consumption/emission factors corresponding to the vessel’s engine and fuel type. The baseline results are calculated for the year 2007, and results for the prognosis years 2011 and 2020 are obtained by using forecasted fuel consumption/emission factors from NERI and expectations for sea traffic growth from Danish Ship-owners' Association.
2.2 AIS data provided by DaMSA
AIS signals represent a huge amount of data. In order to restrict the volume of data, a limited area around Denmark (Figure 1.1) was appointed as being of primary interest, and only data from that area were requested from DaMSA. Furthermore, in order to represent the year 2007, not all data for the entire year was considered. The present project uses 12 two-days periods, one period for each month, representing both weekend days and normal working days. The following AIS data are used: Vessel IMO and MMSI codes, call sign, time of AIS signal, and latitude-longitude coordinates. For each ship, the sailing speed between two AIS signals is calculated from the time between the signals, and the corresponding latitude-longitude registrations.
Table 2.1 shows the selected date and day combinations for the different months in 2007, and the corresponding percentage of AIS signals (from the DaMSA dataset) pertaining to identified ships, and the number of ships that could be identified as entries in Lloyd’s Register’s technical database. The total number of AIS signals in DaMSA data is 15.725 mio. (not shown), and the total percentage of identification is 79 %. Based on information from Lloyd's (pers. comm., A. Halai, Lloyds Register, 2009) the unidentified ships are assumed to be merely small sized vessels. Thus, it is well known that many modern pleasure craft have AIS systems installed. Consequently, the bias introduced in the subsequent fuel consumption and emission calculations is regarded as marginal.
Click here to see: Table 2.1 Days selected for AIS data capture.
Figure 2.1 displays the number of ships for each month’s 48-hour period. The number of ships varies to some extent from period to period; however, the range of variation is limited. The same conclusion can be drawn from the corresponding fuel consumption results shown in Figure 2.7 in section 2.9. Based on these observations it is considered a reasonable assumption that the total number of signals obtained from DaMSA for the time periods in question can be extrapolated to cover a full year by using a multiplication factor of 365/24, and that this will result in a reasonably reliable estimate of fuel consumption and emissions from the subsequent inventory calculations.
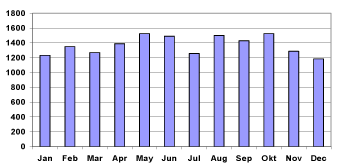
Figure 2.1 Number of ships for each month’s 48-hour period in DaMSA data, identified as entries in the Lloyd’s Register’s technical database.
2.3 Vessel data provided by Lloyds
Relevant technical data for each ship is found by linking the vessel's IMO and MMSI codes and call sign from AIS data to the technical registrations from Lloyd’s Register’s database. The latter data consists of main engine size, engine stroke type (2-stroke/4-stroke), vessel flag and general ship category. The information on general ship category is used to group the vessels into five ship classes (representative types) for which engine load functions can be established (c.f. section 2.6). The Lloyd’s ship categories and the representative ship classes are shown in Annex A.
2.4 Engine types, fuel types and average engine life times
From Lloyds' database a distinction between 2-stroke and 4-stroke engines as well as gas turbine engines is given. It is necessary to further allocate these data into the general engine types: Gas turbine, slow speed, medium speed and high speed engines for which fuel consumption and emission data are available. The following table shows the applied classification, which is based on information from MAN Diesel (pers. comm., Flemming Bak, 2009) and Winther (2008).
Table 2.2 Estimated main engine type and fuel type for ship engines in the present inventory
| Engine type | Engine size | Engine type | Fuel type | Engine life time |
| (Lloyd’s Register) | (kW) | (estimated) | (estimated) | (years, estimated) |
| Gas turbine | Gas turbine | Diesel | 30 | |
| 2-stroke | Slow speed (2-stroke) | HFO | 30 | |
| 4-stroke | <= 1000 | High speed (4-stroke) | Diesel | 10 |
| 1000-4000 | Medium speed (4-stroke) | Diesel | 30 | |
| > 4000 | Medium speed (4-stroke) | HFO | 30 |
2.5 Traffic forecast
The Danish Ship-owners' Association was requested to provide a forecast for the development in ship traffic for the present study. The Association expects that in 2011 the amount of traffic will be back at the 2007 level after a decrease related to the current financial crisis (pers. comm. Jacob Clasen, Danish Ship-owners' Association, 2009). In recent years there has been a large annual growth in traffic of around 5 %. However, in the second part of 2008 the traffic began to decrease due to the global financial crisis, and the expectation is that this drop in sea transport activity will not become outbalanced until 2011.
From 2011 to 2020 the Danish Ship-owners expect an annual traffic growth of between 3-4 % for goods carrying vessels, and hence 3.5 % is used in the present survey. The traffic levels for passenger ships are expected to be the same as for 2007.
2.6 Engine load functions
An extensive database with ship data is maintained by Hans Otto Kristensen (Senior researcher, DTU[²]). As part of the present project, H.O. Kristensen has used this database to produce basic equations for service speed (Vs) as a function of main engine service power (Ps). Technical data from a large number of vessels (in brackets) form the base for the equations for the five most common ship categories: Container ships (240), Tankers (199), Bulk Carriers (74), Ro-Ro cargo (59) and Ro-Ro passenger ships (91). The direct data source is the Royal Institution of Naval Architects. Since 1990 they have annually published technical details for around 50 ships of all classes and types in their publication series “Significant Ships” (http://www.rina.org.uk). The latter source of information is regarded throughout the maritime community as the most reliable source of information of technical data directly linked to individual vessels (pers. comm. Hans Otto Kristensen, DTU, 2009).
For data validation purposes, a comparison was made between the proposed speed – power relations from DTU, and regression functions that could be obtained from the Swedish ShipPax database for Ro-ro cargo ships (870 ships), and from Lloyd’s Register’s technical database for container ships (5150 ships). A perfect match between regression curves was found in both situations (DTU, 2009).
The speed–power relations for each of the five ship categories are represented by the curves in Figure 2.2. The curves are estimated based on regression analysis, and hence they are well suited as input data for fuel consumption and emission inventories comprising groups of vessels. The curve values cannot be used directly for specific ships, since in the individual case the speed power relations to some extent differ from the general curves.
In a few cases Ps for other ship categories than Ro-Ro passenger ships are smaller than the lower limit for Ps on the curves depicted in Figure 2.2, and hence, for ships with such small engines the service speed cannot be directly deduced from the curves in Figure 2.2. Instead, in these situations the function for Ro-Ro passenger ships is used as an approximate approach.
Based on experience, the necessary engine power (Pcal) for ship propulsion at an observed sailing speed (Vs) is found by adjusting the engine service power (PS) with the observed:service speed ratio to the 3rd power:
![]()
Finally, the engine load percentage, %MCR, is expressed as:
![]()
If the calculated %MCR exceeds 100%, %MCR is set to 100%.
2.6.1 Auxiliary power in use
For the ship categories: Container ships, Tankers, Bulk Carriers, Ro-Ro cargo the installed auxiliary power is expressed as a function of main engine size in the state of the art AE-ME functions agreed by IMO MEPC (Marine Environment Protection Committee) at its 59th meeting (IMO MEPC, 17 August 2009). The AE-ME equations have been developed by DTU, and the underlying data base is fuel consumption data reported by large shipping companies. Prior to the IMO MEPC 59th meeting, the AE-ME data was provided by DTU (2009) for use within the present inventory:
AE = 5% ME, ME < 10000 kW (3)
AE = 250 kW + 2.5% ME, ME > 10000 kW (4)
For Ro-Ro passenger ships the installed auxiliary power is estimated to be 20% of the ships main engine size, based on queries from the database kept by DTU.
For all ship categories, the average auxiliary engine load is assumed to be 50% (pers. comm. Hans Otto Kristensen, DTU, 2009).
2.7 Fuel consumption and emission factors
Generally, the fuel consumption and emission factors in g/kWh depend on to engine type, fuel type and engine production year.
2.7.1 Specific fuel consumption
The standard curves for specific fuel consumption, sfc (g/kWh), are shown in Figure 2.3 for slow-, medium- and high-speed engines, as a function of engine production year. For gas turbines, a mean fuel consumption figure of 240 g/kWh is used. All fuel consumption data come from the Danish TEMA2000 emission model (Ministry of Transport, 2000), and are based on the engine specific fuel consumption data from several engine manufacturers (pers. comm. Hans Otto Kristensen, DTU, 2009).
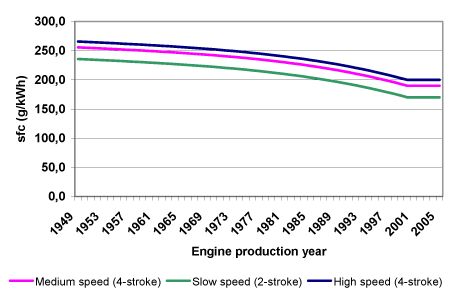
Figure 2.3 Specific fuel consumption for marine engines related to the engine production year (g/kWh)
Considering the fuel consumption trend graph in Figure 2.3, the first part of it applies to engines manufactured up until the mid 1990’s, and was produced in the late 1990s for the Danish TEMA 2000 model. Because the regression curve is supported by actual fuel consumption factors for these engines, this part of the graph is regarded as being the most accurate. For newer engines, the fuel consumption trend is established based on expert judgement. The graph is, however, still regarded as valid in relation to its use in estimating emission for engines in the situation which prevails today (pers. comm. Hans Otto Kristensen, DTU, 2006). The sfc figures for 2005 are used for engines built from 2006 onwards to provide the basis for the fuel consumption calculations for future years.
Using the average engine life times, LT, listed in Table 2.2, the average sfc factors per inventory year, X, is calculated from:

Where sfc = specific fuel consumption (g/kWh), X = inventory year, k = engine type, y = engine production year, LT = engine life time.
The average sfc factors per inventory year are shown in Figure 2.4 for the inventory years 2000-2020.
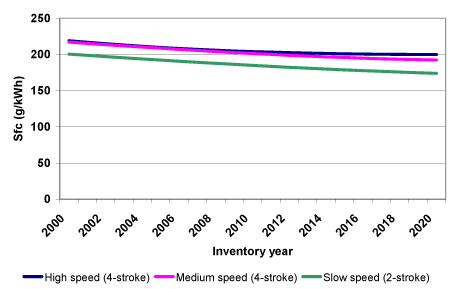
Figure 2.4 Average sfc factors for marine engines for the inventory years 2000-2020 (g/kWh)
2.7.2 NOx emission factors
2.7.2.1 IMO emission regulations for NOx
For seagoing vessels, NOx emissions are regulated as explained in Marpol 73/78 Annex VI, formulated by IMO (International Maritime Organisation), and further, amendments to MARPOL Annex VI has been agreed by IMO in October 2008. A three tiered emission regulation approach is considered, which comprises the following:
- Tier I: Diesel engines (> 130 kW) installed on a ship constructed on or after 1 January 2000 and prior to 1 January 2011.
- Tier II: Diesel engines (> 130 kW) installed on a ship constructed on or after 1 January 2011.
- Tier III[³]: Diesel engines (> 130 kW) installed on a ship constructed on or after 1 January 2016.
The NOx emission limits for ship engines in relation to their rated engine speed (n) given in RPM (Revolutions Per Minute) are shown in Table 2.3.
Table 2.3 Tier I-III NOx emission limits for ship engines (amendments to MARPOL Annex VI)
| NOx limit | RPM (n) | |
| Tier I | 17 g/kWh 45 x n-0.2 g/kWh 9,8 g/kWh |
n < 130 130 ≤ n < 2000 n ≥ 2000 |
| Tier II | 14.4 g/kWh 44 x n-0.23 g/kWh 7.7 g/kWh |
n < 130 130 ≤ n < 2000 n ≥ 2000 |
| Tier III | 3.4 g/kWh 9 x n-0.2 g/kWh 2 g/kWh |
n < 130 130 ≤ n < 2000 n ≥ 2000 |
Following the IMO emission regulations, the NOx Tier I limits are also to be applied for existing engines with a power output higher than 5000 kW and a displacement per cylinder at or above 90 litres, installed on a ship constructed on or after 1 January 1990 but prior to 1 January 2000.
2.7.2.2 NOx emission factors for engines built before 2006
The NOx emission factors (g/kWh) for slow- and medium-speed engines are obtained from MAN DIESEL (2006). With a global market share of 75%, MAN Diesel is by far the world’s largest ship engine manufacturer, and hence in terms of representativity, the emission factors are well suited as input for inventory emission calculations comprising many ships. For a relevant year of comparison, 2000, Winther (2008) finds a good accordance between the MAN Diesel emission factors and from other important studies (Whall et al. 2002; Endresen et al. 2003) per engine type. The concordance is the best for slow speed engines which is the most dominant source for NOx emissions.
The NOx emission factors provided by MAN Diesel for slow- and medium speed engines are shown in Figure 2.5, together with NOx emission factors for high-speed engines. For gas turbines, a mean NOx emission factor of 4 g/kWh is used. The emission information for high-speed engines and gas turbines comes from the Danish TEMA2000 emission model (Ministry of Transport, 2000). For high speed engines the emission factor level is determined by Kristensen (2006) through discussion with relevant engine manufacturers, considering engine operation at a normal engine speed range (1000 RPM) for high speed ferries. For high speed engines build in 2000, the NOx emission factor from Figure 3.4 fits with the IMO Tier I emission standard derived from the relevant equation in Table 3.2.
The increase in fuel efficiency up to year 2000 caused the NOx emission factors to increase. However, in the beginning of the 1990s (for slow-speed engines) and by the end of the 1990s (for medium-speed engines), NOx emission performance is improved, mainly due to improved engine design. The emission improvements are of a sufficient size to enable the IMO Tier I NOx emission requirements in 2000 to be met.
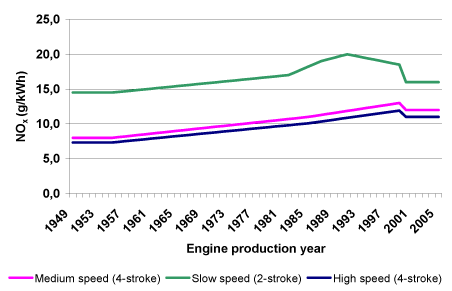
Figure 2.5 NOx emission factors for ship engines built before 2006 (g/kWh)
2.7.2.3 NOx emission factors for engines built from 2006 onwards
The Tier III requirements for new ships built after 2016 will apply in designated NOX Emission Control Areas (NECA). It is assumed that the AIS inventory area is appointed a NECA.
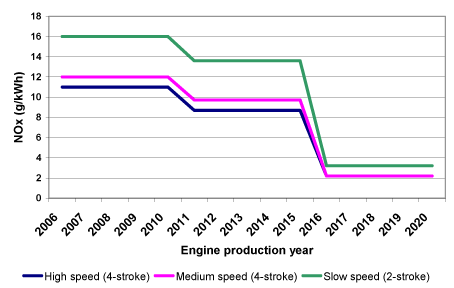
Figure 2.6 NOx emission factors for ship engines built from 2006 onwards (g/kWh)
Thus, for newer engines in compliance with Tier II (2011) and Tier III (2016) emission standards, emission factors are estimated by adjusting the Tier I emission factors (2000-2005) in two steps, relative to the Tier II:Tier I and Tier III:Tier I ratios. The estimated emission factors for the engine production years 2006-2020 are shown in Figure 2.6.
2.7.2.4 The effect of IMO NOx emission requirements for engines built from 1990 and prior to 2000
For slow speed engines, the new Tier I emission standards for existing engines built from 1990 to 1999 are somewhat lower than the emission factors actually measured by MAN Diesel. As mentioned in section 2.7.2.2, most of the ship engines today are built by MAN Diesel, and from their side it is expected that 75% of all slow speed engines built between 1990 and 1999 in the 7500-22500 kW segment will become retrofitted with more emission efficient slide valves in order to meet the IMO emission standards. Other engine sizes will also be considered at a later stage.
The slide valves are designed in a way which improves fuel atomization, penetration and mixing in the engine combustion chamber. On the same time engine performance adjustments are made (pers. comm. Michael F. Pedersen, MAN Diesel, 1999). The retrofit scheme is envisaged to take place following a linear time schedule from 1st of July 2011 to 1st of July 2016.
The retrofit emission effect is incorporated in the present inventory in similar way so that emission factors for 1990-1999 engine production years are gradually being replaced by Tier I emission factors, going from 0% to 100% representation between 1st of July 2011 and 1st of July 2016.
The correction factor KR is found as:
![]()
Where:
k = engine type (slow speed)
X = Inventory year, X = [2011;2020]
P = Main engine size (ME), P = [5000 kW;22500 kW]
y = engine production year, y = [1990;1999]
Outside the criteria for k, y, P and X, KR = 1.
2.7.2.5 Average NOx emission factors per inventory year
The average NOx emission factors take into account engine production year, average engine life times and the 2011-2016 retrofit scheme, as explained in the previous sections. It thus assumes that the sea area considered is appointed a NECA area, so Tier III regulations will apply after 2016.
Using the average engine life times listed in Table 2.2, the average NOx emission factors per inventory year, X, is calculated from:

Where EF = emission factor (g/kWh), X = inventory year, k = engine type, y = engine production year, LT = engine life time.
For the inventory years 2007, 2011 and 2020 the average NOx emission factors are shown in Annex II for ship category/engine type combinations, and with/without retrofit.
2.7.3 SO2
In relation to the sulphur content in heavy fuel and marine gas oil used by ship engines, Table 2.4shows the current legislation in force, and the amendment of MARPOL Annex VI agreed by IMO in October 2008. These sulphur contents are also used in the present inventory.
Table 2.4 Current legislation in relation to marine fuel quality
| Legislation | Heavy fuel oil | Gas oil | |||
| S-% | Impl. date | S-% | Impl. date | ||
| EU-directive 93/12 | None | 0.2¹ | 1.10.1994 | ||
| EU-directive 1999/32 | None | 0.2 | 1.1.2000 | ||
| EU-directive 2005/33² | SECA - Baltic sea | 1.5 | 11.08.2006 | 0.1 | 1.1.2008 |
| SECA - North sea | 1.5 | 11.08.2007 | 0.1 | 1.1.2008 | |
| Outside SECA’s | None | 0.1 | 1.1.2008 | ||
| MARPOL Annex VI | SECA – Baltic sea | 1.5 | 19.05.2006 | ||
| SECA – North sea | 1.5 | 21.11.2007 | |||
| Outside SECA | 4.5 | 19.05.2006 | |||
| MARPOL Annex VI amendments | SECA’s | 1 | 01.03.2010 | ||
| SECA’s | 0.1 | 01.01.2015 | |||
| Outside SECA’s | 3.5 | 01.01.2012 | |||
| Outside SECA’s | 0.5 | 01.01.2020³ | |||
| Notes: ¹Sulphur content limit for fuel sold inside EU ²From 1.1.2010 fuel with a sulphur content higher than 0.1 % must not be used in EU ports for ships at berth exceeding two hours ³ Subject to a feasibility review to be completed no later than 2018. If the conclusion of such a review becomes negative the effective date would default 1 January 2025 |
|||||
From 2006/2007[4], the SECA areas enter into force. The current inventory for 2007 assumes that the SECA regulations have been in place for the entire year of 2007, so a fuel sulphur content of 1.5% is used for heavy fuel oil in 2007. In 2011 and 2016 the sulphur content gradually become lower, as prescribed by the IMO fuel standards.
In order to obtain emission factors in g/kWh, the sulphur percentages from Table 2.5 are inserted in the following expression:
![]()
Where EF = emission factor in g/kWh, S% = sulphur percentage, and sfc = specific fuel consumption in g/kWh. The sfc factor is taken from equation 5.
Equation 1 uses 2.0 kg SO2/kg S, the chemical relation between burned sulphur and generated SO2 provided in EMEP/CORINAIR (2007).
2.7.4 PM
For diesel fuelled ship engines the emission of particles (primary particles - see Chapter 4 for details on secondary particles) depends on the fuel sulphur content, S%. The emission factors in g/kg fuel are calculated as:
![]()
The PM emission factor equation is experimentally derived from measurements made by Lloyd’s (1995). taken from TEMA2000 (Trafikministeriet, 2000).
Subsequently, the PM emission factor in g/kWh is found from:
![]()
Based on information from MAN DIESEL (N. Kjemtrup, 2006), the PM10 and PM2.5 shares of total PM (=TSP) are 99 and 98.5%, respectively.
The PM emission factors are experimentally derived from measurements made by Lloyd’s (1995). The latter source make up the basis for most of the inventories and methodology descriptions carried out so far on an international level, and hence the PM emission factors corresponds well with the input data used by e.g. the global inventories set up by Corbett and Koehler (2003) and Endresen et al. (2003), the inventory made for Europe by Whall et al. (2002), the European calculation methodology description from the MEET project (Georgakaki et al. 2004) as well as the EMEP/CORINAIR guidebook methodology (EMEP/CORINAIR 2009). The PM emission factors from Lloyds’ (1995) are also used in the Danish TEMA2000 emission model (Ministry of Transport, 2000).
2.7.5 CO and VOC
In general the emission factors for CO and VOC in g/kWh are regarded as very uncertain. The general experience from the ship engine manufacturer's side is a decrease in CO and VOC when fuel efficiency improves (pers. comm. S. Henningsen, MAN Diesel, 2006). However, due to missing consistent emission data as a function of engine year, constant factors for all engine production years are chosen for the present inventory. The emission factors originate from the emission measurement programme carried out by Lloyds (1995).
As for PM, the CO and VOC emission factors from Lloyd’s (1995) make up the basis for most of the inventories and methodology descriptions carried out so far internationally, and in this respect corresponds well with the emission factors used by e.g. the global inventories set up by Corbett and Koehler (2003) and Endresen et al. (2003), the inventory made for Europe by Whall et al. (2002), the European calculation methodology description from the MEET project (Georgakaki et al. 2004) as well as the EMEP/CORINAIR guidebook methodology (EMEP/CORINAIR 2009). One source however, Eyring et al. (2005), use factors which are considerably higher for VOC and somewhat lower for CO.
The CO and VOC emission factors from Lloyds’ (1995) are also used in the Danish TEMA2000 emission model (Ministry of Transport, 2000).
The CO and VOC emission factors are given in Table 2.5.
Table 2.5 CO and VOC emission factors
| Slow speed | Medium speed | High speed | Gas turbines | |
| (g/kWh) | (g/kWh) | (g/kWh) | (g/kWh) | |
| CO | 1.6 | 1.6 | 1.6 | 0.1 |
| VOC | 0.5 | 0.5 | 0.5 | 0.35 |
2.7.6 CO2
For CO2, the emission factors in g/kWh are calculated as:
![]()
The CO2 emission factors (g/MJ) are country specific (heavy fuel: 78 g/MJ; gas oil: 74 g/MJ) and come from the Danish Energy Authority (DEA). LHV = Lower heating value in MJ/kg (heavy fuel: 40.9; diesel: 42.7).
2.8 Calculation procedure
For each ship, the fuel consumption and emissions are found by summarising the product of engine load (%MCR), main engine size (kW), AIS signal time interval (s), and fuel consumption/emission factor (g/kWh):
![]()
Where E = fuel consumption/emissions (g), %MCR = engine load (%), Δt = sailing time between AIS signal (s), PME = main engine size (kW), EF = fuel consumption/emission factor in g/kWh, i = AIS signal interval, k = fuel type, l = engine type, X = calculation year.
The fuel consumption factor inserted in (12) is taken from (5), and the emission factors are taken from (7), (8) (10) and (11), for NOx, SO2, particulates and CO2, respectively, and Table 2.6 in the case of CO and VOC.
2.9 Results for fuel consumption and emission
The variation in fuel consumption totals for each month’s 48-hour period is shown in Figure 2.8 (c.f. Section 2.2). Some differences in the estimates appear from period to period, but the range of variations is moderate. Taking into account also the moderate fluctuations for number of ships present in the AIS inventory area for the same time periods (Figure 2.1), the conclusion is that a reasonably reliable full year inventory estimate can be obtained from the sum of the twelve periods by adjusting this sum with a multiplication factor of 365/24.
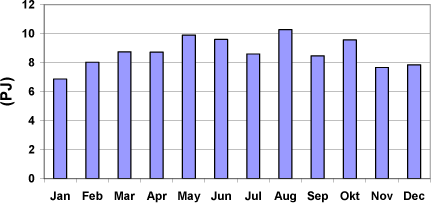
Figure 2.7 Fuel consumption from ships calculated using AIS data. Each column represents fuel consumption during a 48-hour period in the AIS inventory area (as depicted in Figure 1.1).
The resulting fuel consumption and emission estimates for the inventory years 2007, 2011 and 2020 are shown per ship type in Table 2.6. The presented results for the passenger Ro-Ro ship category consist of contributions from several vessel types, used for e.g. fishing, dredging research, towing/pushing and off shore activities (c.f. Annex 1).
Click here to see: Table 2.6 Fuel consumption and emissions per ship type
Figure 2.8 shows the fuel consumption and emission totals for the inventory years 2007, 2011 and 2020.
The 15 % increase in fuel consumption (and CO2 emissions) from 2007 to 2020 is a product of the envisaged growth in sea traffic and the gradually improved fuel efficiency for newer engines in historical years. The expected traffic growth for goods carrying vessels is around 36 % from 2007 to 2020, whereas sailing activities with passenger ships is expected to remain on the same level for the same period.
For SO2 and PM (all size fractions, primary particles) the reductions of the sulphur content lead to significant emission reductions. From 2007 to 2020[2011], the SO2 emission reductions are 91 % [36 %] whereas the PM reductions (all size fractions) are 54 % [31 %].
For NOx a marginal increase in total emissions of 2% is expected from 2007 to 2020. Without stricter emission standards the increase would have corresponded to the increase in fuel consumption, i.e. 15%. Thus, calculated on average the effect of IMO regulations is a reduction in the NOx emissions of 11% per unit of fuel. The reductions in the average NOX emission factor will continue after 2020.
The emission factors of VOC and CO are kWh based, and are assumed to be constant for all inventory years, and hence the increase in total emissions of around 25 % from 2007 to 2020 reflects the traffic projections.
In Figure 2.9 the calculated fuel consumption and emission shares of SO2, NOx and primary PM2.5 per ship type are shown for 2007, 2011 and 2020.
Today passenger ships is the largest source of fuel consumption and emissions of SO2 and primary PM2.5 (and CO2, CO and VOC; not shown) with shares of around one third of the calculated totals. However, from 2007/2011 these shares drop to one fourth in 2020, due to the underlying traffic composition in these years. As an end result, container ships become the largest source of fuel consumption and emissions in 2020.
For NOx, passenger ships, containers and tankers have almost the same emission shares in 2007 and 2011. However, due to the increase in traffic for goods transportation vessels from 2007/2011 to 2020, the relative fuel consumption and emission importance for container and tanker ships become larger than for passenger ships in 2020.
The fuel consumption and emission results are shown in even further details for the different ship type/fuel type combinations in Table 2.7.
In 2007 (and 2011) the calculated heavy fuel oil share of the total fuel consumption is 82 %. The corresponding emission shares are even higher being mostly pronounced for SO2 (97 %) and PM (92 %; all size fractions) due to the higher sulphur content for heavy fuel oil.
In 2020 the heavy fuel oil share has marginally changed to 81 %, but due to the significant reduction of the sulphur content for this fuel type, the emission shares of SO2 and PM2.5 become similar to those of fuel consumption.
Click here to see: Table 2.7 Fuel consumption and emissions per ship type and fuel type
In Figure 2.10 the fuel consumption and emissions of SO2, NOx and PM2.5 are shown as totals per flag state for the twelve 48 hour periods in 2007 that constitute the basis for the AIS inventory. The flag state nominations Denmark (DIS) and Norway (NIS) refer to ships included in secondary registers which a number of countries have established.
Open registers are essentially registers which have a loose interpretation of the link between a ship and the state whose flag it flies and which, accordingly, hold themselves "open" to ships from any country. They are subject to the same international rules as all flag states but they may offer beneficial tax arrangements. Standards of safety and environmental protection vary and are often subject to less strict control than under traditional national registers (pers. comm. E. Thompson, Lloyds Register, 2009).
Table 2.8 shows the data underlying Figure 2.10. The table lists percentage values and includes totals, grouped for EU countries and non-EU countries. It appears that 64% of the fuel consumption in the AIS inventory area can be attributed to ships from EU states.
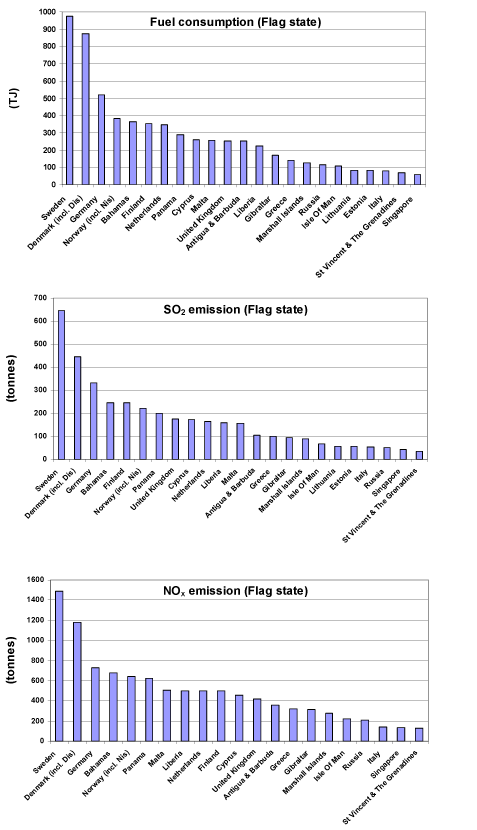
Figure 2.10 Fuel consumption and emissions of SO2and NOx are shown as totals per flag state for the twelve 48 hour periods in 2007. The values refer to the AIS inventory area of Figure 1.1. The graph for PM2.5 resembles the SO2 graph and has been omitted.
2.10 Results: Spatial distribution
Figure 2.11 shows GIS based maps of fuel consumption and the emissions of SO2, NOx, VOC, CO, TSP, PM10, and PM2.5 for 2007, 2011 and 2020, respectively.
A general overview of the sea traffic around Denmark can be obtained by following the main passages of ships from east to west on the maps depicted in Figure 2.11.
From the inner Baltic Sea (Bothnian Bay), the main traffic passes through the waters between Bornholm and the south coast of Sweden. Considerable parts of the sea traffic go towards Lübeck/Kieler Kanal in Germany, or alternatively follow the shipping lane in the Great Belt strait between Zealand and Fuhnen. Another big part of the vessel movements are through the Øresund strait.
In Kattegat the two major shipping lanes unite (Anholt) and proceed to the tip of Jutland (Skagen). From this point most of the traffic passes south-west along the west coast of Jutland. Also very visible are the major Danish domestic ferry routes and the ferry routes connecting Denmark, Sweden, Germany and Poland.
In Figure 2.11, the previously explained emission developments from 2007 to 2020 are most visible for SO2 and PM2.5. As mentioned above, the emission reductions are due to the gradually lower sulphur content in the fuels used for navigation purposes.
Click here to see: Figure 2.11 - continued. Emissions of NOX, CO2 and VOC.
[2] Department of mechanical engineering, Section of coastal, maritime and structural engineering
[3] For ships operating in a designated Emission Control Area. Outside a designated Emission Control Area, Tier II limits apply.
[4] 2007 is used as the effective year in the inventory
Version 1.0 October 2009, © Danish Environmental Protection Agency