Survey of Chemical Substances in Consumer Products, No. 102, 2009
Survey and Health Assement of the exposue of 2-year-olds to chemical substances in Consumer Product
Contents
- 2.1 2-year-olds
- 2.2 Toys for 2 year-olds
- 2.3 Relevant substances
- 2.4 Relevant products
- 2.5 Endocrine disrupters
- 2.6 Combination effects
- 2.7 Allergens
3 Selected substances and products
- 3.1 Quantitative risk assessment of potential endocrine disruptors
- 3.2 Exposure to other substances with potentially harmful effects
- 3.3 Literature review
- 3.4 Selection of products for screening
- 3.5 Screening results
- 3.6 Tier 1 exposure assessment
- 3.7 Identified substances with potential endocrine disrupting properties
- 3.8 Literature review of endocrine disruptors
- 3.9 (Q)SAR predictions for substances with potential endocrine disrupting effects
- 3.10 Conclusion on the identification of substances with potentially endocrine disrupting effects
- 3.11 Identified substances with allergenic effects
- 3.12 Literature review of allergens12
- 3.13 Chemical substances identified in the screening with classification for other effects harmful to health
- 4.1 Toys
- 4.2 Textiles
- 4.3 Statutory order on cosmetics
- 4.4 Pacifiers
- 4.5 General regulations for limitations on use of certain substances
- 4.6 Foodstuffs, assessment of pollution from EFSA (European Food Safety Authority)
- 5.1 Delimitation
- 5.2 General conditions of the survey
- 5.3 Outdoor clothes
- 5.4 Footwear
- 5.5 Pacifiers[13]
- 5.6 PVC bath soap packaging
- 5.7 Non-slip figures and bath mats
- 5.8 Soft toys
- 5.9 Diapers
- 5.10 Sunscreens
- 5.11 Moisturising creams/ oil-based creams/lotions.
- 5.12 Bed linen
- 6.1 Analyses
- 6.2 Exposure scenarios
- 6.3 Outdoor clothes (jackets and mittens)
- 6.3.1 Summary of results
- 6.3.2 Description of product type
- 6.3.3 Selected products
- 6.3.4 Analyses methods
- 6.3.4.1 X-ray analysis
- 6.3.4.2 GC/MS analysis, extractable organic substances
- 6.3.4.3 Spectrophotometer analysis of formaldehyde.
- 6.3.4.4 ICP-MS and GC/MS for organotin compounds
- 6.3.4.5 Quantitative GC/MS analysis for perfluorous compounds
- 6.3.4.6 GC/MS analysis, migration studies for organic compounds
- 6.3.4.7 HPLC analyses and migration studies for TDI and MDI
- 6.3.5 Results of initial analyses
- 6.3.6 Quantitative analyses and migration studies
- 6.4 Footwear
- 6.5 Pacifiers
- 6.6 Soap packaging
- 6.7 Non-slip figures and mats
- 6.8 Soft toys
- 6.9 Diapers
- 6.10 Bed linen
- 6.11 Overview of quantitative analyses and migration analyses
- 7.1 Selection of dose factors (NOAELs and LOAELs)
- 7.2 Use of assessment factors
- 7.3 Exposure scenarios - Method
- 7.4 Calculation of risk - method
- 7.5 Significant sources of exposure
- 7.5.1 Indoor climate
- Gunnersen et al. (2009) state that the greatest exposure to PCB used in building joints occurs due to realease to the indoor air. Gunnersen et al. (2009) conclude that although primarily non-dioxin-like PCBs are released to the indoor air, there will also be exposure to dioxin-like PCBs. The relevance of this finding should be considered in view of the fact that there is always more or less concomitant exposure to non-dioxin-like PCBs and dioxin-like PCBs.
- The present report focusses on the dioxin-like PCBs because there is documented evidence of their endocrine disrupting effects.
- 7.5.2 Other sources of exposure
- 7.5.1 Indoor climate
- 7.6 Calculation of exposure
- 7.7 Risk assessment of the individual substances
- 7.7.1 DIBP, di-isobutyl phthalate, 84-69-5
- 7.7.2 DBP, dibutyl phthalate, 84-74-2
- 7.7.3 BBP, benzyl butyl phthalate, 85-68-7
- 7.7.4 DEHP, diethylhexyl phthalate, 117-81-7
- 7.7.5 DINP, di-isononyl phthalate, 28553-12-0
- 7.7.6 Prochloraz, 67747-09-5
- 7.7.7 Tebuconazole, 107534-96-3
- 7.7.8 Linuron, 330-55-2
- 7.7.9 Vinclozolin
- 7.7.10 Procymidone
- 7.7.11 Dioxins and dioxin-like PCBs
- 7.7.12 Non-dioxin-like PCBs
- 7.7.13 DDT
- 7.7.14 Propyl-, butyl-, and isobutylparaben
- 7.7.15 Bisphenol A, 80-05-7
- 7.8 Cumulative risk assessment of potential endocrine-like substances
Appendix A: Chemical substances in sunscreens
Appendix B: Chemical substances in moisturising creams, oil-based creams and lotions
Foreword
The project on investigation of the exposure of 2 year-olds to chemical substances through contact with consumer products was carried out from July 2008 to September 2009.
The present report describes the results of this project, including a survey of the products as well as chemical analyses and risk assessments of a number of selected products that 2 year-old children come into contact with throughout the course of a day.
A total of 12 product groups were included in the survey phase. Selected products from 10 of these product groups were subsequently included in a screening phase and several problematic substances were subjected to quantitative analysis.
Risk assessment was also performed for a number of problematic substances.
The results of this report will be followed up by an information campaign primarily targeting parents and grandparents of 2 year-old children. This information campaign will be launched during calendar week 43, 2009.
This project has been carried out through a cooperation between the Danish Consumer Council, Operate, FORCE Technology, DHI and the Danish Technological Institute.
Project management was undertaken by Kasper Westphal Pedersen, area director and communications advisor at Operate, and Kathe Tønning M.Sc. (Arch.) of the Danish Technological Institute.
Analyses were performed by Eva Jacobsen, Laboratory Manager and Eva Pedersen, Consultant, from the Danish Technological Institute; and Marianne Strange B.Sc. Ph.D from FORCE Technology. Risk assessments were performed by Pia Brunn Poulsen MSc (Polytechnical) from FORCE, Lise Møller MSc (Biology), and Helle Buchardt Boyd MSc (Food sciences) from DHI.
Operate’s communications advisor Michael Minter participated as executive supervisor for the information campaign. Environmental policy representative Claus Jørgensen from the Danish Consumer Council participated.
The project was followed up by an advisory group consisting of
Shima Dobel, Danish Environmental Protection Agency
Tina Wissendorff, Danish Environmental Protection Agency
Kathe Tønning, Danish Technological Institute
The project is funded by the Danish Environmental Protection Agency.
Summary and conclusions
Since 2001 an extensive series of projects have been carried out to evaluate the risks inherent in use of various product groups. These projects focused primarily on peoples’ exposure to chemical substance from individual products. The primary objective in the current project has been to look at the total exposure of the 2 year-old child to chemical substances over the course of one day.
Two-year-olds are exposed to many chemical substances in daily life. Furthermore, they are particularly susceptible due to their physical size (large surface area/small volume). The primary focus will be on consumer products, but because the 2 year-old’s exposure to chemical substances involves not only food products but also food contact materials and articles, focus has also been placed on these sources. Exposure from indoor air and dust has also been evaluated based on existing measurements.
The project will result in an information campaign intended to disseminate the report’s conclusions and provide active advice. The primary target group for the campaign is parents and grandparents who are in daily contact with 2 year-olds, but the project is also expected to have a knock-on effect on Danes in general, raising awareness of their chemical exposure in daily life and generating an understanding that it is possible to reduce unnecessary exposure to chemicals.
Several substances were selected and focussed on in the risk assessment. They were selected for their known endocrine disrupting effects in animal studies, and an anticipated exposure of 2 year-old children to these substances through food products, indoor air and dust, or consumer products. The following substances were selected:
Antiandrogens (androgen antagonists):
- DEHP (di-ethyl-hexyl-phthalate) (117-81-7)
- DINP (di-iso-nonyl-phthalate) (68515-48-0)
- DBP (di-butyl-phthalate) (84-74-2)
- DIBP (di-iso-butyl-phthalate) (84-69-5)
- BBP (butyl-benzyl-phthalate) (85-68-7)
- Prochloraz (67747-09-5)
- Tebuconazole (107534-96-3)
- Linuron (330-55-2)
- Vinclozolin (50471-44-8)
- Procymidone (32809-16-8)
- PCBs (poly-chlorinated-biphenyls)
- Dioxins
- DDTs/DDDs (dichloro-diphenyl-trichlorethane/dichloro-diphenyl-dichloroethene).
Oestrogen-like:
- Propylparaben (94-13-3)
- Butylparaben (94-26-8)
- Isobutylparaben (4247-02-3)
- Bisphenol A (80-05-7).
Initially the following substances were investigated in addition to the abovementioned priority substances; DEP (diethyl phthalate), propiconazole, perfluorinated and polyfluorinated compounds, organotin compounds and the UV filters, 3-benzylidene camphor and 2-ethylhexyl-4-methoxycinnamate were all excluded during the selection phase. For DEP and propiconazole no animal studies revealed sufficient evidence for endocrine disrupting effects. And for perfluorated and polyfluorated compounds insufficient data on migration of these substances (these analyses could not be performed) led to exclusion. Furthermore organotin compounds were excluded, as they were not identified in the migration analyses of the selected products. The two UV filters were excluded, as they were only used in two sunscreen lotions for children purchased in the autumn of 2008. The two manufacturers involved in the manufacturing of these sunscreen products have informed that the UV filters will not be a component of the products for sale in 2009.
In addition to performing quantitative risk assessments for the above potential endocrine disruptors, the aim was to achieve a more detailed profile of children's total exposure to substances posing a potential health hazard. Therefore, a review of available literature on substances with potential endocrine disrupting and allergenic effects was carried out, and a series of consumer products was screened for content of organic substances. The substances identified in the screening were subsequently reviewed for any endocrine disrupting and allergenic effects and for classification of other health hazards. A preliminary rough exposure assessment (Tier 1) was carried out for all substances. The screening was also used to select substances for quantitative analysis of content and migration, which was subsequently used in a more detailed exposure assessment.
The screening included the following 12 product groups:
- Outdoor clothes in the form of impregnated textiles (jackets), i.e. jackets marked as waterproof or water-resistant (PVC-rainwear was also a selection criterion but was not found).
- Mittens of the same material as all-in-one suits.
- Footwear in the form of rubber clogs.
- Footwear in the form of unlined rubber boots.
- Pacifiers, primarily pacifiers in which the plastic coverage is polycarbonate.
- Bath soap packaging formed as various figures/animals, but also other containers manufactured from PVC for children's soap.
- Non-slip figures and non-slip mats for bathtubs.
- Soft toys with fragrance to be warmed in a microwave oven.
- Diapers.
- Sunscreen lotion.
- Moisturising cream/lotion/oil-based cream.
- Bed linen (junior bed linen).
Sunscreen lotions and moisturising creams/lotion/oil-based creams have been mapped, and ingredients have been registered based on packaging and information from the manufacturer/importer/retailer.
The route of exposure relevant for the individual product will depend on the product type and the chemical substance in question. Assessment of exposure is based on ingestion, skin exposure and inhalation of volatile substances from the product. For example, the 2 year-old may be affected via inhalation of substances from bed linen and clothing, and from substances that evaporate from soft toys, etc. Skin exposure (dermal exposure) must, on the other hand, be considered relevant, as children have direct skin contact with all these products. Ingestion, resulting from a 2 year-old sucking a product, is also pertinent for all product groups with the exception of footwears and diapers. The framework for the exposure period and other data for use in the exposure scenarios are presented below.
Summary of analysis results
Outdoor clothes (jackets and mittens), footwear (rubber clogs and rubber boots), pacifiers, bath soap packaging, non-slip figures and mats, soft toys, diapers and bed linen were analysed.
Below follows a summary of the analysis results, including the results for potential endocrine disruptors. A quantitative risk assessment for the selected substances is presented in Chapter 7.
Endocrine disruptors
Phthalates
The content of phthalates has been quantified in a series of products and several concentrations have been detected that indicate that the phthalates have been added as a softener. Examination of exposure scenarios with sweat and saliva simulators, however, demonstrated that only a small amount of the phthalates DIBP, DBP, DEHP and DEP migrate out of the products, and that the highest molecular weight phthalates, DINP and DNOP, do not migrate under the applied conditions.
Phthalates are found in the following product types (the figure in parentheses indicates the number of products with detected phthalate content)
- Jackets - Outer material (1 - DIBP) and in reflectors (1 - DEHP) and in the zip strap (1 - DBP, DEHP)
- Mittens - Outer material (1 - DEHP) and label with product name on the back of the hands (2 - DEHP, DINP)
- Rubber clogs (3 - DIBP, DBP, DEHP)
- Rubber boots (1 - 1-Butyl-2-isobutyl phthalate)
- Soap packaging (5 - DEHP, DINP, DNOP, DEP) - All products manufactured from PVC
- Bath mats (3 - DEHP, DINP) - Highest content in products made from PVC
- Soft toys (2 - DBP, 1-Butyl-2-isobutyl phthalate).
In five out of five soap packagings, the content of DEHP, DINP and/or DNOP exceeded the permitted limit of 0.1% stipulated in the Statutory Order on the ban on phthalates in toys and childcare articles. The Danish Safety Technology Authority subsequently determined that these products can be considered toys. Sale of these products has therefore been stopped.
Low concentrations of phthalates were also detected in the coverage of all inspected pacifiers (5 products - DEHP, DINP), but the migration analyses showed no migration from the materials to the saliva and sweat simulators under the applied conditions. The coverage from one product has a DINP content slightly over the threshold value of 0.1% as indicated in the statutory order on the ban on phthalates in toys and childcare articles.
Bisphenol A
Bisphenol A has been detected in the coverage of pacifiers made of polycarbonate, but the analyses revealed no migration from the materials to the saliva and sweat simulators.
Allergens
Formaldehyde
Formaldehyde was detected in jackets (5 products), mittens (5 products), diapers (3 products, low content at the detection threshold) and bed linen (3 products, both before and after washing). The highest content was detected in bed linen. Ten-hour sweat migration tests of a set of bed linen showed higher content than the quantitative analyses, which involved water extraction for 1 hour.
Isocyanates
Various isocyanates were found in all jackets (5 products) and mittens (5 products) investigated. Studies of select products for MDI and 2,4-TDI with saliva simulators revealed that only a minor amount of isocyanates migrate.
Fragrances
Two soft toys designed to be warmed in the microwave contained numerous fragrances. These soft toys were examined before and after warming. Higher concentrations and more fragrances were detected after than before warming.
Other results
Analysis of jackets, mittens and bed linen revealed a large number of organic compounds. Studies of triphenylphosphate, diglycidylbisphenol and o-toluidine in exposure scenarios with saliva simulators demonstrated that these migrate.
There are no indicators that jackets and mittens have been impregnated with flame retardants.
Washing textiles
Bed linen were analysed before and after washing. The results show that many of the organic substances cannot be detected after washing the products. Several substances can, however, still be found in low concentrations after 1 wash. The remaining textiles (jackets and mittens) were not examined before and after washing, but it is assumed that the same would apply.
Summary of risk assessment
The project’s risk assessments focused on the 2 year-old child’s total exposure to selected endocrine disruptors in consumer products, foods, indoor air and dust. Exposure calculations are based on the present project; the analysis results from previous survey projects; and on estimates of exposure from cosmetic products, indoor air, dust and food.
The risk to which a 2 year-old is exposed was calculated for both the summer and winter periods. In these calculations the summer scenario included:
- Contact with sunscreen lotion
- Contact with rubber clogs
- Dermal contact with toys for 9 hours in the summer
- Ingestion of 50 mg dust.
The winter scenario included:
- Dermal contact with toys for 6 hours in the winter
- Contact with jackets/mittens for 3 hours
- Ingestion of 100 mg dust.
Common to both scenarios were:
- Ingestion of foods
- Contact with objects other than toys, i.e. moisturising cream, bath articles and other textiles other than winter clothing (jackets/mittens).
The results show that regardless of whether calculations are based on the summer scenario or the winter scenario, the RCR values (Risk Characterisation Ratio = Exposure/DNEL = Exposure/(NOAEL/AF)) are greater than 1 for the substances DBP and dioxins and dioxin-like PCBs. This means that at each exposure to each of these substances there will be a risk for endocrine disrupting effects, and there will also be a risk for these affects based on the other assumptions in this report. For DBP and dioxins and dioxin-like PCBs, the highest amounts are contributed by foods, indoor air and dust.
For propylparabens, the RCR is above 1 for the summer scenario, while RCR is 0.83 for the winter scenario. For the summer scenario RCR is high (0.7) for butylparaben but nevertheless under 1. The parabens originate from use of lotions, including sunscreens, and is the reason that their contribution is greatest in the summer scenario.
The concentrations used in the risk assessment of the parabenes are based on a small survey of the concentration used in products on the Danish Market. If the highest allowed in the cosmetics directived were used, RCR would be far above 1.
By grouping the substances into anti-androgenic, oestrogen-like substances, and substances that may have both effects, the cumulative RCR is calculated and stated in Table 0.1.
Table 0.1 Cumulative RCR for oestrogenic and anti-androgenic substances
| Substance category | Summer scenario excluding rubber clogs and excluding the lowest contribution from phthalates from toys (i.e. minimum values) | Winter scenario excluding the lowest contribution from phthalates from toys (i.e. minimum values) | ||
| RCR (50% ) |
RCR (95% and max) |
RCR (50% ) |
RCR (95% and max) |
|
| Antiandrogens | 3.73 | 9.19 | 3.89 | 9.96 |
| Oestrogen-like | 3.74 | 3.76 | 1.04 | 1.06 |
| Anti-androgenic plus oestrogen-like | 7.47 | 12.95 | 4.93 | 11.02 |
The results show that cumulative RCR for the anti-androgenic substances and the oestrogen-like substances is above 1 for both the summer and winter scenarios. DBP and dioxins and dioxin-like PCBs contribute most to the RCR for anti-androgenic effect. These contributions originate from their presence in foods, indoor air and dust. Propyl and butylparaben contribute most to the RCR for oestrogen-like effect. These contributions originate from their presence in sunscreen lotions and oil-based creams.
The present investigation, however, is based on random samples of individual consumer products and product groups. There may therefore be other chemical substances with suspected endocrine disrupting effects and other products on the market that add to this risk. In addition to the exposure contribution covered by these calculations, there may be other contributing factors that could increase the overall risk; for example, any presence of the prioritised substances in medicine and medical devices has not been included. In addition to this, there could be substances that the child already has in their body from earlier exposures, such as those passed from mother to child during the foetal period and nursing.
In addition, there may be a greater contribution from some of the consumer products, as some values (such as for toys) may be underestimated because it has been necessary to estimate the weight of the products in the calculations. In addition, the actual number of products used by the 2 year-old may further contribute to the calculated risk; for example, it should be expected that pacifiers are changed more often than mittens and jackets.
It should also be noted that the project's calculations also include many parameters that are based on estimates. This is due to the fact that there is no clear documentation for the areas concerned. Such types of estimates can produce distorted results and may mean that overall exposure is estimated at a higher level than is actually the case.
For propyl- and butylparaben in particular, which are included in the cumulative risk assessments, the selected LOAEL-based effects have been found in only a few studies conducted by a Japanese group (Oishi et al 2001, and Oishi et al 2002 in SCCP opinion; SCCP (2005)). In the SCCP opinion from 2005, doubt is raised concerning the validity of these results, and SCCP has asked the industry to provide results from developmental toxicity studies that can determine whether propyl, butyl and isobutylparaben have endocrine disrupting effects in animals. SCCP is, however, still awaiting the information from the industry which could decide whether the parabens induce endocrine disrupting effects or not. In addition, skin absorption for parabens is estimated at 10%. There is currently no documentation for skin absorption, metabolism and excretion of parabens. The EU’s Scientific Committee for consumer products has stated that the documentation will be available shortly, after which a more exact risk assessment of parabens can be performed. The estimate at 10% is based on worst-case scenarios and may produce distorted results, as results in cumulative exposure are being estimated at a higher level than actually occurs.
Based on the assumptions made in the report, it can be concluded that:
- A few exposures to a high content of an endocrine disruptor, such as that of DBP in rubber clogs may result in a critical risk for the 2 year-old.
- The amounts that 2 year-olds absorb, in particular from the phthalate DBP (mostly from foods) and dioxins and dioxin-like PCBs (mostly from foods, and partly from indoor air and dust), constitute a risk for anti-androgen disruptions to the endocrine system.
- The amounts that 2 year-olds absorb from the parabens propylparaben and butylparaben, in particular, can constitute a risk for oestrogen-like disruptions of the endocrine system. This contribution originates predominantly from cosmetic products such as oil-based creams/moisturising creams/lotions and sunscreen.
In summary, it can be concluded that not only is there a need to reduce exposure to anti-androgens and oestrogen-like substances from food products, indoor air and dust, but also to reduce exposure to the studied product groups, as these contribute to both indoor air and dust and to direct exposure, based on the assumptions made in this report. A reduction of the potential cumulative risk requires knowledge of the sources of the contents of food products, indoor air and dust. However, there is also a need to reduce possible contributions from other sources, such as propyl-, butyl- and isobutyl paraben in cosmetics, and phthalates in footwear (such as light-weight sandals and rubber boots).
1 Introduction
1.1 Project background
The continuing increase in asthma and allergy among children and the suspicion that chemical substances may result in serious symptoms such as reduced reproductive ability, premature puberty, and reduced learning ability, have resulted in a desire to reduce childhood exposure to chemical substance in Denmark.
In a series of previous projects, the Danish Environmental Protection Agency evaluated the risk associated with individual consumer products. In most cases products do not contain problematic substances in quantities sufficient to constitute a risk in general or isolated use.
These projects did not focus on the cumulative effect of a single substance from the many different sources to which one was exposed during a day. Neither has the degree to which certain substances may have harmful effects when in combination with other substances been examined.
2 year-olds are exposed to a huge number of products in their daily life and are thereby exposed to many chemical substances. They are also particularly susceptible because of their physical size (large surface area/small volume). The primary focus is on consumer products, but because the 2 year-old’s exposure to chemical substances is comprised in part of food products and the materials that are in contact with these food products, certain food products and materials and objects that come into contact with these food products have also been examined. Exposure from the indoor climate has also been evaluated based on existing measurements of substances in indoor air and dust.
The project will result in an information campaign intended to disseminate the report’s conclusions and provide active advice. The primary target group for the campaign is parents and grandparents who are in daily contact with 2 year-olds, but the project is also expected to have a knock-on effect on Danes in general, raising awareness of their chemical exposure in daily life and generating an understanding that it is possible to reduce unnecessary exposure to chemicals.
Background on allergens and endocrine disruptors
The project initially focuses on substances that are allergen and/or endocrine disruptive and with which the 2 year-old is in contact in their daily life. For this reason the analyses have focused on both areas, but risk assessment has not been performed for the allergens. In the course of the project, it was decided to focus on the endocrine disruptor in order to limit the scope of the assignment.
Allergy
Approximately one in five adults in Denmark has contact allergies and at least as many have an allergic respiratory illness.[¹].
The frequency of allergy is increasing. More than 200,000 Danes have experienced allergic contact eczema at some time within the last year. This condition develops through dermal contact with chemical substances in the immediate environment, typically from cosmetic products containing perfumes and preservatives as well as cleaning products and certain types of toys 1.
Contact allergy can be prevented if the sufferer is aware of which substances cause the allergic reaction, as the condition only occurs when exposed to sufficient concentrations of chemical allergens in the environment[²].
Endocrine disruptors
Endocrine disruptors are, according to the EU’s definition from the Weybridge workshop in 1996, an "exogenous substance that causes harmful effects in an organism or its offspring as a result of changes in the function of the endocrine system."
Endocrine disruptors may affect hormone balance in many different ways. They can bind to one of the body’s many hormone receptors, where they can have either an agonistic or antagonistic effect. They can alter the number of hormone receptors and influence cofactors involved in the activation of various receptors. In addition, these substances can alter the synthesis of hormones, change the binding of hormones to proteins and alter the breakdown of hormones (Pharma, 2008).
This project focused on anti-androgenic substances and oestrogen-like substances. Anti-androgenic substances are substances that can counteract the production or effects of male sex hormones (androgens), including testosterone. In animal studies, the presence of anti-androgenic substances during the foetal stage may result in nipple retention, reduced anogenital distance, increased occurrence of deformed genitals, incomplete descent of testicles in male offspring, and reduced sperm quality in adult animals. In humans, these substances are thought to play a role in the occurrence of, reduced sperm quality, increased occurrence of congenital deformities in the male sex organs, and increased occurrence of incomplete descent of testicles in young boys. Oestrogen-like substances are substances that can affect the organism in the same way as the female sex hormone, oestrogen. Animal studies have shown that oestrogen-like substances can lead to early development of mammary tissue, early onset of puberty and reduced sperm quality. In humans, these substances are thought to play a role in the development of early onset of puberty and breast cancer.
Substances that have been shown to have endocrine disrupting effects in animal studies are typically classified because they have produced serious effects such as cancer, or reproductive damage, in animal studies. In the EU, a candidate list of potential endocrine disruptors is being drawn up that will be prioritised for further studies for their endocrine disrupting effects. As background for this work, lists of endocrine disruptors are being collected from various organisations and countries. These lists have been compared and have resulted in the establishment of a collective EU list of 553 candidate substances for further study of their endocrine disrupting effects. In order to prioritise this effort, the substances have been categorised according to criteria that have resulted in one group of substances for which there is documentation of endocrine disrupting activity in at least one study on a living organism (category 1); one group of substances without sufficient evidence of endocrine disrupting effects, but where there is documentation indicating biological activity related to endocrine disruption (category 2); and substances for which there are no indications of endocrine disrupting properties, or which cannot be evaluated because of insufficient data (categories 3a + 3b).
This prioritisation has been carried out in several stages, and all 553 substances as well as a further 33 substances added in the last stage, have now been through the prioritisation process. Subsequently, it is intended to transfer these lists to a dynamic working list, to which substances can be added or deleted as increasing documentation on the endocrine disrupting effects of these substances becomes available.
Category 1 includes 194 substances. This does not necessarily mean that there is final proof that the substance is an endocrine disruptor, but there is more or less comprehensive documentation for endocrine disrupting effects in living animals and therefore the substance should be prioritised for closer study of endocrine disrupting properties. Many of the substances in category 1 are already prohibited or partly restricted (this applies to many biocides and pesticides). Some of the substances are subject to an approval process where a risk assessment is performed of the substance’s use in a specific context (such as biocides, medicinal products, etc.). This also applies to the positive lists of cosmetic ingredients, where the Scientific Committee has evaluated the risk at use. A number of substances have also been subjected to closer study in compliance with applicable EU legislation.
A detailed description of EU prioritisation work can be found on the EU website, where one can also access the database containing all the substances. http://ec.europa.eu/environment/endocrine/strategy/short_en.htm.
The majority of the chemical substances that surround us have however not been tested for endocrine disrupting effects. We therefore do not know with any certainty how many endocrine disruptors we are exposed to in daily life.
Endocrine disruptors are thought to be the reason for a [³]:
- Sperm quality below the level set as normal by WHO in one in five Danish men between the ages of 18 and 20.
- Large increase in testicular cancer over the last 60 years in Denmark, and a higher incidence than any other country in Europe. Almost 1% of Danish men are at risk of developing testicular cancer.
- 9% incidence of cryptorchidism (testicles not fully descended into the scrotum) in Danish boys. This is significantly higher than in the 1960s. Cryptorchidism is associated with an increased risk of low sperm quality and testicular cancer.
- Decrease in the testosterone levels in the blood of Danish men. Men born after the 1930s-1940s have lower testosterone levels than their fathers and grandfathers had at the same age. A 30-40 year-old man today has the same level as a 70 year-old did at that time.
There is, however, no conclusive proof that the above symptoms can be attributed to endocrine disruptors in our environment. There may be many other causes, such as lifestyle, including changes in diet, smoking habits and alcohol intake.
Combination effects
Combination effects, also known as cocktail effects, can be defined as effects on a biological system or an organism after exposure to multiple substances at the same time. These substances may originate from the same source or from multiple sources. Combination effects of endocrine disruptors are thought to be a contributing factor in the abovementioned symptoms.
New research projects are providing greater knowledge of these combination effects, such as:
- "0+0+0+0 gives 7"[4], “Seriously deformed sex organs are the consequence when rats are exposed to multiple chemicals in concentrations that do not produce effects when rats are exposed to them individually,” where, among other things, the phthalate DEHP alone and at a relatively low dose produces no effect but then suddenly produces clear effects when combined with three other substances in concentrations that do not produce effects independently.
- "Simultaneous exposure to multiple endocrine disruptors in experimental studies - a dangerous cocktail?"[5], in which results from the EU EDEN project are discussed. The results demonstrate that concurrent exposure to 3 potential endocrine disruptors with the same mechanism of action resulted in clear combination effects at doses of individual substances around or below NOAEL (No Observed Adverse Effect Level), and that the combination effects could be predicted on the basis of the individual substances’ effects when using dose-addition. These results are presented in the article "Combined Exposure to Anti-Androgens Exacerbates Disruption of Sexual Differentiation in the Rat"[6].
- "New studies on pregnant rats reveal that the foetus is only sensitive to endocrine disruptors during a very early stage of pregnancy"[7], in which it is recommended that "Women should abstain from cosmetics, lotions and food products that contain endocrine disrupters such as phthalates and pesticides - both before and during pregnancy." At a meeting held at the Rigshospitalet/Copenhagen University Hospital on 23 May 2008 on endocrine disruptors, it was advanced by several researchers that new studies indicate that there is probably a “programming window’ of a few days early on in pregnancy during which the foetus’ exposure to chemicals has a significant effect on sexual development and, especially for boys, a later risk of reproductive problems and development of cancer.
"We have a good basis from which to say that there is a connection between exposure to phthalates and conditions such as asthma and allergy. This has been shown in studies from Sweden and Bulgaria, and similar studies are underway here in Denmark. This connection has led researchers to wonder whether there might also be a connection with other conditions such as diabetes, obesity and autism, which like asthma and allergy have increased massively over recent years," says Professor Bjarne Olsen, DTU. Researchers can see a connection between effect of phthalates and respiratory symptoms, asthma and other allergic symptoms, but are not sure of the underlying biological mechanism. Instead of only looking at phthalates, one should perhaps include similar substances, such as bisphenol A, brominated flame retardants, pesticides, etc. There are many open questions, such as why do boys have a four times higher incidence of autism and two times higher incidence of asthma than girls? The cause could be attributed to effects early in life from chemicals that are similar to female sex hormones, explains Carl-Gustaf Bornehag (DTU, 2008).
The focus of the project is the 2 year-old’s total exposure to chemical substances in consumer products with which the child is in contact in daily life. In the following, emphasis has therefore been placed on prioritising the potential endocrine disruptors and allergen substances that occur in products that 2 year-olds are in daily contact with, and which also constitute a significant level of exposure. However, no risk assessments have been performed for the allergen substances. In the course of the project, it was decided to focus on potential endocrine disruptors in order to limit the scope of the assignment.
2 year-olds are exposed, like other family members, directly and indirectly, to many products and materials that release chemicals into the indoor climate (both evaporation into indoor air and deposition on dust). These sources include:
- Household fittings/furnishings (carpets, furniture, flooring, electrical devices, etc.)
- Building materials (children suck on/eat paint flecks, previously the most significant exposure to lead in poor residential areas).
- Travel time in cars and other means of transport.
- Leisure/holiday time (public swimming pools, etc.).
These other sources of exposure are included in the risk assessment to the extent that data was available for the selected substances.
In addition, 2 year-olds, like the rest of the population, are affected by other factors, such as air pollution (from traffic, wood burning stoves, etc.) that are not covered by the project.
1.2 Project purpose
The focus of the project is the 2 year-old’s total exposure to chemical substances in consumer products with which the child is in contact in daily life.
Since 2001, numerous projects have been carried out to assess the risk associated with use of various product groups. These projects have primarily looked at peoples’ exposure to chemical substances from individual products, but the primary aim of the present project is to examine the 2 year-old’s total exposure to chemical substances during 24 hours.
The purpose of the project is to:
- Generate knowledge on:
- the chemical substances with which a 2 year-old comes into contact
- the concentrations of chemical substances to which a 2 year-old is exposed and
- combination effects at simultaneous exposure to multiple substances
- whether the substances found and the concentrations of these substances are potentially harmful to children.
- Develop an information campaign with action-oriented advice, including, for example:
- products/product types that should be avoided and why
- products/product types that should be treated with particular caution at use and why
- how consumers should deal with a possible identified risk
- awareness of certain substance groups
- good stories on unproblematic products and product groups
- how consumers can think across product groups and minimise children’s exposure to chemical substances.
1.3 The project’s target group
The project’s target group includes:
- Individuals who have frequent contact with 2 year-olds, i.e. parents and grandparents. The information campaign will disseminate information on potential health risks at use of the products and advice on how to minimise risks and drawbacks. Such information can also be used by the staff of institutions.
- Consumer organisations will be informed of the factual component of the project and the messages of the information campaign, and will have opportunity to publish scientifically-based information and guidance concerning the products.
- Authorities will gain an overview of certain product types that children can come into contact with, the ingredients used, and their potential health risks. The results of the project can also be used for the future regulation of substances in the EU.
- Manufacturers, distributors and retailers will have an increased incentive to take measures to reduce children's exposure to potential endocrine disruptors.
The primary target group is parents and grandparents of 2 year-olds, who will be the primary recipients of the information campaign.
The campaign works with information aimed directly at the primary target group and has also established a cooperation with organisations, companies, retailers and authorities that can serve as channels for the project’s messages.
Institution personnel in nurseries and day-care providers constitute a secondary target group. Apart from encountering the campaign in the media and on the internet (netdoktor.dk), we are also intending to establish cooperation with trade publications that are read by institutional staff. Finally, working with municipal bodies we will disseminate the campaign to institution personnel.
1.4 Report structure
The report’s introduction gives the background for the project as well as the project’s objective and target group.
Chapter 3 - "Selected substances and products" explains the inclusion and exclusion of substances and products in the project. In addition, a 2 year-old’s possible exposure to other potential endocrine disrupters, allergens and substances with other harmful health effects. This is done through a literature review, screening analyses of consumer products, and use of (Q)SAR models.
Chapter 4 - "Legislation" describes the legislation that refers to the product groups which are studied in the present project as part of the surveying process (Chapter 5 of the report). This involves the statutory order on toys; the statutory order on use of phthalates in toys; the statutory order on cosmetics; regulation of other substances, such as nickel, brominated flame retardants, TRIS, TEPA, PBB, PFOS, arsenic and mercury, regulation of nitroamines, and general rules on limitations on use for certain substance (transferred as of 1 June 2009 to the REACH regulations).
Chapter 5 - "Survey" maps out the 12 selected product groups. This entails outdoor clothes in the form of impregnated textile outer clothing (jackets), mittens of the same material as snowsuits, footwear in the form of rubber clogs, footwear in the form of unlined rubber boots, pacifiers, bath soap containers, non-slip figures and bath mats, soft toys, diapers, sunscreen, moisturising cream/oil-based cream/lotion and bed linen.
Chapter 6 - "Chemical analyses" - describes the analysis programme, exposure scenarios, results of the screening analyses, quantitative analyses and migration analyses. The results are divided into product groups.
Chapter 7 - "Risk assessments" - first presents the methodological considerations for setting up the exposure scenarios, including route of exposure, exposure scenarios (exposure times, etc.). It then discusses the methodical conditions concerning calculation of risk, the most important exposure sources and calculations of exposure via dust and air in the indoor environment. Subsequently, risk assessments of the selected substances are presented. Finally, a cumulative risk assessment of endocrine-like substances is presented.
[1] Source: Jeanne Duus Johansen, MD., Centre leader for Videncenter for Allergi [Allergy Knowledge Centre], Gentofte County Hospital
[2] Source: Jeanne Duus Jensen, Knowledge Centre for Allergy, Chronic: Allergi overfor kemiske stoffer kan forebygges (Allergy to chemical substances can be prevented) (MiljøDanmark 4/2002), http://glwww.mst.dk/udgiv/12090200.htm
[3] Source: University Department for Growth and Reproduction, Copenhagen University Hospital and IndenRigs (newsletter for employees of the Copenhagen University Hospital)
[4] Ingeniøren no. 8, 2007
[5] Miljø og sundhed [Environment and Health] supplement no. 7, September 2007
[6] Hass et al. Environmental Health Perspectives Volume 115, Number S-1, December 2007
[7]http://www.videnskab.dk/content/dk/krop_sundhed/hormonforstyrrende_stoffer_
virker_tidligt_i_graviditeten
2 Definitions
- 2.1 2-year-olds
- 2.2 Toys for 2 year-olds
- 2.3 Relevant substances
- 2.4 Relevant products
- 2.5 Endocrine disrupters
- 2.6 Combination effects
- 2.7 Allergens
2.1 2-year-olds
2 year-olds means children from the day they turn 2 until they reach the age of 3.
2.2 Toys for 2 year-olds
Toys for 2 year-olds are defined as toys which a 2 year-old may like to play with. In other words, toys intended both for very young children and toys for children over three years of age, as younger siblings often play with the toys of their older siblings. Furthermore, some parents - perhaps grandparents in particular - have a tendency to purchase toys for children that are intended for an age group higher than the actual age of the child. It is characteristic that children of about 2 years old, play with almost anything they can get their hands on.
2.3 Relevant substances
Throughout the project and report, the phrase "relevant substances" is used. This refers to chemical ingredients that are pertinent to the project’s focus area, i.e. that they are potential endocrine disruptors or allergen.
2.4 Relevant products
Throughout the project and report, the phrase "relevant products" is used. This refers to consumer products that are considered pertinent for a 2 year-old, i.e. products that a 2 year-old may come into contact with during one day.
The project is limited to focusing on consumer products that are subject to the Ministry of the Environment’s area of responsibility; in other words, food products or materials that come into contact with food products, such as tableware and baby bottles, are not analysed in this project. However, the project does include some of the already existing information on relevant chemical substances in food products. No distinction is made between substances in food products originating from environmental pollution and substances originating from packaging, processing equipment, etc. No new analyses have been performed on this area in the project.
2.5 Endocrine disrupters
Endocrine disrupters are, according to the EU’s definition from the Weybridge workshop in 1996, an "exogenous substance that causes harmful effects in an organism or its offspring as a result of changes in the function of the endocrine system."
Endocrine disrupters may affect hormone balance in many different ways. They can bind to one of the body’s many hormone receptors, where they can have either an agonistic or antagonistic effect. They can alter the number of hormone receptors and influence cofactors involved in the activation of various receptors. In addition, these substances can alter the synthesis of hormones, change the binding of hormones to proteins and alter the breakdown of hormones (Pharma, 2008).
2.5.1 Oestrogenic substances or oestrogen-like substances
Oestrogen-like substances are substances that can affect the organism in the same way as the female sex hormone oestrogen. In animal studies, effects of oestrogen-like substances may lead to early development of mammary tissue, early onset of puberty and reduced sperm quality. In humans, these substances are thought to play a role in the development of early onset of puberty and breast cancer.
2.5.2 Anti-androgenic substances
Anti-androgenic substances are substances that can counteract production from or effects of male sex hormones (androgens), including testosterone. In animal studies, the presence of anti-androgenic substances during the foetal stage may result in nipple retention, reduced anogenital distance, increased occurrence of deformed genitals, incomplete descent of testicles in male offspring, and reduced sperm quality in adult animals. In humans, these substances are thought to play a role in the incidence of reduced sperm quality, increased incidence of congenital deformities in the male sex organs, and increased incidence of incomplete descent of testicles in young boys.
2.6 Combination effects
Combination effects, also known as cocktail effects, can be defined as effects on a biological system or an organism after exposure to multiple substances at the same time. These substances may originate from the same source or from multiple sources.
2.7 Allergens
Allergens are substances classified as R42, may cause sensitisation by inhalation, and/or R43, may cause sensitisation by skin contact, on the List of hazardous substances or on the Danish Environmental Protection Agency’s list of guidelines for self-classification. It is also well-known that preservatives, perfumes and colouring agents are used in cosmetic products and these can in certain cases provoke contact allergies. For perfume substances in cosmetic products, there is a requirement for 26 listed substances to be declared on the list of ingredients on the product. This is because their allergen properties have been documented, and this can be a tool for consumers who are aware that they are hypersensitive to one or more of these substances. There is a large difference in the allergen potential of these 26 substances, and other perfume agents.
3 Selected substances and products
- 3.1 Quantitative risk assessment of potential endocrine disruptors
- 3.2 Exposure to other substances with potentially harmful effects
- 3.3 Literature review
- 3.4 Selection of products for screening
- 3.5 Screening results
- 3.6 Tier 1 exposure assessment
- 3.7 Identified substances with potential endocrine disrupting properties
- 3.8 Literature review of endocrine disruptors
- 3.9 (Q)SAR predictions for substances with potential endocrine disrupting effects
- 3.10 Conclusion on the identification of substances with potentially endocrine disrupting effects
- 3.11 Identified substances with allergenic effects
- 3.12 Literature review of allergens12
- 3.13 Chemical substances identified in the screening with classification for other effects harmful to health
This chapter explains the inclusion and exclusion of the substances and products which will be the focus of the rest of the project. In addition, a 2 year-old’s possible exposure to other potential endocrine disrupters, allergens and substances with classifications for other harmful health effects. This is performed through a literature review, screening analyses of consumer products, and use of (Q)SAR models.
3.1 Quantitative risk assessment of potential endocrine disruptors
Focus for the quantitative risk assessment in this project is the 2 year-old’s total exposure to substances with potential endocrine disruptive properties, including anti-androgenic substances and oestrogen-like substances. Cumulative risk assessment of substances with endocrine disruptive properties is, according to the Danish Environmental Protection Agency, both possible and necessary (Kortenkamp, 2009). The report also points out that the dose addition method can be used to calculate cumulative effects. This method is used in this project and described in greater detail in Chapter7. In order to utilise this method, it is necessary to know the substances’ NOAEL (No Observed Adverse Effect Level) or LOAEL (Lowest Observed Adverse Effect Level) values. It is therefore a prerequisite that there are reliable animal studies on anti-androgens or oestrogen-like effects for substances included in the quantitative risk assessment. One of the criteria for selection of substances for risk assessment in this project has been a known endocrine disrupting effect of the substances from animal studies. Another criterion has been anticipated exposure of the 2 year-old child to the substances through food products, indoor climate or consumer products. The substances selected are the following:
Antiandrogens:
- DEHP (di-ethyl-hexyl-phthalate) (117-81-7)
- DINP (di-iso-nonyl-phthalate) (68515-48-0)
- DBP (di-butyl-phthalate) (84-74-2)
- DIBP (di-iso-butyl-phthalate) (84-69-5)
- BBP (butyl-benzyl-phthalate) (85-68-7)
- Prochloraz (67747-09-5)
- Tebuconazol (107534-96-3)
- Linuron (330-55-2)
- Vinclozoline (50471-44-8)
- Procymidon (32809-16-8)
- PCBs (poly-chlorinated-biphenyls)
- Dioxins
- DDTs/DDDs (dichloro-diphenyltrichloroethane/dichloro-diphenyldichloroethane).
Oestrogen-like:
- Propylparaben (94-13-3)
- Butylparaben (94-26-8)
- Isobutylparaben (4247-02-3)
- Bisphenol A (80-05-7).
These substances were selected because they are believed to account for a significant part of the 2 year-old’s exposure to potential endocrine disruptors. It has also been a condition that there is data concerning the exposure/migration of these substances from consumer products, food products and/or indoor climate.
The phthalates DEHP, DINP, DBP, DIBP and BBP occur in consumer products. They have been identified in screenings of consumer products in this project and in the Danish Environmental Protection Agency’s previous surveying projects. In addition, some phthalates are used in materials and objects that come into contact with food products. They are also found in food products as a result of environmental pollution. The pesticides prochloraz, tebuconazole, linuron, vinclozoline and procymidone may occur as food product contaminants. PCBs, dioxins and DDTs occur in food products as a result of environmental pollution. PCBs are also found in our indoor climate. Parabens occur in cosmetics, and finally, bisphenol A is found in products of the plastic type polycarbonate, and also exists as an environmental contaminant.
In addition to the substances prioritised above, DEP (diethylphthalate), propiconazol, perfluorinated and polyfluourinated compounds, organotin compounds and the UV filters 3-benzylidene camphor and 2-ethylhexyl-4-methoxycinnamate were also studied initially, but were deselected during the surveying process. DEP and propiconazole were excluded because no animal studies revealed sufficient evidence for their endocrine disruptor effects. Perfluorated and polyfluorated compounds were identified in the analyses in this project, but were excluded due to insufficient data for migration of these substances (these analyses could not be performed). Organotin compounds were excluded because they were not identified in the migration analyses of the selected products, and the two UV filters were excluded as these UV filters were only used in two sunscreen lotions for children purchased in the autumn of 2008. Furthermore, the two manufacturers of these sunscreen lotions state that they would not use these UV filters in the products to be sold in 2009.
3.2 Exposure to other substances with potentially harmful effects
In addition to performing quantitative risk assessments for the above potential endocrine disruptors, the aim was to achieve a more detailed profile of children's total exposure to substances posing a potential health hazard. Therefore, a review of available literature on substances with potential endocrine disrupting and allergenic effects was carried out, and a series of consumer products was screened for content of organic substances. The substances identified in the screening were subsequently reviewed for any endocrine disrupting and allergenic effects and for classification of other health hazards. A preliminary rough exposure assessment (Tier 1) was carried out for all substances. The screening was also used to select substances for quantitative analysis of content and migration, which was subsequently used in a more detailed exposure assessment.
3.3 Literature review
The Danish Environmental Protection Agency’s previous surveying projects and certain other sources have been reviewed for potential endocrine disruptors and allergens. The results of these reviews are described in sections 0 and 3.11.
3.4 Selection of products for screening
Selection of products for survey and chemical analysis was made on the basis of the following criteria:
- There must be a frequent/lasting use of the product for the 2 year-old (the results from CASA’s working paper for the Danish Environmental Protection Agency are included).
- There is an assumption that there are potential endocrine disruptors in the products.
- The 2 year-old must be exposed to these substances (through ingestion, inhalation, or contact).
- There is something to report for each individual reporting arena (see below).
3.4.1 Reporting arenas
In the following, reference is made to a series of reporting arenas. The arenas mentioned below are those that were used as a starting point for the selection of product groups for survey. The arenas used in the information campaign, etc. are therefore not identical with those mentioned here.
Review of previously completed investigations of consumer products divided by arena is given in Table 3.1.
Table 3.1 Overview of number of products studied by the Ministry of the Environment’s survey projects and related arenas of reporting
| Arena of reporting | Number of products investigated distributed by arenas of reporting1 | Number of products investigated - containing relevant substances only2 |
| 1: Good morning - child is dressed, eats breakfast and brushes teeth etc. | 22 | 15 |
| 2: On the way to day-care | 14 | 13 |
| 3: Day-care - inside | 82 | 59 |
| 4: Day-care - outside | 17 | 17 |
| 5: Back home - playing in the child's room | 101 | 69 |
| 6: Children’s TV programmes in sitting room | 18 | 15 |
| 7: Evening meal in kitchen | 14 | 12 |
| 8: Bathtub | 25 | 21 |
| 9: Goodnight - bed in the child’s room | 25 | 18 |
112 products fit into all arenas.
211 products fit into all arenas.
This illustrates that it is largely only reporting arenas 3 and 5, the indoor arenas which include use of toys that are well covered, in that there were many products that were investigated.
Previous surveys were used as the starting point, with the understanding that some of the results will be out of date as a result of new legislation. This applies to toys, for example, where 6 phthalates are now prohibited. Results that are not in compliance with applicable legislation were sorted out if possible when processing the results further.
If we are able to conclude something on all of these reporting arenas, it is therefore also important that the new product types that are mapped cover these slightly “weaker” reporting arenas:
- 2: On the way to day-care
- 4: Day-care - outside
- 6: Children’s TV programmes in sitting room
- 7: Evening meal in kitchen.
The final 12 products were selected for study based on the selection criteria. Many toy products in particular were ruled out, as there has been an EU ban on 6 of the most commonly used phthalates in toys and childcare articles since 2007. It is therefore expected that children are not exposed to phthalates with endocrine disrupting effects from toys and childcare articles.
Screening analyses were performed on 10 of the 12 product groups that were investigated further. The 12 selected product groups are:
- Jackets
- Mittens
- Rubber clogs
- Rubber boots
- Pacifiers
- Soap containers
- Non-slip figures and bath mats
- Soft toys
- Diapers
- Bed linen
- Sunscreen
- Moisturising cream/oil-based cream/lotion.
No analyses were performed for the last two product groups, namely sunscreen and moisturising cream/oil-based cream/lotion. Instead a list of ingredients and permitted use of the selected substance in the products were used in exposure assessments.
3.5 Screening results
Screening analysis of the 10 product groups identified more than 175 different substances. For 21 of these substances it was not possible, based on the screening, to perform a unique identification of the substances, i.e. the substances were not identified with a CAS number. Some of the individual substances also cover, for example, the total of aliphatic hydrocarbons or similar, and for some substances more than one possible CAS number was identified.
Table 3.2 presents the substances identified in the screening analyses in this project. The table indicates whether the substances are classified on the List of hazardous substances (List of Harmonised Classification, which is currently (March 2009) identical to the List of Hazardous Substances), the Danish Environmental Protection Agency’s guidelines list to self-classification of hazardous substances (Danish Environmental Protection Agency, 2001) or the EU candidate list of potential endocrine disruptors. A Tier 1 exposure calculation was then performed using the procedure described in REACH.
The table presents the substances sorted by the worst case exposure concentration (Tier 1) to which the 2 year-old could be exposed from the products examined.
3.6 Tier 1 exposure assessment
A Tier 1 exposure assessment is based on the measured values and the assumption of full migration and full absorption, i.e. 100%.In all cases it is assumed that all the substance in the product migrates instantaneously and is absorbed into the body (whether by sucking or through dermal contact). In other words, the Tier 1 calculations are an expression of the maximum possible exposure to which the two year-old may be subject under the given conditions. For individual products it is, however, assumed that the child sucks on or has contact with a small part of the product, such as bath mats and soap containers, for example. This factor fandel is therefore included in the calculation. Allowance is also made for the fact that far more diapers than jackets are used in a year, for example. A multiplication factor n is therefore used (n=number of products used per day). On this basis, a worst case exposure is calculated as mg/kg body weight per day.
The calculations are made using the following formula:
Click here to see The Calculations
For highly volatile substances, such as formaldehyde, which can be inhaled, the same formula is used, as it is assumed that all the substance in the product is instantaneously evaporated and inhaled by the 2 year-old.
For each substance, the values for all the different products are summated, because the two year-old is exposed to DEHP via jackets, mittens, rubber clogs, pacifiers, soap containers and bath mats.
The parameters and assumptions that are used in the Tier 1 calculations are stated in the report segment on analyses and reproduced here:
- The weight of a 2 year-old is as the worst case set to 10.3 kg (minimum weight for 2 year-old girls).
- Jackets: The maximum measured value for each substance is used, and an estimate is made of how large a part of the total weight of the product, the outer material or a zipper strap, for example, would constitute. Two jackets per year were used and it was assumed that 100% of the measured values from the jacket were absorbed:
- Mittens: The maximum measured value for each substance is used and an estimate is made of how large a part of the total weight of the product, the outer material or a Velcro strap, for example, would constitute. 2 pairs of mittens per year were used and it was assumed that 100% of the measured values from the mittens were absorbed:
- Rubber clogs: The maximum measured value for each substance was used and the total weight for a pair of rubber clogs was used, (i.e. the weight of one shoe was doubled). Two pairs of clogs per year were used and it was assumed that 100% of the measured values from the clogs were absorbed:
- Rubber boots: The maximum measured value for each substance was used and the total weight for a pair of rubber boots was used, (i.e. the weight of one boot was doubled). 2 pairs of rubber boots per year were used and it was assumed that 100% of the measured values from the boots were absorbed
- Pacifiers: The maximum measured value for each substance is used and it is estimated that the nipple constitutes 20% of the pacifier’s total weight. 12 pacifiers per year were used and it was assumed that 100% of the measured values from the pacifier were absorbed:
- Soap containers: The maximum measured value for each substance was used and it was assumed that the two year-old touches or sucks on a maximum of 10% of the product. An exposure of only 10% of the content in the products is therefore calculated. Two soap containers per year were used.
- Bath mats: The maximum measured value for each substance was used and it was assumed that the two year-old touches or sucks on a maximum of 10% of the product. 1 bath mat was used every 2 years.
- Soft toys: The maximum value for each substance was used and it was assumed that all the evaporated material is inhaled and everything that was in the soft toy was absorbed (2 year-old sucks, squeezes and touches the soft toy over the entire object). 5 soft toys per year were used and it was assumed that 100% of the measured values from the soft toys were absorbed:
- Diapers: The maximum measured value for each substance was used and it was assumed that primarily the materials from the filling, elastic/vlieseline and interior waistband were absorbed. Values that are only measured in the stretch closure and the print edge are, however, also included if the substance is not measured in other parts of the diaper. Five diapers per day were used and it was assumed that 100% of the measured values from the diapers were absorbed:
- Bed linen: The maximum measured value for each substance was used and it was assumed that all the substance in the bed linen was absorbed, even if the bed linen has two sides and not all the substance came into contact with the skin. Area of the pillowslip was also included. Two sets of bed linen per year were used and it was assumed that 100% of the measured values from the bed linen were absorbed
In other words, the Tier 1 calculations accounted for the amount of the substance in the product, how often the 2 year-old is in contact with the product, and how great a part of the product the 2 year-old is in contact with. The substance with the highest Tier 1 exposure amount is DINP, which is therefore listed first in Table 3.2.
Table 3.2 Substances identified in the screening analyses performed for the 10 consumer products in this project. It is stated if the substances are classified in accordance with the list of hazardous substances or the Danish Ministry of the Environment’s self-classification, and if the substances are on the EU candidate list of potential endocrine disruptors
3.7 Identified substances with potential endocrine disrupting properties
Eleven of the substances identified in the product screening are on the EU’s candidate list of suspected endocrine disruptors because they have shown signs of endocrine disrupting effects or are suspected of having such effects. These are:
- DINP (Group 2[9], DG Environment, 2007)
- DEHP (Group 1[10], DG Environment, 2007)
- DBP (Group 1, DG Environment, 2007)
- DIBP (Repr. Cat. 2; R61- Repr. Cat. 3; R62, EU, ESIS, 2009)
- Bisphenol A (Group 1, DG Environment, 2007)
- Polyfluoro compounds (Nordström Joensen et al, 2009)
- Tert Butylphenol (98-54-4) (Group 2, DG Environment, 2007)
- Dichloraniline (95-76-1)(Group 2, DG Environment, 2007)
- Diglycidyl bisphenol A(1675-54-3)(Group 2, DG Environment, 2007)
- Styrene (100-42-5) (Group 1, DG Environment, 2007).
The substances in italics are not included in the exposure calculations in this project. Common to these substances is the fact that they are exclusively identified in textile products, i.e. jackets, mittens and bed linen, and are measured in relatively small concentrations.
3.8 Literature review of endocrine disruptors
Previous surveying projects by the Danish Environmental Protection Agency also identified the following substances suspected of endocrine disrupting effects in products of relevance for 2 year-old children.
- BBP (in vinyl flooring and modelling wax)
- Dimethylformamide (68-12-2) (Group 3[11], DG Environment, 2007) (in tents and tunnels for children).
Of these substances, BBP is a focus substance in the exposure calculations included in this project.
Furthermore, two year-old children can be affected by endocrine disruptors from medicinal products and medical devices, which can constitute a considerable exposure. These sources, however, are not included in the exposure calculations for this project, partly because this type of exposure is only expected to affect a small number of children and partly because the exposure is considered to be necessary in all cases in which it occurs.
3.9 (Q)SAR predictions for substances with potential endocrine disrupting effects
Substances included in the cumulative risk assessment are chosen on the basis of prior knowledge of their effects. Animal studies have demonstrated that they have an endocrine disrupting effect.
However, many chemical substances are not tested on animals for their endocrine disrupting effects. We cannot therefore exclude that they have these effects. In recent years, a number of computer models have been developed, which can predict the properties of chemical substances on the basis of their structure ((Q)SAR: (Quantitative) Structure Activity Relationships).
(Q)SAR predictions from two different models have been used to identify whether some of the substances found in the screening, which had not previously been identified as having endocrine disrupting effects, do in fact have them (Jensen et al, 2008)
- Oestrogen reporter gene activation in in-vitro experiments
- Antagonism of androgen receptor activation in in-vitro experiments
The QSAR models used predict whether the substances have oestrogen-like or antiandrogenic effects in in-vitro (test tube) experiments, in which it is not possible to imitate the metabolism of chemical substances that occurs in the body. In these models, the substances are characterised as either positive or negative.
A (Q)SAR model is developed on the basis of the results of experiments on concrete chemical substances in the test for which the model is designed. The substances in this test are called the "training set”. The model can then be used to predict the effects of substances that appear similar to the chemicals in the training set. Among other things, the applicability of a model depends on how many different types of substance are tested. The prediction of the model is therefore always accompanied by an assessment of whether the substance, the effect of which is being tested, resembles the substances in the training set enough to be a reliable indicator, i.e. that the predictions of the model lie within its applicability domain. This analysis uses only reliable predictions.
Substances tested in vitro have the same uncertainties associated with this type of data. For example, bio-accessibility, absorption and metabolism are not included in in vitro experiments, but can be of crucial importance in terms of the harmful effects of substances on living organisms. Furthermore, it is not known whether the positively predicted substances have been tested on animals. It is therefore difficult to assess their potential potency and endocrine disrupting effects in humans. These are important parameters that enable prediction of the endocrine disrupting effect of the substances in humans.
The above reservations in terms of in vitro data also apply to (Q)SAR predictions as the models used to predict in vitro effects. There is also an element of uncertainty with (Q)SAR predictions. The model’s sensitivity, i.e. its ability to predict positive results correctly, and specificity, i.e. its ability to predict negative results correctly, are two important parameters to take into consideration when assessing the applicability of (Q)SAR models (see REACH guidelines R6: (Q)SARs and grouping of chemicals). However, there are no hard and fast rules for how high these figures can be – this depends completely on the context in which the models are to be used. Similarly, (Q)SAR model predictions should only be used within the applicability domain. Table 3.3 shows the two models together. Sensitivity and specificity are reached through repeated cross-validation of the models.
Table 3.3 Robustness of the (Q)SAR models
| QSAR Model | Number of chemical substances in training set | Sensitivity | Specificity |
| Oestrogen reporter gene | 481 | 46.4% | 94.9% |
| Androgen receptor antagonism | 523 | 64.4% | 84.2% |
3.9.1 Procedure
The 177 chemical substances with CAS numbers that were identified in the screening analysis were tested in the latest version of the Danish (Q)SAR database in relation to the two models in the above table. Of the 177 CAS numbers, 22 were not found in the database and are therefore not included in this analysis.
3.9.2 Results
Using the (Q)SAR models, other substances were also identified, which could have endocrine disrupting effects, in addition to the substances already included in the cumulative risk assessment.
Of the 177 substances identified in the screening analysis, we had already included one of them in the cumulative risk assessment for oestrogen-like effects (bisphenol A) and 4 of them in the cumulative risk assessment for antiandrogenic effects (4 phthalates).
A given prediction also provides information on whether the substance was included in the training set, and whether it tested positive or negative. Thus, with some of the substances tested, there were model predictions available for their properties, as well as information on whether they were tested using the in vitro model and its result.
Using the (Q)SAR model, 6 substances were identified as potentially oestrogen-like (Table 3.4). Three of the substances were identified as potential anti-androgens (Table 3.5). Some of the substances were also tested in vitro because they were included in the training set.
3.9.3 Oestrogen-like effects
In the (Q)SAR model for oestrogen-like activity, six substances from the screening analysis tested positive. Three of these also tested positive in vitro and are therefore also included in the training set. In this project, only bisphenol A is included in the cumulative risk assessment for oestrogen-like activity.
Table 3.4. Substances with positive (Q)SAR predictions for oestrogen-like effects in in vitro experiments
| CAS no. | Name | ER activisation in vitro QSAR prediction |
ER activisation in vitro Test result |
| 80-05-7 | bisphenol A | Positive | Positive |
| 2081-08-5 | 4,4-ethyldiphenol | Positive | Positive |
| 106-46-7 | 1,4-dichlorobenzene | Positive | Positive |
| 99-30-9 | 2,6-dichhloro-4-nitroaniline | Positive | Not tested |
| 827-94-1 | 2,6-dibromo-4-nitroaniline | Positive | Not tested |
| 36443-68-2 | Irganox 245 | Positive | Not tested |
Bisphenol A is already included in the cumulative risk assessment for oestrogen-like effects. In the screening analysis, 4,4-ethyldiphenol is found in bed linen prior to washing but not after. 2,6-dichloro-4-aniline and 2,6-dichloro-4-nitroaniline are found in jackets. Irganox 245 is found in diapers.
3.9.4 Antiandrogenic effects
In the model for antiandrogenic affects in the in vitro tests, three substances from the screening analysis tested positive. None of the substances were previously included in the cumulative risk assessment for antiandrogenic effects in this project.
Table 3.5. Substances with positive (Q)SAR predictions for anti-androigene effects in in vitro experiments
| CAS no. | Name | Antiandrogenic in vitro QSAR prediction |
Antiandrogenic in vitro Test result |
| 80-05-7 | bisphenol A | Positive | Positive |
| 2081-08-5 | 4,4-ethyldiphenol | Positive | |
| 52829-07-9 | Tinuvin 770 | Positive |
In the screening analysis, bisphenol A was found in the plastic parts of children’s pacifiers, although the migration analysis shows no release of the substance from the pacifiers. Bisphenol A is in any case commonly found in foodstuffs. 4,4-ethyldiphenol was detected in bed linen before, but not after, washing. Tinuvin 770 was detected in children’s mittens.
3.9.5 Conclusion on (Q)SAR predictions
QSAR predictions show that in the selected in vitro experiments, many of the 177 chemical substances have, or can be predicted to have endocrine disrupting effects. The identified substances, which are not already included in the quantitative risk analysis, have not been further assessed for endocrine disrupting effects in animals. However, it would seem obvious to proceed in this direction in future analyses of endocrine disruptors.
3.10 Conclusion on the identification of substances with potentially endocrine disrupting effects
In conclusion, the screening analysis, review of relevant literature and the (Q)SAR predictions show that 2 year-old children can be expected to be exposed to a variety of potential endocrine disruptors over and above those chosen as the focus for the quantitative risk assessment in this project. No further risk assessment has been performed for any of the identified substances that were not originally included in the quantitative risk assessment. However, these findings should be taken into consideration in future studies,
3.11 Identified substances with allergenic effects
Thirty-three of the identified substances are classified as R42 (may cause sensitisation by inhalation), or/and as R43 (may cause sensitisation by skin contact), by the EU or have the Danish Environmental Protection Agency (DEPA) advisory classification for these effects.
- Bisphenol A (EU classification R43)
- Formaldehyde (EU classification R43)
- p,p’-Diphenylmethane diisocyanate or Diphenylmethane diisocyanate (EU classification R42/43)
- 2,4-Diisocyanato-1-methylbenzene (2,4-Diisocyanate toluene) (EU classification R42/43)
- 2,5-Dichloraniline, 2,3-dichloraniline, or 1,4-dichloraniline (EU classification, R43)
- Isophorondiisocyanate-1-methylbenzene or similar (EU classification R42/43)
- Bisphenol A diglycidyl (EU classification R43)
- Aniline (EU classification R43)
- Toluene 2,4-Diisocyanate (EU classification R42/43)
- 1,6-Disocyanatohexane (EU classification R42/43)
- An unidentified isocyanate (EUclassification R42/43)
- 2-Mercaptobenzothiazole (EU classification R43)
- 2,4-bis (1-phenylethyl)-phenol (Danish Environmental Protection Agency (DEPA) advisory classification, R43)
- Tert. Butylphenol (DEPA advisory classification, R43)
- Isocyanatobenzene (DEPA advisory classification, R43)
- 2-Ethylhexyl fumarate (DEPA advisory classification, R43)
- 2-Ethylhexyl maleate (DEPA advisory classification, R43)
- Oleamide (3-Amino-4-methoxy-N-phenyl-benzamide) (DEPA advisory classification, R43)
- Melamine (DEPA classification, R43)
- Kodaflex txib or similar (DEPA advisory classification, R43)
- Hexadecyldimethylamine (DEPA advisory classification, R43)
- 2,6-Dibromo-4-nitroaniline or 4,6-Dibromo-2-nitroaniline (DEPA advisory classification, R43)
- 4-Chloro-2,5-dimethoxy-benzamine or 5-Chloro-2,4-dimethoxy-benzamine (DEPA advisory classification, R43)
- 1-Methylnapthalene (and isomers) (DEPA advisory classification, R43)
- 6-Chloro-2,4-dinitroaniline (DEPA advisory classification, R43)
- 2,6-Dichloro-4-nitroaniline(DEPA advisory classification, R43)
- Di-p-Tolyl sulfone (DEPA advisory classification, R43)
- Isocyanatobenzene or 1H-Benzotriazol(DEPA advisory classification, R43)
- 2-(Methylthio)benzothiazole (DEPA advisory classification, R43)
- Phenoxybenzamine (DEPA advisory classification, R43)
- Salicylic acid benzoyl ester (DEPA advisory classification, R43) (one of the 26 allergen compounds in perfumes and aromas)
- Limonene (EU classification R43) (one of the 26 allergenic compounds in perfumes and aromas)
- Linalool (one of the 26 allergenic compounds in perfumes and aromas)
3.12 Literature review of allergens12
Previous surveys undertaken by the Danish Environmental Protection Agency and others1 into chemical substances in consumer products have produced a long list of allergens which can occur in cosmetic products. Below is a list of allergens identified in these surveys. Substance names written in italics have also been identified at screening of the ten product groups represented in this project.
- 2,2,4-trimethyl-1,3-pentanediol diisobutyrate (TXIB) (R43)
- 2,6-Dimethoxy Benzoquinone (R43)
- 2-mercaptobenzothiazole (MBT) (R43)
- 2-Propenenitrile (R43)
- 2-Propenoic acid 2 methyl-methyl ester (R43)
- 4-chloro-3-methylphenol (R43)
- 4-Hydroxy-3,5-dimethoxy-benzandehyde (R43)
- 4-Nonylphenol (R43)
- Aniline (R43)
- Benzothiazole (MBT) (R43)
- Benzyl salicylate (2-hydroxybenzoic acid, benzyl ester) (R43)
- Bisphenol A (R43)
- Butylphenyl methylpropional (Lillial) (R43)
- Chlormethyl and methylisothiazolones (Kathon) (R43)
- Citral (3,7-dimethyl-2,6-octadienal) (R43)
- D-Limonene (R43)
- Formaldehyde (R43)
- Hydroxycitronellal (3,7-Dimethyl-7-hydroxy octanal (R43)
- IPPD (R43)
- Isoeugenol (2-Methoxy-4-(1-propenyl)phenol) (R43)
- Lilial (2-methyl-3-(4-tertbutylbenzyl)propionaldehyde) (R43)
- Nickel (R43)
- Nonylphenols (NP) (R43)
- O-toluenesulfonamide (R43)
- p-toluenesulfonamide (R43)
- TXIB= 1,3-Pentanediol, 2,2,4-trimethyl-, diisobutyrate (R43).
Table 3.3 illustrates the types of consumer products in which the identified allergens have been identified.
Table 3.3 The allergens have been identified in the following consumer products.
| Consumer products tested in this project | Consumer products tested previously |
| Jackets Mittens Pacifiers Bed linen Rubber boots |
Plasticine Carpets Textiles Clothes Air fresheners Electrical and electronic products (computer game joysticks, computer screens, TV’s, transformers) Toothbrushes Tents and shelters Cosmetic products (lip balm, soap, baby oils, massage oils, children’s’ shampoo, body shampoo for children, children’s soap, body lotion for children) Toys (wooden toys, slimy toys, aromatic toys etc) Baby changing mats/cushions Felt-tip pens Car interior care products Impregnated textiles Hobby paints Books Children’s make-up sets Rubber pacifiers |
The significance of exposure of 2 year-old children to allergens is not within the scope of this project even though, in general, children’s exposure to these substances should be reduced as much as possible.
3.13 Chemical substances identified in the screening with classification for other effects harmful to health
As can be seen in table 3.2 83 83 substances have been identified with the following general classifications, (according to the List of dangerous substances or The Danish Environmental Protection Agency’s advisory classification). Note that a substance can occur in more than one category:
- Irritant, Xi (18 substances)
- Harmful, Xn (25 substances)
- Toxic, T (9 substances)
- Very toxic, Tx (3 substances)
- Dangerous for the environment, N (34 substances)
- May coause sentitisation by inhalation and/or skin contact, R42 and/or R43 (33 substances)
- Carcinogenic, Carc (10 substances)
- Mutagenic, MUT (7 substances)
- Toxic to reproduction, Rep (11 substances)
A number of products have been classified as irritants (Xi), harmful (Xn), toxic (T), or very toxic (Tx). The current project has not focused on these substances, although they quite probably occur in the products with which 2 year-olds come into contact. Many of the classified substances are either carcinogenic or mutagenic, a fact that is also supported by Danish Environmental Protection Agency surveys of the same target group. The concentrations contained in these products are often very small and it has not been within the scope of this project to determine whether these constitute a health hazard. Instead, the project has focused exclusively on their endocrine disrupting effects.
[9] Group 2: Potential for endocrine-like effect. In vitro data indicates potential for endocrine disruptor effects in intact organisms. Also includes in vivo effects that are, or are not, indirectly endocrine disruptor.
[10] Group 1: Clear indication of endocrine-like effect. At least 1 in vivo study shows a clear indication of an endocrine disruptor effect in an intact organism.
[12] As well as DEPA's earlier surveys of chemical substances in children’s toys, previous tests also include the Danish Consumer Council's test on toys, tests from TÆNK (DCC's magazine) and surveys on consumer products (clothes) undertaken by Greenpeace.
4 Legislation
- 4.1 Toys
- 4.2 Textiles
- 4.3 Statutory order on cosmetics
- 4.4 Pacifiers
- 4.5 General regulations for limitations on use of certain substances
- 4.6 Foodstuffs, assessment of pollution from EFSA (European Food Safety Authority)
The following describes the relevant legislation for the product groups tested in the survey in this project:
- The statutory order on toys – relevant for toys (soft toys) and for bath soap packaging (cosmetic products for children), which the Danish Safety Technology Agency categorises as toys.
- The statutory order on the use of phthalates in toys – relevant for toys (soft toys) and for bath soap packaging (cosmetic products for children), which the Danish Safety Technology Agency categorises as toys.
- REACH regulation, Annex XVII, entry 43 on azo colouring agents in textiles – relevant for outdoor clothes, mittens, soft toys and bed linen.
- The statutory order on cosmetics – relevant for suntan lotion and oil-based cream.
- Regulation of other substances such as nickel, brominated flame retardants, TRIS, TEPA, PBB, PFOS, arsenic and mercury – relevant for products with textiles (mainly in REACH).
- Regulation of nitrosamines – relevant for pacifiers
- General regulations for limitation of use of various substances (transferred to REACH regulation as of 1 June 2009
4.1 Toys
4.1.1 Safety requirements for toys
The statutory order on safety regulations for toys and products which, due to their appearance, can be mistaken for foodstuffs (BEK no. 1116, 2003) applies to toys. Toys are defined as “any product or material designed, or clearly intended for use in play by children younger than 14 years of age”. Thus, the statutory order on safety regulations for toys also applies to cosmetic products designed for children, that resemble a popular article or figure, such as a dragon, Barbie, Mickey Mouse, mobile telephone etc.
According to the statutory order on Toys (BEK 1116, 2003), toys can only be placed on the market if they satisfy EU legislation on safety requirements for toys, or if they are produced in compliance with a prototype that has been approved by a competent body in an EU country. Toys that meet these safety conditions must be marked with a CE mark before they can be placed on the market.
The EU legislation on safety requirements for toys also includes the standards covered in the statutory order on Toys annex 3 (BEK 1116, 2003). These are the EN71 series on safety requirements for toys and the High Voltage Declaration for electrical toys. One of the points covered by EN71-3 (Section 3: Migration of specific substances) concerns threshold limits for the migration of metals when children put toys into their mouths.
In addition, toys must not contain dangerous substances or preparations, as defined in directive 67/548/EEC and 88/379/EEC in amounts that can harm the health of children.
A revised toy directive has recently been passed by the EU.
4.1.2 Ban on phthalates in toys
The statutory order on the ban on phthalates in toys and childcare products that came into force in September 2009 (BEK 855, 2009) includes a ban on phthalates in childcare products and toys for children up to 3 years of age.
According to REACH, Annex XVII, entries 51 and 52, it is forbidden to use, import or sell toys and childcare products for children less than 14 years of age containing the phthalates DEHP, DBP and BBP in concentrations above 0.1%. DINP, DIDP and DNOP are forbidden to use, import or sell in concentrations above 0.1% in toys and childcare products that children are able to put in their mouths.
According to the statutory order it is forbidden to use all other phthalates in concentrations above 0.05% in all toys and childcare products for children from 0-3 years of age.
4.1.3 REACH
The REACH regulation 1907/2006 also covers aromatic toys (products which intentionally have a smell). In these cases, the aroma produced by the toy must be registered with the Chemicals Agency if the amount equals or exceeds 1 ton per year (EU regulation no. 1907/2006)
4.2 Textiles
Textiles must not contain a number of chemical substances. The regulations also include textiles used in toys:
- Brominated flame retardants, penta -and octabromodiphenylethers (penta and octa-BDE) are banned for any usage, including textiles. (REACH, Annex XVII, entries 44 and 45) Threshold limit is 0.1% (w/w).
- Impregnants tris (2, 3-dibrompropyl) phosphate (TRIS), tris (1-aziridinyl) phosphineoxide (TEPA), (CAS no. 5455-55-1) and polybrominated biphenyls (PBB) (CAS no. 59536-65-1) must not be used in textiles which are intended to come into contact with the skin, e.g. articles of clothing or linen. The ban covers both import and sale (REACH, Annex XVII, entries 4, 7 and 8).
- Import, sale and export of mercury or products containing mercury are prohibited (BEK 627, 2003). This ban also includes textiles.
- The sale, import or production of products containing cadmium is banned (BEK 858, 2009) if the cadmium is used as a stabiliser in plastic, cadmium coatings or pigmentation. Cadmium is also regulated in REACH, Annex XVII, entry 23.
- The import or sale of products containing lead is prohibited (BEK 856, 2009). The ban also includes textiles.
- Textiles must not contain pentachlorophenol (PCP). The import, export, sale or use of products containing 5ppm or above of pentachlorophenol, or of its salts or esters is prohibited (BEK 854, 2009)
- Textiles must not contain certain azo colouring agents. The regulations also apply for textiles used in toys. It is prohibited to import, sell or use a specific blue azo colouring agent and azo colouring agents, which can release carcinogenic substances, as well as certain other products, which contain azo colouring agents (REACH, Annex XVII, enry 43).
- Products which are designed for direct or long-term contact with the skin must not contain nickel if the nickel emission exceeds 0.5 mg/cm2/week (REACH, Annex XVII, entry 27).
- In accordance with REACH, Annex XVII, entry 53 PFOS (perfluorooctane sulfonate and its derivatives) are prohibited in products, including textiles, from 27 June 2008. Special notice should be taken of the ban on textiles or other materials with a coating, if the amount of PFOS comprises 1 µg/m2 or more of the coated material.
4.3 Statutory order on cosmetics
Cosmetic products for children are, like other cosmetic products, regulated by the statutory order on Cosmetic Products (BEK 422, 2006) and its amendments. The statutory order implements European resolutions on cosmetics and contains a number of decisions relating to the use of chemical substances in cosmetics and their marking. The cosmetic directive has recently been revised and will become applicable throughout the EU.
In accordance with the statutory order on Cosmetics, section10, products marketed in the EU must not be harmful to health when they are used under “normal conditions, or under conditions that can be reasonably predicted”. An evaluation must be conducted prior to marketing on the safety with regards to human health at use of the finished cosmetic product. This must include specific evaluation of the cosmetic products intended for children younger than three years old.The statutory order on Cosmetics also imposes a number of limitations on use of chemical substances in cosmetic products. Companies or organisations marketing cosmetics are responsible for making sure that the rules are adhered to in accordance with the statutory order.
4.3.1 List of ingredients
The following special conditions are applicable for the list of ingredients for cosmetic products (BEK 422 section 25, 2006:
- Impurities present in raw materials are not considered ingredients.
- Perfume and aromatic compounds and raw materials for these will be declared as either “perfume”, or “aroma”. In accordance with Annex 3 of the statutory order, 26 allergens in perfumes and aromas substances must be indicated in the list of ingredients if their concentration exceeds 0.001% in leave-on products, and 0.01% in rinse-off products. This rule on the 26 allergens in perfumes and aromas came into force in 2005 and applies to all cosmetics produced after 10 March 2005.
- Ingredients with a concentration of less than 1% can be declared in any order following those with a concentration higher than 1%.
- Colouring agents can be declared in any order after those with a colour index number (or name from Annex 4 on colouring agents).
- Ingredients can be declared by their common name, in accordance with common nomenclature (INCI name) for cosmetic ingredients.
- With small cosmetic products, or packaging that is so small that it is impossible to print a list of ingredients of contents, the ingredients must be printed on an accompanying label, tape, or card that can be attached to the product. If it is not possible to fasten information of this type onto the product, the list of ingredients must be clearly displayed close by.
INCI is an abbreviation for “International Nomenclature Cosmetic Ingredients” and is a common nomenclature for use on lists of ingredients of content for cosmetic products in the EU. An INCI name can cover many different chemical substances. The INCI list is indicative, which means that it is not a list of permitted ingredients in cosmetics, but indicates which ingredients have been used. If there is no INCI name for a substance, its chemical name must be used and an INCI name must be applied for (BEK 422, 2006)
4.3.2 Substances with restrictions on use in cosmetic products
The statutory order on Cosmetics (BEK 422, 2006) places a number of restrictions on use of substances in cosmetic products, e.g. which substances may not be used in cosmetic products, which substances may only be used under certain conditions (e.g. maximum concentration), and which substances may only be used (positive lists) within a specific group (e.g. colouring agents, preservatives).
Substances which are not permitted in cosmetic products
In accordance with the statutory order on Cosmetics section 12, substances which are included in Annex 2 of the statutory order must not be used as ingredients in cosmetic products.
Substances which are permitted in cosmetic products with certain restrictions
In accordance with the statutory order on Cosmetics section 13, substances which are included in Annexes 3-6 can only be allowed in cosmetic products in accordance with the stipulated restrictions and conditions of the annexes.
Colouring agents permitted in cosmetic products
The statutory order on Cosmetics section 14, states that cosmetic products (with the exception of the colouring agents used exclusively in hair colours) may only contain the colouring agents and sprays, salts and pigments, which are named in Annexes 3 and 4, including their stipulated limitations and conditions.
Preservatives permitted in cosmetic products
In accordance with the statutory order on Cosmetics section 15, cosmetic products must not contain preservatives other than those named in Annex 5. There are exceptions, which can be seen in section 15 of the statutory order.
UV filters permitted in cosmetic products
In accordance with the statutory order on Cosmetics section16, cosmetic products must not contain UV filters other than those named in Annex 6 (of the statutory order). There are, however, other UV filters, which are only used in cosmetic products to protect the products themselves from being broken down by UV radiation, which are not included in Annex 6.
4.4 Pacifiers
For pacifiers, see Directive 93/11/EEC from 15 March 1993 on the emission of N-nitrosamines and N-nitrosatable substances from baby’s bottle teats and pacifiers made with elastomers and rubber (Directive 93/11, 1993).
This states that pacifiers and bottle teats must not release N-nitrosamines and N-nitrosatable substances, which are dissolvable in saliva in amounts that exceed the following:
- 0.01 mg total amount released N-nitrosamines/kg (from those parts of the pacifier or bottle teat made with elastomers or rubber).
- 0.1 mg total amount emitted N-nitrosatable substances/kg (from those parts of the pacifier or bottle teat made with elastomers or rubber).
4.5 General regulations for limitations on use of certain substances
There is a comprehensive list of regulations on the limited usage of certain substances, which in many cases apply generally.
These general limitations on use are:
- (EU/DK) REACH, Annex XVII, entry 23 and Statutory order No. 858 of 5 September 2009 on the ban on sale, import and production of goods containing cadmium.
- (DK) Statutory order No. 854 of 5 September 2009 on the ban on import, sale, use and export of goods containing pentachlorophenol (PCP)
- (EU) REACH, Annex XVII, entry 27 on ban on the import and sale of certain products containing nickel (metal parts and parts with long-term contact with the skin).
- (EU) REACH, Annex XVII, entry 43 on the ban on import, sale and use of certain azo colouring agents.
- (EU) REACH, Annex XVII, entry 53 on the limitation of import, sale and use of perfluorooctane sulphonates (PFOS).
- (EU/DK) REACH, Annex XVII, entries 51 and 52 and Statutory order No. 855 of 5 September 2009 on the ban on phthalates in toys and childcare articles.
4.6 Foodstuffs, assessment of pollution from EFSA (European Food Safety Authority)
Substances such as pesticides, phthalates and bisphenol A, mentioned in this report, are assessed by the EFSA based on studies on possible health risks. Pesticides require 2nd generation studies, which include studies on potential endocrine disrupting effects.
The analysis typically concludes with a figure for tolerable daily intake (TDI), which is given as mg/kg body mass/day, or acceptable daily intake (ADI). Legislated threshhold limits are set using this evaluation, and are intended to ensure that there are no health risks associated with intake of these substances during a lifetime.
The the threshold limits for phthalates in food contact materials and articles, have been set taking into account substances originating in other sources.
5 Survey
- 5.1 Delimitation
- 5.2 General conditions of the survey
- 5.3 Outdoor clothes
- 5.4 Footwear
- 5.5 Pacifiers[13]
- 5.6 PVC bath soap packaging
- 5.7 Non-slip figures and bath mats
- 5.8 Soft toys
- 5.9 Diapers
- 5.10 Sunscreens
- 5.11 Moisturising creams/ oil-based creams/lotions.
- 5.12 Bed linen
Twelve product groups were selected based on knowledge of previously examined substances and products.
The aim of the survey has been to:
- Add to existing knowledge/surveys of products used daily by 2 year-old children.
- Identify within each product type the products most used by 2-year-olds.
- Find out what materials the individual product types are made from.
- Attempt to gather together all information available on the materials – including constituent substances.
- Obtain products for chemical analysis.
The survey comprises the following 12 product groups:
- Outdoor clothes made from impregnated textiles, e.g. jackets, which are marketed as being waterproof, or water-resistant (PVC rain wear are also included if the articles appear as part of the survey).
- Mittens of the same material as all-in-one suits.
- Footwear in the form of rubber clogs.
- Footwear in the form of unlined rubber boots.
- Pacifiers, primarily those in which the plastic part is made of polycarbonate.
- Bath soap packaging shaped like popular figures/animals as well as other containers for children’s soap made from PVC.
- Non-slip figures and bath mats.
- Soft toys.
- Diapers.
- Sun cream.
- Moisturising cream/oil-based creams/lotions.
- Children’s bed linen.
The product groups have been chosen according to; exposure, expected content of substances, relevant reporting arenas, and existing product information.
A complete survey of all products within the individual product groups has not been undertaken although it includes as many of the most sold products/brands as possible. This has been achieved partly through contact with trade associations and other retail organisations to gather information on which shops carry the greatest range for each product group, and partly by contact with individual shops (retail and internet), and talking to employees about which products/models sell best.
The following first describes the general delimitation and then general conditions of the survey. Subsequently, the product types will be described individually.
5.1 Delimitation
The survey focusses exclusively on consumer products for 2-year-old children.
This survey only covers products that are marketed in Denmark, either through retail outlets, or in Danish web shops.
5.2 General conditions of the survey
The premise is that, in relation to the rest of the population, parents of small children are frequent net shoppers and that it is mostly mothers who purchase the products for their 2-year-olds.
5.2.1 Contacts
Initially, a number of trade associations and large supermarket chains, toy chains and other outlets were contacted to find out which products, out of the individual product groups and product categories in the survey, were the most sold products on the Danish market.
5.2.2 Sizes
Childrens’ clothing products were purchased in sizes 92-98 and shoe sizes 23-26, which are considered to be average sizes for 2-year-olds.
Retailers were also contacted and asked in advance, whether they considered the soft toys and bath toys that were to be sampled in the survey, to be suitable for 2-year-olds.
5.3 Outdoor clothes
The survey focuses on outdoor clothes made with impregnated textiles, i.e. outdoor clothes which are marketed as being waterproof, water-resistant, or dirt-resistant.
As the campaign week for the project was originally set for week 25, i.e. during the summer, it was aimed at finding clothing suitable for that time of year (windcheaters and other lightweight outdoor clothing). However, as the survey actually took place in October, it was impossible to find that type of clothing in the shops, so lined jackets and winter jackets were added to the samples.
Mittens made from impregnated material and marketed as being waterproof, water-resistant, or dirt-resistant are also included.
5.3.1 Legislation
Legislation applying to outdoor clothing has different limitations on use of substances such as brominated flame retardants, impregnation substances, PFOS and its derivatives, heavy metals, nickel, etc. These are described further in section 4.2 Textiles.
5.3.2 Delimitation
The survey includes impregnated outdoor clothes, for instance, textile jackets or coats suitable for season changes (spring/autumn) and lined jackets/winter jackets.
Mittens made from the same material as all-in-one suits were also included. The survey focuses on outdoor clothes and mittens, which are marketed as being either waterproof, or water resistant.
Skiwear is not included in the survey.
Rainwear is not generally included in the systematic survey, but is included whenever the survey encountered PVC rainwear. Internet searches were made for PVC rainwear and during shop visits enquiries were made as to whether the retailer stocked PVC rainwear.
5.3.3 Description of product type in use
The types of impregnated jackets and coats that were originally targeted in the survey were primarily those that could be used during spring and autumn, however, this type of clothing can also be used during the winter months in situations in, which all-in-one suits are inappropriate, e.g. car journeys.
As mentioned previously, it was not possible to find this type of clothing during visits to retailers in October, so lined jackets and winter jackets for normal outdoor use were also included in the survey.
Two-year-old children are primarily exposed to substances in their outdoor clothes and mittens either by sucking cuffs and mittens, or by sucking/playing with hanging parts - reflectors, zips etc.
5.3.4 Survey of the range of outdoor clothing
5.3.4.1 Procedure
An enquiry was made to The Danish Chamber of Commerce for contacts with trade associations.
Coop, Dansk Supermarked, Jysk and Matas were contacted to ask which brands and trade names they carried, which were the best sellers and how large a proportion of total sales in Denmark they accounted for.
A number of retail chains (baby chains) specialising in baby articles were also contacted, including BabySam, Ønske Børn and BabyVest.
A number of retailers in the Århus area were visited for the survey on jackets and mittens. These included the following:
- Føtex
- Bilka
- Kvickly
- BabySam
- BabyVest (not nation wide, but has shops in Jylland and on Fyn)
- LIC (Lærernes indkøbscentral – a purchasing cooperative for teachers)
- H&M
- Magasin
- Salling (not nation wide, but has shops in Aalborg and Århus)
- Kære Børn
- Name It
- Zara
- Lego Shop (shop in the Århus area)
- Krutter (shop in the Århus area)
- Made in (shop in the Århus area)
- Hønsefødder (shop in the Århus area)
- Kits (shop in the Århus area)
- Millemarengs (shop in the Århus area)
- Okker Gogger (shop in the Århus area)
- Prinsessen og Ridderen (shop in the Århus area)
In addition, catalogues, advertisements etc, were also surveyed.
The Google search engine was used, using various search words and combinations of the same. This was done in order to gain a general impression of the market for impregnated jackets and mittens and to find net vendors and retailers which stock these products.
The search also included a number of specific websites.
5.3.5 Survey results
5.3.5.1 Products
This survey focuses on outdoor clothes made with impregnated textiles, i.e. clothes which are marketed as being waterproof, water-resistant, or dirt-resistant.
The products are generally supplied with information on the construction of outer material and lining. In most cases, the product has washing instructions.
In the survey of impregnated jackets, information from stockists on product materials was registered. This concerned jackets with an outer material of 100% nylon, coated cotton, beaver nylon, 100% cotton, 100% Eco-Tex certified wool, polyester and polyamide/polyurethane.
With mittens, outer materials of nylon, polyamide, polyester and cotton were registered.
Textiles marketed as being waterproof can be impregnated or coated, typically with PU (polyurethane).
To become waterproof, or water-resistant, clothes can have:
- Impregnated outer surfaces.
- Plastic coatings on the outer surface or rear.
- Membranes on the rear, or as a laminate in between the outer and inner materials.
The impregnation will most probably contain fluorine (certain exceptions can be use of a silicone compound to provide the water-resistant effect). Most common will be fluorocarbon compounds, but fluorotelomers can also be found. There is also a probability that membranes will contain fluoro-polymer compounds. Plastic coatings can be of polyurethane or polyvinyl chloride and perhaps other types of polymer, which may also contain fluoro-compounds.
5.3.5.2 Results of surveying via trade associations and large retail chains
The Danish Chamber of Commerce
The Danish Chamber of Commerce did not consider itself able to contribute information to the survey. The organisation says that companies cannot be expected to furnish information on which products sell best, as this could mean that these products would almost certainly be selected for analysis and possibly "exposed". The Danish Chamber of Commerce therefore suggested that contact be made directly with the larger baby retailers.
Coop
No reply was received to our inquiry about trade names and market share. Information was received that waterproof coatings are used.
Dansk Supermarked
No replies were received to our request.
Baby chains
No replies were received to our request.
5.3.5.3 Result of surveying via the web
Jackets
Several websites were visited and, using Google, eight relevant online webshops were found.
Six different search criteria were used. "Windcheaters children" returned around 8,290 results, "spring/autumn jackets children" returned around 4,540 results, "windcheaters baby" returned around 10,900 results and "anorak children" returned around 108,000 results.
With the first search criterion, "windcheaters children", the first 11 pages were further examined for possible vendors. Each page contained 10 results, i.e. 110 results in all. This was done either via the search engine’s short summaries, or by visiting the individual websites.
The number of visited pages fell in the subsequent searches, as there were many repeats from previous searches.
Mittens
Several websites were visited and, using Google, and eleven relevant online webshops were identified.
"Waterproof mittens" - returned 13,000 results. The first 11 pages were examined for possible vendors. Each page contained 10 results, i.e. 110 results in all. This was done either via the search engine's short summaries, or by visiting the individual websites.
5.3.5.4 Results of shop visits
Jackets
It proved impossible to find thin, impregnated jackets in the shops during the actual period of the survey (October 2008), which would have been possible during the originally planned campaign week (week 25, 2009). Shop personnel reported that they just did not stock that type of clothing at this time of year.
A number of winter jackets were examined during the shop visits.
One retail chain reported that they no longer stocked PVC rainwear and that PVC had been phased out in their shops a number of years previously. The retailer doubted that it would at all be possible to find PVC rainwear for children these days. When asked if they stocked PVC rainwear, all the other shops visited also replied that they did not.
Mittens
The general picture is that supermarkets stock one brand, which can be found in a range of colours and possibly, designs.
5.3.5.5 Product list
Product list - jackets
Table 5.1 and Table 5.2 present a range of products registered during the course of the survey.
Table 5.1 Examples of waterproof/water-resistant jackets from the survey - webshops
The following list shows products which have been registered during visits to retailers. All products are of sizes suitable for 2 year-olds.
Table 5.2 Examples of jackets from survey - shop visits
| Retailer | Product name | Product description (directly from garment) | Price |
| Føtex | JDL Essentials | Outer material: polyester Lining: Fleece, polyester. |
99.75 kr. |
| Lego Butikken | Lego-Tec Wear | Windproof, waterproof and breathable. Produced by Kaboki. Made from 100% Oxford polyamide or polyester. Extra impregnated. Lego-Tec jacket is made from flying-suit (all-in-one) material. | 700 kr. |
| Okker Gokker. | Okker Gokker | Outer material: 100% Nylon Cordura. Stitching: 100% Polyester. Padding: 3M Thinsulate. | 649 kr. |
| Magasin | Reima-Tec: Malli | Windproof, waterproof and breathable. Outer material of 73% Polyamide, 27% polyethane. Lining: 100% Polyamide. Also available as all-in-one suit. | 800 kr. |
| Magasin | Ver de Terre: Moon | Shell Fabric: 100% nylon. Padding: 100% polyester. Thermoliote plus (which is what makes it waterproof – according to the sales assistant). | 1200 kr. |
| Magasin | Mini A Ture: Elvin 301 | Shell: 100% nylon. Downproof and water-repellent. Lining: 100% nylon. Filling: 70% down and 30% feather. | 1299 kr. |
| Magasin | CupCake: CC-501-296-arm | Windproof, waterproof and breathable. Shell: 100% nylon. Lining and padding: 100% polyester. Also available as all-in-one suit. | 899 kr. |
| Magasin | Molo: Arctic | Thermolite. Outer material: 100% Polyamide. Lining and padding: 100% Polyester. Magasin in Århus stock 7 brands, which are classified as waterproof, meaning that they can withstand a water pressure of 5000 mvp or above (according to the sales assistant). |
900 kr. |
| Salling | Ticket to Heaven: Janus | Windproof, waterproof and breathable. The jacket is guaranteed waterproof. The outer material is of nylon and the lining and stitching of polyester. | On offer: 299 kr. |
| Salling | Mala: Maria | Thinsulate 3M. Outer material: 100 5 cordura. Lining: 100% polyester. Also available as all-in-one-suit. | 659 kr. |
| Salling | Me Too: Karla | Windproof, waterproof and breathable. Outer material: 100% nylon. Lining: 100% nylon. Padding: 100% polyester. | 599 kr. |
| Salling | Minymo: Vega 3 | Anorak. Windproof, waterproof and breathable. Thinsulate. 100% Nylon Oxford. | 499 kr. |
| Salling | Noa Noa | Waterproof (WP7000) and breathable. Made from polyamide and polyester. Salling stock 8 brands, which are classified as waterproof, meaning that they can withstand a water pressure of 5000 mvp or above (according to the sales assistant). |
Forgot to note price |
| H&M | H&M | Water-resistant. Made from polyamide and polyester. | 298 kr. |
| H&M | H&M | Water-resistant. Made from polyester. Detachable hood. | 349 kr. |
5.3.5.6 Product prices
During the survey, jackets were registered in a price range from 100 – 1,299 kr.
5.3.5.7 Selected products
There is no information on whether the examined jackets were impregnated or not, but all were marketed as either waterproof, or water-resistant. As mentioned previously, jackets that are marketed as waterproof, or water-resistant can be either impregnated or coated – sometimes both. It is not possible to see whether a jacket is impregnated, or not.
Five products were selected from the product group for detailed studies.
Every effort was made to select popular brands from a wide price range.
Product list - mittens
Table 5.3 and Table 5.4 show a range of products registered in connection with the survey.
Table 5.3 Examples of waterproof/water-resistant mittens from survey - webshops
| Webshop | Product name | Description (directly from website) | Item price | Sizes | Direct link |
| Mille-mi.dk | Cupcake | Waterproof and breathable. 100% polyester. Linings: 100% cotton, fleece lining. |
269 kr. | 92-116 cm | http://mille-mi.dk/ |
| Miniature.dk | Miniature | Windproof, waterproof and breathable. Zip and velcro |
270 kr. | 2-7 Years | http://www.miniaturen.dk/ |
| Tinyzone.dk | Minymo | Waterproof. Effective down to -20C | 99 kr. | 1-10 Years | http://www.tinyzone.dk/ |
| Tinyzone.dk | ABEKO | 100% waterproof. Lined with cotton fleece. With design. |
89 kr. | 1-10 Years | http://www.tinyzone.dk/ |
| Smartkids.dk | Legowear Lego | 100% waterproof. 100% nylon. Rubber-grip on palms. With design. |
149,75 kr. | 1-7 Years | http://www.smartkids.dk/ |
| Smartkids.dk | Legowear Duplo | 100% waterproof. 100% nylon. |
99,75 kr. | 1-7 Years | http://www.smartkids.dk/ |
| Smartkids.dk | Fransa Kids | Wind and waterproof at 3000mm. Outer material 100% polyamide, lining 100% polyester. |
149,75 kr. | S-L 1-2 Years 3-4 Years 5-7 Years |
http://www.smartkids.dk/ |
| Børnebiksen.dk | Reima tec-mittens | Windproof, waterproof and breathable. Mittens contain X-static which is and effective fibre system with silver fibres. Silver has natural anti- bacterial properties that resist the growth of bacteria and mould in the material. Fleece lining The fibres are therefore effective against odours. Silver also has superior thermo-dynamic properties which keep the fingers extra warm. X-static prevents static electricity and retains its properties for the entire product lifetime. |
239,95 kr. | 0-4 Years | http://www.bornebiksshop.dk/ |
| Modebanditten.dk | Troll | Wind and waterproof. Wool lining. | 289 kr. | 1-5 Years | http://www.modebanditten.dk/ |
| Prinsesserog pirater.dk |
Hesta | Water-resistant. | 200 kr. | 0-3 Years | http://www.prinsesserogpirater.eu/ |
| Prinsesserog pirater.dk |
Reima Corno mittens | Can be tumble-dried…Same technical properties as "Sommen" all-in-one-suit. | 239 kr. | 2-4 Years | http://www.prinsesserogpirater.eu/ |
| Miniature.dk | Ticket. | Windproof, waterproof and breathable. Fleece lining |
149,95 kr. | 0-2 Years | http://www.miniaturen.dk/ |
| Babysmart.dk | Alfons Åberg. | Waterproof. With design. Rubber-grip on palms. Reflective tape. |
79 kr. | 1-3 Years | http://www.babysmart.dk/ |
| Noahogvictoria.dk | Didrikson | Waterproof. With design. Reflective tape. |
149,95 kr. | 0-4 Years | http://www.noahogvictoria.dk/ |
| Olgasoldebørn. dk |
Mini A Ture | 100% waterproof. Outer material: 100% breathable, windproof nad waterproof nylon Inner material: 100% polyester fleece Lining: 100% High Performance polyester. With design. |
249 kr. | 2-9 Years | http://www.olgasoldeboern.dk/ |
| Babytex.dk | Zipizi | Wind and waterproof. Plush lining With design. |
75 kr. | 1-4 Years | http://babytex.dk/ |
The following list shows products which have been registered during visits to retailers. All products are of a size suitable for 2 year-olds.
Table 5.4 Examples of waterproof/water-resistant mittens from survey - webshops
| Product name | Retailer | Price | Comments |
| Alpine junior mitten | Bilka | 49.95 kr. | Available in several colours |
| Units children’s' mitten | Kvickly | 79,95 kr. (2 pack) | Nylon - Available in several colours |
| Mikk-line | BabySam BabyVest |
69 kr. On offer, normal price 129 kr. | Available in several colours |
| Reima Tec x-static | BabyVest Magasin |
299 kr. 240 kr. |
Available in several colours |
| Reima | BabyVest Magasin |
99 kr.-99 kr. | Available in several colours |
| No name Thinsulate lining | Bilka | 49.95 kr. 79 kr. |
Various models - Available in several colours |
| No name Thinsulate lining | H&M | 79 kr. | Various models - Available in other colours |
| No name | H&M | 79,95 for 2 pack | Available in several colours Only information "Made in China" |
| Hello Kitty | H&M | 49,75 kr. | |
| Friends | Kvickly | 69.95 kr. | Various colours and patterns |
| Coop Unitsport | Kvickly | 79.95 kr. | Various colours |
| North Field | Føtex | 49,85 kr. | Available in several colours |
| Ticket | Magasin | 149,95 kr. | Available in several colours |
| No name | Magasin | 69.95 kr. | Available in several colours |
| Cupcake | Magasin | 269 kr. | Available in several colours |
| Molo | Magasin | 150 kr. | Available in several colours |
At all shop visits in Table 5.4 (except those at Bilka and Føtex), information was available on whether the mittens were waterproof, or water resistant. At Bilka and Føtex, however, it was not possible to find staff who knew anything about children’s clothes.
The sales assistant in the children’s department at Magasin said that all mittens are waterproof to a certain extent. The most waterproof are Reima-tec, then Ticket, Cup Cake and Molo. There are also standard Reima mittens, although these are not as waterproof as Reima-tec. The sales assistant said, without being asked, that mittens are often made of the same material as all-in-one suits, but are coated with a substance that makes them waterproof.
H&M say that four of the types of mitten they sell are water-resistant and 100% polyester. All types are unnamed. Three of them are termed "ski-mittens" on the H&M website, while the fourth is simply "mittens". Hello Kitty mittens are not stated as water-resistant on the H&M website, even though on a shop visit they were said to be so.
Mikk-line mittens are made of Kaporous material, which is a registered trade name like Teflon, Gore-tex, etc. Kaporous material is claimed to be wind and waterproof.
Coop says that their waterproof mittens have a PU coating.
5.3.5.8 Product prices
The survey registered mitten prices varying from 40 kr. per pair (2 pack 79.95) and 299 kr. per pair.
5.3.5.9 Selected products
There is no information on whether the mittens in the survey are of the same material as the all-in-one suits (according to product specifications, all-in-one suits are made of various materials, although are often stated as being 100% nylon).
The survey has only looked at mittens where the material "looks like" that of all-in-one suits and where the shop personnel have stated that the mittens were either waterproof, or water-resistant.
In all, five products were selected for detailed study from the product group – mittens.
Every effort was made to select popular brands from a wide price range.
5.4 Footwear
The survey focuses on footwear which could be expected to be worn during the campaign period for the project (originally week 25), which is during the summer. Thus, two types of footwear were examined; rubber boots and rubber clogs.
5.4.1 Legislation
The legislation applicable to footwear has different limitations on use of substances such as PFOS and its derivatives, heavy metals, nickel, etc.
5.4.2 Delimitation
In the survey, rubber boots are defined as waterproof boots made from either plastic or rubber. The survey is limited to rubber boots without lining.
The expression "rubber clogs" describes a clog-like product, probably of a thermo-plastic material (TPE), for example, an EVA-type.
5.4.3 Description of product type in use
Rubber boots are presumed to be used primarily in spring, summer and autumn, although unlined boots, often worn with thick woollen socks, are also likely to be worn in the milder winter months.
Rubber boots are probably also only worn for a limited number of hours, or at a maximum, during the 120 rainy days which the DMI (Danish Meteorological Institute) says is normal for Denmark.
Rubber clogs are worn both indoors and outdoors, during the summer, but during the winter, primarily as indoor shoes. Some models have a detachable lining.
Children are mainly exposed to the substances used in rubber boots and rubber clogs if they wear them with bare feet, or if the material comes into contact with bare legs (edges of rubber boots). If the children sweat, there is an even greater risk of migration from the product. It is also quite conceivable that 2 year-olds may suck their rubber clogs – especially if they are being used indoors at home.
5.4.4 Survey of the range of footwear
5.4.4.1 Procedure
An enquiry was made to The Danish Chamber of Commerce for contacts with trade associations.
Coop and Dansk Supermarked were contacted to ask which brands and trade names they stocked, which were the best sellers and how large a proportion of total sales in Denmark they accounted for.
An enquiry was made to Crocs Danmark concerning: the material the footwear is made from; which models are available and stocked in Denmark for 2 year-old children; and if similar products are available.
A number of retail chains specialising in baby articles were also contacted, including BabySam, Ønske Børn and BabyVest.
Several retail outlets were visited. These include the following:
- Føtex
- Bilka
- Kvickly
- H&M
- LIC (Lærernes indkøbscentral – a purchasing cooperative for teachers)
- Tops Sko
- BabySam
- BabyVest
- Deichmann sko
- Intersport
- Magasin
In addition, catalogues, advertisements etc, were also surveyed.
Google was used for the survey, using various search words and combinations of the same. This was done to find general details of rubber clogs and rubber boots on the market and to identify a number of webshops selling them.
A number of specific websites were also searched.
5.4.5 Results of survey
5.4.5.1 Products
On their website, Crocs state that their clogs are made from "Croslite TM with closed cells which are neither plastic, nor rubber". This could indicate that they are made from a thermoplastic elastomer (TPE), for example an EVA type.
Crocs Danmark say that the content of Crocs is secret and that they cannot reveal any more details of the composition of the material.
Rubber boots, on the other hand, are usually made from natural rubber, although an alternative can be chloroprene, PVC and polyurethane.
5.4.5.2 Results of survey via trade associations and large retail chains
The Danish Chamber of Commerce
The Danish Chamber of Commerce did not consider itself able to contribute information to the survey. The organisation says that companies cannot be expected to furnish information on which products sell best, as this could mean that these products would almost certainly be selected for analysis and possibly "exposed". The Danish Chamber of Commerce therefore suggested that contact be made directly with the larger baby retailers.
Coop
No replies were received to our enquiry.
Dansk Supermarked
No replies were received to our enquiry.
Baby chains
No replies were received to our enquiry.
Crocs
Reply to enquiry: Crocs Danmark say that the content of Crocs is secret and that they can not reveal any more details of the composition of the material.
5.4.5.3 Result of surveying via the web
A number of website were visited and 17 relevant online webshops were found using Google.
Rubber clogs
The search words "Crocs children" were used, which gave around 380,000 results. The first 11 pages were examined for possible retailers. Each page contains 10 results, which is 110 results in all. The survey was carried out using Google's short summaries, or by visiting the actual website. In addition, a search for "clogs children" gave around 1,910 results, out of which two webshops selling Crocs-like products to the age group were found.
Rubber boots
Four different search criteria have been used:
- "Unlined rubber boots children" - returned approx. 71 results.
- "Textile lined rubber boots" - returned approx. 8 results.
- "Textile lined rubber boots children" - returned 5 results.
- "Rubber boots children lined" - returned approx. 62,000 results.
Using the search words "unlined rubber boots children", around 20 websites were visited and the rest were checked using the Google short summaries. Using the search words "textile lined rubber boots", 6 out of 8 hits were visited and with "textile lined rubber boots children", two websites were visited. Using the search words "rubber boots children lined", the first 11 pages were checked for possible retailers. Each page contained 10 results, giving 110 results altogether. This survey was done using the Google short summaries or by visiting individual websites.
5.4.5.4 Results of shop visits
Rubber clogs
There were only a few shops at this time of year that stocked rubber clogs in children’s sizes. Kvickly stocked one model with a detachable lining, as did Deichmann Sko.
At Bilka, rubber clogs (without name) were found in a box with left-over items at reduced price.
In their direct-mail catalogue for week 41, Kvickly advertise a rubber clog with detachable lining for 69.96 kr.
A rubber clog called "iplay" was found at Layette baby articles in Allerød.
Rubber boots
Tops Sko registered many different types of rubber boot. The sales assistant said they had a large range, but could not really say which the best were. They did not, however, sell many of the small sizes in the Hunter range (a relatively expensive boot, retailing at 499.75 kr).
Ecco Sko stocked only one model. The sales assistant said they hardly ever sold rubber boots. In spite of a reduction in price from 499 kr to 299 kr. they still did not sell "People get them cheaper at Føtex".
5.4.5.5 Product list
The following tables; Table 5.5 and Table 5.6 present a list of products within the product group rubber clogs registered during the survey. All the products were sold in sizes suitable for a 2 year-old (23-26).
Table 5.5 Examples of rubber clogs from the survey - webshops
| Webshop | Product name | Description (directly from website) | Price | Size EU | Direct link |
| Skosnuden.dk | Crocs Kids Cayman | Light and soft. Easy to wash and dry off. Available in many colours. A comfortable and cool sandal which forms itself to the child's foot. Unique design with orthopaedic non-slip soles. Made from Croslite™, which is waterproof. |
299 kr. | 21-36 | http://www.skosnuden.dk/ |
| Skosnuden.dk | Crocs Kids Georgie | Soft and insulating effect. Same material as other Crocs and 100% waterproof. Available in many colours. Orthopaedic and non-slip soles. Made from Croslite™, which is waterproof. |
399 kr. | 25-36 | http://www.skosnuden.dk/ |
| Growingfeet.dk | Crocs Athenes | Flip-flop sandal with elastic at heel. | 299 kr. | 23-36 | http://www.growingfeet.dk/ |
| Growingfeet.dk | Crocs Mary Jane | Attractive girl's sandal from Crocs with all the great features of Kids Cayman sandals. A comfortable and cool sandal which forms itself to the child's foot. Unique design with orthopaedic non-slip soles. Made in Croslite™, which is waterproof. |
399 kr. | 23-36 | http://www.growingfeet.dk/ |
| Butiklea.dk | Crocling Crocs | Very shock absorbent. Forms itself to the child's foot Resists bacteria and prevents odour Extremely lightweight. Very shock absorbent. Forms itself to the child's foot Resists bacteria and prevents odour Extremely lightweight. |
399 kr. | 20-36 | http://www.butiklea.dk/ |
| Butiklea.dk | Crocs Kids Mammoth | Great outdoors in cold weather and also as an indoor shoe. | 299 kr. | 25-36 | http://www.butiklea.dk/ |
| Babyshoe.dk | Holy Soles | Machine washable at 40°c Many colours Colourfast – does not mark. Completely safe – made from EVA and air. No PVC! No phthalates. Resistant to odour, liquids and bacteria. |
299 kr. | 23-31 | http://www.babyshoe.dk/ |
| TrendZet | Plastic clogs Machine washable at 40°c | 40 kr. | 27-28 | http://www.trendzet.dk/ |
Table 5.6 Examples of rubber clogs from the survey - shop visits
| Product name | Retailer | Price | Comments |
| No name | Bilka | On offer: 10 kr. | |
| No name | Bilka | On offer: 10 kr. | |
| Iplay | Layette baby articles, Allerød | 50 kr. | |
| No name | Kvickly | 69.95 kr. | With detachable lining |
| Sahara | Deichmann sko | 99 kr. | With detachable lining |
Table 5.7 and Table 5.8 present a range of products from the product group - rubber boots registered during the course of the survey. All products stocked in sizes suitable for 2 year-olds (23-26).
Table 5.7 Examples of rubber clogs from the survey - webshops
| Webshop | Product name | Description | Price | Size EU | Direct link |
| Hallgrensko.dk | Viking Rubber boots | 100% pure rubber | 299 kr. | 24-33 | http://www.hallgrensko.dk/ |
| Frkolga.dk | Molo Rubber boots | Rubber boots with multi-coloured stripes and star reflector at rear. | 199 kr. | 20-37 | http://www.frk-olga.dk/ |
| Heartwear.eu | Viking Fish Mini Rubber boots | Rubber boots with tropical fish design. Made from natural rubber with rubber outer sole. Anatomically formed EVA inner sole and MAX GRIP |
200 kr. | 19-26 | http://www.heartwear.eu/ |
| Sundbaby.dk | Minymo Rubber boots | Rubber boots with turquoise or dark brown arrow design. | 200 kr. | 20-30 | http://sundbaby.dk/ |
| Brandos.dk | Moomin Hanna Rubber boots | Waterproof, unlined rubber boots. Waterproof rubber. Top part of boot in nylon. Inner lined with material. | 249 kr. | 19-24 | http://www.brandos.dk/ |
| Ellos.dk | Kompis rubber boots | Material lined. Rubber sole. Laces in front. Many styles. | 199 kr. | 22-28 | https://www.ellos.dk/ |
| Mille-mi.dk | Celavi rubber boot | Rubber boot in olive green with lime green edging. Made from natural rubber. | 130 kr. | 19-34 | http://www.mille-mi.dk/ |
| Smartkids.dk | ABEKO rubber boots | Black with white edge. | 80 kr. | 20-35 | http://www.smartkidz.dk/ |
| Skosnuden.dk | Bundgaard rubber boot | Laces at top, with striped material lining. Made from natural rubber. | 199 kr. | 23-32 | http://www.skosnuden.dk/ |
| Konceptkids.dk | Celavi Dino rubber boot | Dinosaur print. Light lining and made with 48% natural rubber. 100% waterproof. | 199 kr. | 19-29 | http://www.konceptkids.dk/ |
| Niceliving.dk | T2H rubber boots | 250 kr. | 22-35 | http://www.niceliving.dk/ | |
| Niceliving.dk | Ticket rubber boots | Pink edge above, below and behind. Striped. | 270 kr. | 24-28 | http://www.niceliving.dk/ |
| Prinsesseskabet.dk | Fifi rubber boots | Material lined | 199 kr. | 20-26 | http://prinsesseskabet.dk/ |
| Prinsesseskabet.dk | Kennedy rubber boots | Quality footwear. Good fit. Many styles. | 99 kr. | 19-27 | http://prinsesseskabet.dk/ |
| Tinyzone.dk | Barney Boots | Tape fastening at top of boot to keep water out. Made from natural rubber which lets the skin breathe. With "puddle measurer" the tape can measure how deep a puddle or snow is. | 159 kr. | 22-33 | http://www.tinyzone.dk/ |
Table 5.8 Examples of rubber clogs from the survey - shop visits
| Product name | Retailer | Price in DKK | Comments |
| No name | Bilka | 49.95 kr. | Various colours and patterns |
| No name | H&M | ||
| Adi | Tops Sko | 199,75 kr. | Natural rubber. |
| Viking Play Kids Line | Tops Sko Intersport Magasin |
199,75 kr. | Many different styles |
| The Hunter | Tops Sko | 499,75 kr. | |
| CeLaVi | Tops Sko | 149,75 kr. | |
| Bundgaard | Tops Sko Magasin |
199,50 kr. 200 kr. |
|
| Barney Boots | Tops Sko Magasin |
199,75 kr. and 299,75 kr. 200 kr. |
Many colours and patterns |
| No name | Tops Sko | 299,75 kr. | With ”puddle measurer” and lace at top |
| Miniature | Magasin | ||
| Noa Noa | Magasin | ||
| Molo | Magasin | ||
| Dille | Føtex | 99.95 kr. | |
| Abeka | BabyVest | 129 kr. and 149 kr. | |
| Units | Kvickly | 59.95 kr. | |
| No name | Deichmann | 99 kr. | No name but with a dinosaur on the bottom |
| Marvel, Spider man | Deichmann | 99 kr. | |
| No name | Deichmann | 99 kr. | Very stiff material |
| Elefanten | Deichmann | 199 kr. | |
| No name99 | Deichmann | 99 kr. | Print with "Soccer Sport" |
5.4.5.6 Product prices
The survey registered rubber clogs at prices from 10 kr. per pair (on offer) to 399 kr. per pair.
The survey registered rubber boot prices from 49.95 kr. per pair to 499 kr. per pair.
5.4.5.7 Selected products
Five products were selected within the product group rubber clogs for detailed studies.
Every effort was made to select popular brands from a wide price range.
Five products were selected within the product group rubber boots for detailed studies.
Every effort was made to select popular brands from a wide price range.
5.5 Pacifiers[13]
A pacifier comprises a teat, a coverage and a ring, or knob in various shapes and combinations.

Pacifiers are sold in "sizes"; from 0-3 months, 3-6 months, 6-18 months or 3-36 months.
5.5.1 Legislation
The legislation relevant for pacifiers is the EU directive concerning the release of nitrosamines and nitrosatable substances from teats and pacifiers, and the various limitations on use of certain substances such as heavy metals, nickel etc. These are described further in Chapter 4.
5.5.2 Delimitation
The survey primarily focuses on pacifiers with polycarbonate coverage.
As the survey showed that many pacifiers are produced with a polypropylene coverage, these were also included.
Pacifiers with no information regarding the composition of the coverage were also included.
As a general rule, teat material is always stated (usually latex or silicone).
This survey is only concerned with pacifiers for 2 year-olds.
5.5.3 Description of product type in use
Pacifiers are used as a comfort substitute for a mother's breast and can be used both day and night.
How much pacifiers are used varies with the child, although most 2 year-old children use pacifiers at some time or another.
Children go through many pacifiers and some may have more than one at the same time.
The Pharmacy writes: "Use: As comfort and substitute for breast or bottle from 0 – 3 years. From 3 years, is it recommended that the child be weaned off the pacifier so as not to hinder the development of teeth".
2 year-olds are directly exposed to the substances in the pacifier when they suck on it. Many children go round for long periods holding their pacifier, so it is not only the teat which comes into contact with the child.
5.5.4 Survey of the range of pacifiers
5.5.4.1 Procedure
An enquiry was made to The Danish Chamber of Commerce for contacts with trade associations.
Coop, Dansk Supermarked and Matas were contacted to ask which brands and trade names they stocked, which were the best sellers and how large a proportion of total sales in Denmark they accounted for.
A number of retail chains specialising in baby articles were also contacted, including BabySam, Ønske Børn and BabyVest.
Several retail outlets were visited. These include the following:
- Føtex
- Bilka
- Kvickly
- Matas
- H&M
- Pharmacies
- LIC (Lærernes indkøbscentral – a purchasing cooperative for teachers)
- BabySam
- BabyVest
- Irma
- Magasin
In addition, catalogues, advertisements etc, were also surveyed.
Google was used for the survey, using various search words and combinations of these. This was done to find general details of the range of pacifiers on the market and to identify a number of webshops selling them.
A number of specific websites were also searched for.
5.5.5 Results of survey
5.5.5.1 Products
In more or less all the pacifiers in the survey, information was available on the composition of the teat. This was however not always the case with the coverage and the ring, and even less so if the pacifier had a knob.
As a general rule, teat material is always stated (usually latex or silicone).
Where information on the composition of the coverage or ring was available, it was usually either polycarbonate or polypropylene. There were also pacifiers in which the coverage was of polypropylene and the knob of polycarbonate.
Polypropylene is a cheaper plastic material than polycarbonate.
As polycarbonate is an amorphous thermoplastic, it can be produced in a transparent version, whereas polypropylene can not. Polycarbonate is also stronger.
Polycarbonate can contain residues of catalysts and solvents from the polymerisation process. These can be triethylamine and tributylamine which are catalyst residues, as well as dichloromethane and monochlorobenzene, which are solvents.
Polypropylene can contain residues of catalysts such as oxides of zirconium, vanadium and chromium.
Silicone rubber, which is peroxide vulcanised, can contain residues of peroxides and their by-products. Platinum vulcanised silicone rubber is regarded as being very clean and free from harmful substances. This is why platinum-catalysed types are often used in medical utensils, food production and pharmaceutical products.
Latex and natural rubber can contain residues of sulphur vulcanisation agents and their by-products, such as dithiocarbonates, dibutyl amine and other aliphatic amines and nitrosamines.
The products are available as neutral pacifiers in white, pale blue or pale pink and with designs (soft toys, skulls, crossbones, and teeth), name, photo, free text or company logo.
5.5.5.2 Results of surveying via trade associations and large retail chains
The Danish Chamber of Commerce
The Danish Chamber of Commerce did not consider itself able to contribute information to the survey. The organisation says that companies cannot be expected to furnish information on which products sell best, as this could mean that these products would almost certainly be selected for analysis and possibly "exposed". The Danish Chamber of Commerce therefore suggested that contact be made directly with the larger baby retailers.
Coop
Coop has stated that they stock Bibs, Nuk, MAM, Tommee Tippee.
Matas
No available information
Dansk Supermarked
Dansk Supermarked have stated they do not have a common buying policy and enquiries should be addressed to the individual subsidiary chains, e.g. Føtex, Bilka, Netto, Tøj & Sko, Salling and A-Z.
5.5.5.3 Result of surveying via websites
A number of relevant websites were visited and 17 relevant online webshops were found using Google.
Five different search criteria have been used:
- "Pacifiers" - returned approx. 2,250 results
- "Pacifiers - 36 months" - returned approx. 400 results
- "Polycarbonate pacifiers" - returned approx. 250 results
- "Polycarbonate pacifiers" - returned approx. 650 results
- "Polypropylene pacifiers" - returned just under 40 results.
Over 200 websites were surveyed. The survey was performed through the search engine's short results or by visiting individual sites.
The www.bambino-mam.se/dk website states the following: "Pacifiers with a silicon teat are becoming more and more popular. But there are still those who think that silicon feels hard and smooth. After many years research, MAM is therefore launching a new silicon surface which completely replaces the old one. Silk Teat TM is as soft and supple as a mother's skin".
5.5.5.4 Results of shop visits
There is a strong convergence of brands seen in the shops visited, although Matas markets its own brand, as do pharmacies.
The Avent brand was stocked by many of the shops visited. In both BabyVest and BabySam they stated that it was the best-selling brand. However, this brand has not been included further in the project because it is aimed at ages up to 18 months and therefore falls outside the project target group.
5.5.5.5 Product list
Table 5.9 and
Table 5.10 present a range of products registered in the course of the survey.
Table 5.9 Examples of pacifiers from the survey - webshops:
Table 5.10 Examples of pacifiers from survey - shop visits
| Product name. | Retailer | Price in DKK | Comments |
| Apotekets Narresut | Pharmacies | 45.95 for pack with two items. | Teat:: Natural rubber Coverage: Polycarbonate. Stated on pack: Meets EU standard EN 1400. Pacifiers made of natural rubber can provoke allergic reactions. |
| Avent | BabySam BabyVest | Teat: Natural rubber. Coverage and ring: Polycarbonate. Only sold for ages up to 18 months. |
|
| Bambino | Bilka Føtex |
19.45 for 2 pack | Teat: Silicon. |
| Bambino – MAM | Bilka Føtex Kvickly Irma SuperBest |
49.95 for 2 pack | 3 versions with teats in latex, silicon and silicon silk teat (ultra soft silicon). Several models, e.g. MAM Maxi air, MAM Classic, UltiMam. |
| Babycare | Bilka Føtex |
19.95 for 2 pack | Teat:: Latex. Coverage: Polypropylene. |
| Bamse-sut | Bilka SuperBest |
16.95 for 3 pack | Teat:: Latex. Coverage: Polypropylene. |
| Baby Nova | Bilka Føtex LIC Pharmacies |
27.95 for 2 pack 27.95 for a "Skånesut" 48.95 at LIC |
"Skånesut" only at LIC |
| Nuk | Bilka Kvickly SuperBest |
50 for 2 pack | Teat:: Latex. |
| Tommee Tippee | Bilka | Teat: Latex. Many models. |
|
| Bibs | Kvickly SuperBest | Several versions, all with latex teats, but with polycarbonate and polypropylene coverages. There is also a luminous model (polypropylene coverage.). | |
| Matas Baby | Matas | 19,95-35 30-35 for 2 pack |
Teat: Latex. Coverage: Polypropylene. Several models. |
| Matas Baby | Matas | 19.95-35 30-35 for 2 pack |
Teat: Latex. Coverage: Polypropylene. Several models. |
5.5.5.6 Product prices
There is a relatively large price range for pacifiers. Primarily, there are two factors which seem to influence price: the decoration on the coverage (if a photo, name or other personalisation appears, the price is higher than neutral pacifiers) and the number of pacifiers contained in the pack (the more there are, the lower the price per item.)
5.5.5.7 Selected products
As none of the substances selected (i.e. potential endocrine disrupters or allergens) were expected to be found in polypropylene products, focus was placed solely on products with polycarbonate coverages.
Five products were selected from the pacifier product group for detailed studies.
5.6 PVC bath soap packaging
2-year-old children can be exposed to chemicals in the bath from soap and toys. Such exposure is diluted by the bath water. Soap is regulated by the statutory order on cosmetics, and bath toys by the statutory order on toys. The new rules on phthalates (REACH, annex XVII, entry 51 and 52 and BEK 855, 2009) also covers toys. But the packaging of soap for children (body shampoo or bath foam) can be shaped as figures - such as a car, Mickey Mouse or Cinderella - and therefore they do not necessarily fall under the definition of a toy, even though they are ideal for use as a toy in the bath - and maybe even for small children to suck on.
A previous survey by the Danish Environmental Protection Agency "Survey of chemical substances in cosmetic products for children" showed that many of these packagings were made of PVC and had a high content of phthalates (Poulsen and Schmidt, 2007). This represents a grey zone, as it concerns cosmetic products shaped in such a way that in many cases they are perceived as toys.
The Danish Safety Technology Authority (DSTA) decides whether such products are toys, and some of them were categorised by the DSTA in the previous project for the Danish Environmental Protection Agency. The figures in question were exclusively 3-dimensional, e.g. a Winnie the Pooh figure with an umbrella, with a head which formed the cap of the bottle.
5.6.1 Legislation
As mentioned, there is a grey zone for this type of product in some instances. If the DSTA categorises the products as toys, the statutory order on toys as well as legislation concerning phthalates in toys, apply. Otherwise, the various limitations on the use of different substances such as PFOS and their derivates, heavy metals, cosmetics, etc. apply. See chapter 4 for further details.
5.6.2 Delimitation
This product group is limited to bath soap packaging made of PVC (or of soft plastic with a view to establishing whether they contain PVC), as it is the phthalate content which is relevant with regard to the exposure of 2-year-olds.
Consequently, only children's body shampoo/soap/foam bath products in soft plastic packaging shaped as different figures or animals, or ordinary children's body shampoo for which the packaging code indicates that the packaging is made of PVC (triangle with the number 3 = code for PVC), or moulded figure packaging which was not categorised as toys in DEPA's earlier project: "Identifying chemical substances in cosmetic products for children" were surveyed.
5.6.3 Description of product type in use
Many children - including 2-year-olds - love to bathe and play in the bath. That's why children often spend a long time in the bath, perhaps 10-30 minutes. How often parents bathe their children can vary. Two-year-olds do not need to be bathed every day. The “Bogen om Barnet” published by Politikens Forlag states that children between the ages of 3-6 do not need to bathe every day (Manniche, 2005). A survey by the Danish Asthma and Allergy Association, which focused exclusively on children with eczema, showed that 11% of parents bathe their children every day and approx. 70% bathe them twice a week (Danish Asthma and Allergy Association, 2007).
Two-year-olds can therefore be exposed to phthalate content in bath soap packaging for up to two hours per week, either by sucking on or touching the products directly, or by indirect transfer via the bath water, if playing with the products in the bath.
5.6.4 Identifying the range of bath soap packaging
5.6.4.1 Procedure
The survey of bath soap packaging primarily used the findings of the aforementioned survey of cosmetic products for children as its starting point, in which bath soaps, body shampoo, foam bath products and the like (all for children) were identified (Poulsen og Schmidt, 2007).
The earlier project built a database of over 200 cosmetic products for children (including body shampoo/bath gels and foam bath products). An extract from this database shows that the bath soap products bearing a triangular symbol with the figure 3 in them, which indicates the packaging is made of PVC, were all shaped as a certain figure (see Table 5.11).
Table 5.11 List of packaging made of PVC (Poulsen and Schmidt, 2007). Extract from database of cosmetic products for children from an earlier DEPA survey project.
| Product name | Product type | Manufacturer/Importer | Package description |
| Barbie Bubble Bath | Foam bath | Adimex | Moulded as a mobile phone with a small bag |
| Barbie Magic Pegasus Bath and Shower Foam | Foam bath | Beauty and Care, Germany | Barbie figure with purple dress |
| Barbie, Erika, Dusch- und badeschaum | Foam bath | Beauty & Care AG | Dark-haired Barbie doll with pink and blue dress |
| Disney Bath & Shower Gel and Sponge | Body shampoo/bath gel | Adimex, Belgium Dist.: Hillpart, Espania |
Winnie the Pooh with honey jar |
| Disney Bath & Shower Gel, Mini mouse | Body shampoo/bath gel | Adimex N.V./S.A. Dist. Hillpart S.A. España |
Mini Mouse figure |
| Disney Princess Bath & Shower Gel, Askepot | Body shampoo/bath gel | Adimex N.V./S.A. Hillpart S.A. |
Cinderella figure |
| Disney, Bath and Shower Gel, Mickey Mouse | Body shampoo/bath gel | Adimex N.V./S.A. | Mickey Mouse figure |
During the same project, a large number of bath soap figures were bought in shapes such as a zebra or an ice cream cone. Six of these were analysed for phthalate content and all contained minimum 26% DEHP or 26% DINP (both are phthalates and are covered by a ban in toys - see section 4.1.2). It was therefore investigated where these figures were bought in the earlier project. The retailers concerned were thus visited again with regard to establishing whether it was still possible to find PVC bath soap packaging in the shops (autumn 2008).
Foam bath products and bath soap packaging figures were only found via a few websites in the earlier project (Poulsen and Schmidt, 2007). The same sites were therefore visited again and the Google search engine was searched using various search words and combinations of the same. This was done to find a number of webshops selling foam bath figures.
5.6.5 Results of the survey
5.6.5.1 Products
Ordinary children's bath soap packaging, e.g. cubic/oval with text, are typically manufactured from pure polyethylene (packaging code 2), polyethylene and polypropylene, or another type of plastic – although not PVC (packaging code 3). This was confirmed by checking the packaging codes on the bottom of various children's soap packaging types in a wide range of shops, e.g. Bilka, Matas, Netto, pharmacies, Fakta, Kvickly and Irma.
Children's body shampoo/foam bath products shaped as a certain figure, such as Winnie the Pooh or Barbie, were found with packaging code 3, i.e. they are made of PVC. Only Disney and Barbie figures were found with PVC packaging in the survey.
5.6.5.2 Result of surveying large retail chains
Coop
The retail store Coop has stated that they have previously bought bubble bath or similar products, occasionally with bottles shaped as a figure, animal or similar. Such products are rarely purchased, since the contents have proven to be problematic with regard to perfumes and preservatives.
Matas
Matas stated that the packaging of their own brand of children's bath product is not made of PVC.
5.6.5.3 Result of surveying via the web
Foam bath products and bath soap packaging figures were only found via a few websites in the earlier project (Poulsen and Schmidt, 2007). These sites were visited once more to see if they still sold foam bath product figures. The survey showed that none of the sites in question sold such products any longer.
A general search was also performed on Google for foam bath product figures, which yielded very modest results. Two different Danish websites sell the same foam bath product figures in soft plastic. No larger bath soap packaging shaped as different figures were found on the web. The web-based market for such figures seems to be smaller than it was in 2006, when the survey on cosmetic products for children was performed (Poulsen and Schmidt, 2007).
5.6.5.4 Result of surveying via shops
A number of physical outlets were visited, such as general stores and perfumeries. Children's body shampoo/foam bath products shaped as certain figures and soft plastic foam bath products figures were primarily found in perfumeries and specialist retailers.
5.6.5.5 Product list
Table 5.12 lists the outlets where PVC bath soap packaging (most probably) is found.
Table 5.12 Examples of PVC bath soap packaging (most probably) from the survey - webshops
| Product name | Description | Item price | Packaging | Direct link |
| Hjerte rød | Soft plastic | http://alfredogco.dk/?traeid=494 | ||
| Sommerfugl | Soft plastic | http://alfredogco.dk/?traeid=494 | ||
| And | Soft plastic | http://alfredogco.dk/?traeid=494 | ||
| Fisk | Soft plastic | http://alfredogco.dk/?traeid=494 | ||
| Thomas tog | Soft plastic | http://alfredogco.dk/?traeid=494 | ||
| Care Bear | Soft plastic | http://alfredogco.dk/?traeid=494 | ||
| Skildpadde | Soft plastic | http://alfredogco.dk/?traeid=494 | ||
| Delfin | Soft plastic | http://alfredogco.dk/?traeid=494 | ||
| Elefant | In blue and pink | Soft plastic | http://alfredogco.dk/?traeid=494 | |
| Hjerte rød | 10 kr. | Soft plastic | http://durance.dk/?traeid=494 | |
| Sommerfugl | 15 kr. | Soft plastic | http://durance.dk/?traeid=494 | |
| And | 15 kr. | Soft plastic | http://durance.dk/?traeid=494 | |
| Fisk | 15 kr. | Soft plastic | http://durance.dk/?traeid=494 | |
| Thomas tog | 15 kr. | Soft plastic | http://durance.dk/?traeid=494 | |
| Care Bear | 19 kr. | Soft plastic | http://durance.dk/?traeid=494 | |
| Skildpadde | 19 kr. | Soft plastic | http://durance.dk/?traeid=494 | |
| Delfin | 19 kr. | Soft plastic | http://durance.dk/?traeid=494 | |
| Elefant | In blue and pink | 10 kr. | Soft plastic | http://durance.dk/?traeid=494 |
Table 5.13 Examples of PVC bath soap packaging (most probably) from the survey - shop visits
| Product name | Description | Item price | Packaging | Comments |
| Gris | 5.5 kr. | Soft plastic | ||
| Sommerfugl | 5.5 kr. | Soft plastic | ||
| Mariehøns | 5.5 kr. | Soft plastic | ||
| Dødningehovede | 5.5 kr. | Soft plastic | ||
| Søhest | Blue and green | 5.5 kr. | Soft plastic | |
| Guldfisk | 5.5 kr. | Soft plastic | ||
| Peter Plys | Winnie the Pooh with clock | 70 kr. | Harder plastic | Made of PVC according to package marking |
| Æsel | 70 kr. | Harder plastic | Made of PVC according to package marking | |
| Barbie | 70 kr. | Harder plastic | Made of PVC according to package marking | |
| Tornerose? | Princess in yellow dress | 70 kr. | Harder plastic | Made of PVC according to package marking |
| Minnie Mouse | 70 kr. | Harder plastic | Made of PVC according to package marking | |
| Mickey Mouse | 70 kr. | Harder plastic | Made of PVC according to package marking | |
| Mus | Some kind of mouse sitting in something? | 70 kr. | Harder plastic | Made of PVC according to package marking |
| Spiderman | Spiderman sitting on a building | 70 kr. | Harder plastic | No packaging marking |
| Hello Kitty | Boys and girls versions | 70 kr. | Harder plastic | No packaging marking |
5.6.5.6 Product prices
It was found that the range of different children's soap packaging made of PVC was small. The price of the small foam bath products figures in soft plastic varies between 5.50 kr. and 19 kr. The larger packs of harder plastic were exclusively found in one shop during the survey, at 70 kr. each.
5.6.5.7 Selected products
Five products were selected from the bath soap packaging product group for detailed studies.
5.7 Non-slip figures and bath mats
2-year-old children can be exposed to chemicals in the bath from soap and toys. Exposure to soap is diluted by the bath water. Bath toys are regulated by the statutory order on toys and, under the new rules on phthalates, which cover a ban on content of certain phthalates (REACH, annex XVII, entry 51 and 52 and BEK 855, 2009). But non-slip mats are not toys or baby articles and are not therefore covered by these statutory orders. Non-slip bath items can be perceived as toys due to their appearance, but it will be up to the DSTA to decide whether they are toys or not. It can, however, be expected that children will perceive them as toys, regardless of whether they are categorised as such. Ordinary non-slip bath mats cannot be expected to be used as toys.
5.7.1 Legislation
Legislation that applies to non-slip figures and bath mats imposes differing limitations on use of various substances such as PFOS and their derivates, heavy metals, nickel, etc.. See chapter 4 for further details.
5.7.2 Delimitation
Only figures and mats in soft plastic or rubber have been included in the survey. Hard plastic tiles - which for example can be clicked together to cover an entire bathroom floor - have not been included.
The survey has primarily focused on figures and mats of such a size that they can fit in a bath tub or bowl, which can be placed in a shower cabin or niche. It was presumed that 2-year-olds are rarely washed while standing up or showered in a shower cabin - most prefer to sit down and play in the water.
5.7.3 Description of product types in use
Many children - including 2-year-olds - love to bathe and play in the bath. That's why children often spend a long time in the bath, perhaps 10-30 minutes. How often parents bathe their children can vary and 2-year-olds do not need to be bathed every day. The “Bogen om Barnet” published by Politikens Forlag states that children between the ages of 3-6 do not need to bathe every day (Manniche, 2005). A survey by the Danish Asthma and Allergy Association, which focused exclusively on children with eczema, showed that 11% of parents bathe their children every day and approx. 70% bathe them twice a week (Danish Asthma and Allergy Association, 2007).
Two-year-olds can therefore be exposed to chemicals from non-slip figures and mats for up to two hours per week. Such figures for the bath can be shaped in a range of figures and perceived as toys. Apart from children sitting on them, 2-year-olds will also play with them (hence holding them in their hands above the water) and maybe even suck on them. Ordinary non-slip bath mats are not intended to be used as toys, but there is skin contact, as children sit on them in the bath.
5.7.4 Survey of the range of non-slip figures and mats for bath tubs
5.7.4.1 Procedure
An enquiry was made to The Danish Chamber of Commerce for contacts within trade associations.
Coop, Dansk Supermarked, Jysk and Matas were contacted to ask which brands and trade names they carried, which were the best sellers and how large a proportion of total sales in Denmark they accounted for.
A number of retail chains specialising in baby articles were also contacted, including BabySam, Ønske Børn and BabyVest.
Several retail outlets were visited, including the following:
- Føtex
- Bilka
- Kvickly
- Jysk
- Matas
- Ikea
- Ilva
- Idé møbler
- LIC
- BabySam
- BabyVest
- Magasin
- Salling
- Silvan
- Bauhaus
- Jem & fix
- XL-byg
- Stark
- Harald Nyborg
- Brødrene Kier AS in Århus
- Frede Andersen vvs in Århus
- Imerco
- Kop og Kande
- Inspiration
- Sinnerup
- Trøjborg Isenkram in Århus
- Borgportens Isenkram in Århus
- Alstrøm Isenkram in Valby (via telephone).
In addition, catalogues, advertisements, etc. were also surveyed.
The Google search engine was searched using various search words and combinations of the same. This was done to obtain general details on non-slip figures and mats for bath tubs on the market and to find a number of shops stocking them.
A number of specific websites were also searched.
5.7.5 Results of survey
5.7.5.1 Products
In some instances, details of the materials used in the products were registered in the survey. The materials concerned are 100% rubber, 100% synthetic rubber, 100% PVC and PVC-free.
An antimicrobial agent is expected to have been added to mats made of softened PVC, such as an organotin compound, in order to prevent bacteria and mould.
5.7.5.2 Results of surveying via trade associations and large retail chains
The Danish Chamber of Commerce
The Danish Chamber of Commerce did not consider itself able to provide any details stating that companies cannot be expected to inform which products they sell most of, as doing so will ensure that their products are selected for analysis and thus place them in the public spotlight. The Danish Chamber of Commerce suggested direct contact to the major baby article chains, which was subsequently taken up.
Coop
Coop has stated that they stock non-slip mats with the Bibs brand name.
Matas
Matas has stated that they do not stock non-slip figures and/or mats.
Jysk
Jysk has stated that they can regrettably not take part in the survey. The reason given is the very tight deadlines of the project.
BabySam, Ønske Børn and BabyVest
No replies were received to our request.
5.7.5.3 Result of surveying via websites
5 relevant online webshops were found using the Google search machine and the websites of presumed retailers.
The first 3, BABYHOME, Lavprisvvs.dk and dreamchild.dk (see Table 5.14) were found by entering the search criteria "Non-slip mat bath tub", which returned 1,340 results and "mat bath tub", which returned 68,500 results. It can be presumed that this product group has a very low profile on Danish webshops or is only stocked by a few retailers.
5.7.5.4 Results of shop visits
A very limited selection of the product group of non-slip figures and mats was registered in the shops visited.
Non-slip figures and mats were only registered in three of the shops visited (Jysk, Silvan and Kvickly).
Two (possibly three - may be the same material in two different sizes) different non-slip mats were stocked by Jysk. Silvan stocked three different mats, Kvickly and BabySam each stocked two different mats.
In other shops visited where non-slip mats were registered, only one type was stocked.
5.7.5.5 Product list
Table 5.14 and Table 5.15 present a range of products registered in the survey.
Table 5.14 Examples of non-slip figures and mats from survey - webshops
| webshop | Product name | Quant. per pack | Price per pack | Details from website |
Direct link |
| BABYHOME | HomeMaker Rubber Suction Bath Mat | 1 | 59 kr. | 40 x 23 cm White |
http://babyhome.dk/ |
| Lavprisvvs.dk | Stella marina | 1 | 139 kr. | 36.5 x 75 cm Washable at 40° C White with blue starfish |
http://www.lavprisvvs.dk/ |
| Dreamchild.dk | Baby Dan | 1 | 59.95 kr. | 35 x 55 cm 100% rubber |
http://www.dreamchild.dk/ |
| BabySam | Safety Ist. Anti-slip patterns | - | 49.95 kr. | http://babysam.dk/ | |
| Jysk | Safety mat | 1 | 49.95 kr. | 54 x 54 cm | http://www.jysk.dk/ |
| Jysk | Non-slip figures | 4 | 29.95 kr. | 10 x 12 cm Rubber |
http://www.jysk.dk/ |
Table 5.15 Examples of non-slip figures and mats from survey - shop visits
| Product name | Retailer | Price | Comments |
| Baby Dan | BabySam BabyVest |
69.95 kr. 49.95 kr. |
Mat |
| LuckyBaby | BabySam | 69.95 kr. | Mat |
| Patrull | Ikea | 49.95 kr. (29.95 kr. in Ikea Family club) | Mat |
| BathRoom | Jysk | 29.95 kr. | Figures, 100% rubber |
| Anti-Slip Mat | Jysk | 29.95 kr. | Mat, PVC |
| Babycare | Bilka | 45.95 kr. | Mat, rubber |
| No name | Jysk | 49.95 kr. | Mat |
| Dalobad | Kvickly | 25 kr. | Figures |
| Dalobad | Kvickly | Mat | |
| Bibs | Kvickly | 48.95 kr. | Mat |
| Alba | Salling | 99.95 kr. | Mat, 100% PVC |
| Slip-not, Ridder | Silvan | 59.95 kr. and 64.95 kr. | Figures, PVC-free |
| Plattfuss, Ridder | Silvan | 89.95 kr. | Mat, PVC-free |
| Lense, Ridder | Silvan | 179.95 kr. | Mat |
| Aquamod Sanitized | Silvan | 79.95 kr. | Mat, PVC-free |
| Sealskin | Bauhaus | 99.95 kr. and 129 kr. | Mat, PVC |
| Osmos Duschmatta | Stark | 59 kr. and 99.95 kr. | Mat, natural rubber. |
| Duschy | Alstrøm Isenkram, Valby | 89.95 kr. | Mat |
5.7.5.6 Product prices
Non-slip figures and mats were registered at prices ranging from 29.95 kr. to 179.95 kr. during the survey.
5.7.5.7 Selected products
Five products were selected from the non-slip figure and mat product group for detailed studies.
Every effort was made to select non-slip products in the form of figures and mats. Similarly, every effort has been made to select products made of PVC, and products sold as being PVC-free.
5.8 Soft toys
Soft toys come in many sizes - from very small to those a 2-year-old can ride on. They can be in the shape of a wide range of animals and fantasy animals including models that make a sound, can change colour, emit a scent, change into balls, etc.
5.8.1 Legislation
The following legislation applies to soft toys: The statutory order on soft toys, the statutory order on phthalates, and various regulations on the use of substances such as brominated flame retardants, impregnation substances, PFOS and its derivatives, heavy metals, nickel, etc. These are described further in sections 4.1 Toys and 4.2. Textiles.
5.8.2 Delimitation
Soft toys cover a very wide product area and are therefore very resource-intensive to survey. During the survey it became apparent that scented soft toys do not represent a large area, hence soft toys were surveyed in general. Due to the enormous range, it was decided to register all the soft toys that were encountered during shop visits and searching the Internet.
5.8.3 Description of product type in use
Soft toys are typically used extensively by infants. Some children play with them, others sleep with them, and there are those who are so closely attached to them that they are carried around most of the time. Most 2-year-olds must however be presumed to have one or more soft toys which they will cuddle or suck on during the night. As such, exposure occurs when the child is holding the soft toy, and at possible release of various chemical substances.
5.8.4 Survey of the range of soft toys
5.8.4.1 Procedure
An enquiry was made to The Danish Chamber of Commerce for contacts with trade associations.
Coop, Dansk Supermarked, Jysk and Matas were contacted to ask which brands and trade names they carried, which were the best sellers and how large a proportion of total sales in Denmark they accounted for.
A number of retail chains specialising in baby articles were also contacted, including BabySam, Ønske Børn and BabyVest.
Trade association 'Legetøjsfabrikanter i Norden' (Nordic toy manufacturer's association) was contacted and promised to forward our request to Top Toy, KE Mathiesen, Mattel and others.
In addition, catalogues, advertisements, etc. were also surveyed.
The Google search engine was searched using various search words and combinations of the same. This was done to find general details of soft toys on the market and to identify a number of webshops selling soft toys.
A number of specific websites were also searched.
Several retail outlets were visited. These include the following:
- Føtex
- Bilka
- Kvickly
- Jysk
- Ikea
- H&M
- LIC (Lærernes indkøbscentral – a purchasing cooperative for teachers)
- Toys’R’Us
- BR
- BabySam
- BabyVest
- Magasin
5.8.5 Results of the survey
5.8.5.1 Results of surveying via trade associations and large retail chains
The Danish Chamber of Commerce
The Danish Chamber of Commerce did not consider itself able to provide any details stating that companies cannot be expected to inform which products they sell most of, as doing so will ensure that their products are selected for analysis and thus place them in the public spotlight. The Danish Chamber of Commerce suggested direct contact to the major baby article chains, which was subsequently taken up.
Legetøjsfabrikanter i Norden and others.
No replies were received to our request.
Coop
No replies were received to our request.
Føtex
No replies were received to our request.
BabySam, Ønske Børn and BabyVest
No replies were received to our request.
5.8.5.2 Result of surveying via websites
Scented soft toys were found at the following webshops:
- http://www.netgiraffen.dk/produkter/Baby%200-2%20%C3%A5r/Dukker%20og%20Bamser%20(baby)/
- http://www.tingtiltumlinger.dk/ShopItems.aspx?n=1&mcat=6&scat=69
- http://www.4-all.dk/group.asp?group=126&sub=126
- http://mariehonen.dk/product.asp?product=1769&sub=0&page=1
- http://ordre.money4you.dk/bamseslottet_39_da/
- http://ordre.money4you.dk/bamseslottet/beddy_bear_81_da.html
- http://bluz.fdf.dk/cms_artikel.php?id=965
- http://24.dk/user/lizz81/perma/2007/02/19/Hot_Teddy.
5.8.5.3 Results of shop visits
Shop visits have shown that scented soft toys - for heating up in a microwave oven - are currently primarily sold through webshops. Neither Magasin, BabySam, BR Legetøj nor Build a Bear sell scented soft toys, or soft toys for heating in microwave ovens.
As such, the product group covers soft toys in general.
At inquiry in the shop, the shop personnel stated that they did not know the age groups to which individual soft toys were sold. They explained that they did not know because customers do not tend to ask for help or advice when choosing a soft toy.
5.8.5.4 Product list
Table 5.16 presents soft toys for heating in microwave ovens registered during the survey via shop visits.
Table 5.16 Examples of soft toys for heating from the survey - shop visits
| Product name | Retailer | Price | Comments |
| Intelex | Segers Baby house, Fields | approx. 200 kr. | |
| Bedtime, heat and hug me | Krea, Fields | Approx. 40 kr. |
Table 5.17 shows soft toys registered during the survey via shop visits.
Table 5.17 Examples of soft toys from the survey - shop visits
| Product name | Retailer, dealer | Price | Comments |
| Teddy & Ko | teddykompagniet.dk | Approx. 80 kr. plus | |
| Kiddy | VN legetøj | Approx. 80 kr. plus | |
| Disney | KE Mathiesen (sold in BR and others) | Approx. 80 kr. plus | |
| Bamse, Kylling, Ælling, Kaj, Andrea, Far til Fire, Pilfinger (Sigurds Bjørnetime) | Krea | approx. 100-200 kr. | |
| Mumitrolde, Martinex | Seen in Krea | 99.95 kr.-169.95 kr. | |
| Rubens Barn | Seen in Krea | 249.95 kr.-399.95 kr. | |
| Die Spiegelburg | Seen in Krea | ||
| Anna Club Plush | Seen in Krea | approx. 199-449 kr. | E.g. cow, horse, dog |
| WWF – Plush Collection Junior | Seen in Krea | From approx. 100 kr. plus | |
| Beatrix Potter og Russ | Victoria’s, Lyngby | Approx. 150 kr. plus | |
| Noukie’s og Ruffy & Co | Victoria’s, Lyngby | Approx. 150 kr. plus | |
| Babico Toys | |||
| Build a Bear | Build a Bear | approx. 100-500 kr. | Price class depends on type of soft toy and clothes selected |
| Wacky Bear Factory | Q-Big | approx. 100-500 kr. | Price class depends on type of soft toy and clothes selected |
| TopToy | Toys’R’Us | approx. 50-400 kr. | Wide range of soft toys of all sizes |
As such, a wide range of soft toy brands have been registered, but there are many more.
5.8.5.5 Selected products
Five products were selected from the soft toy product group for detailed studies.
Every effort was made to select soft toys from brand stockists, retail chains and from supermarkets. Similarly, every effort was made to select soft toys which can be heated in a microwave oven, as these will probably release the highest levels of chemical substances.
5.9 Diapers
Diapers are worn for many hours at a time, because many 2-year-olds wear them both day and night. When diapers are worn there is skin contact with the inside and the edges of the diaper. If the child touches the diaper, then there will also be contact with the exterior surface.
5.9.1 Legislation
Legislation relevant to diapers imposes different limitations on use of different substances such as PFOS and their derivates, heavy metals, nickel, etc. See chapter 4 for further details.
5.9.2 Delimitation
The survey concentrated exclusively on paper diapers - i.e. textile diapers were not included.
Diaper sizes approx. 11-16 kg were surveyed, depending on diaper type, and the survey covered standard diapers, those with Velcro fastenings and "Up & Go" diapers.
5.9.3 Description of the product group in use
Most 2-year-olds wear diapers around the clock and are thus exposed to any chemical substances they contain for 24 hours a day. However, exposure is primarily from that part of the diaper in direct contact with the skin. Two-year-old children will typically use between 3-5 diapers per day.
5.9.4 Survey of the range of diapers
5.9.4.1 Procedure
An enquiry was made to The Danish Chamber of Commerce for contacts with trade associations.
Coop, Dansk Supermarked, Jysk and Matas were contacted to ask which brands and trade names they carried, which were the best sellers and how large a proportion of total sales in Denmark they accounted for.
A number of retail chains specialising in baby articles were also contacted, including BabySam, Ønske Børn and BabyVest.
Several retail outlets were visited. These include the following:
- Føtex
- Bilka
- Kvickly
- Super Brugsen
- LIC (Lærernes indkøbscentral – a purchasing cooperative for teachers)
- BabySam
- BabyVest
- Fakta
- Aldi
- SuperBest
- Irma.
In addition, catalogues, advertisements etc. were also surveyed.
The Google search engine was searched using various search words and combinations of the same. This was done to find general details of soft toys on the market and to identify a number of webshops selling diapers.
A number of specific websites were also searched.
5.9.5 Results of the survey
5.9.5.1 Products
Paper diapers consist of different plastic materials (e.g. polypropylene, absorbent polyacrylate, thermoplastic elastomers and polyethylene). The innermost absorbent core is however manufactured from cellulose fibre.
5.9.5.2 Results of surveying via trade associations and large retail chains
The Danish Chamber of Commerce
The Danish Chamber of Commerce did not consider itself able to provide any details, stating that companies cannot be expected to inform which products they sell most of, as doing so will ensure that their products are selected for analysis and thus place them in the public spotlight. The Danish Chamber of Commerce suggested direct contact to the major baby article chains, which was subsequently taken up.
Coop
Coop has stated that they stock Coop, Libero, Huggie and Moltex paper diapers.
Matas
No replies were received to our request.
5.9.5.3 Result of surveying via websites
Six relevant online webshops were found using the Google search machine and the websites of presumed vendors.
"Diapers" - returned approx. 239,000 results. The first 11 pages presented were surveyed for dealers. Each page contains 10 search results – i.e. 110 results in total. The survey was performed through the search engine's short results or by visiting individual sites.
5.9.5.4 Results of shop visits
Diapers are often sold on special offer. Most of the shops visited stated that Pampers and Libero are the two big brands, but that consumers generally buy diapers on special offer.
5.9.5.5 Product list
Table 5.18 and Table 5.19 present a range of products stocked in sizes suitable for 2-year-olds.
Table 5.18 Examples of paper diapers from the survey - webshops
| webshop | Product name | Weight category14 in kg |
Item price | Quant. per pack | Price per pack |
Direct link |
| Svanebutikken.dk | Bambo Nature (Swan mark) | 8-18 (maxi) | 2.50 kr. | 50 | 124,95 | http://www.svanebutikken.dk/ |
| 12-22 (maxi plus) | 2.72 kr. | 46 | 124,95 | http://www.svanebutikken.dk/ | ||
| 15-25 (junior) | 2.98 kr. | 42 | 124,95 | http://www.svanebutikken.dk/ | ||
| Torvet A/S | Unique | 11-25 (junior) | 1.79 kr. | 162 | 289,95 | http://www.torvet.dk/ |
| Moltex Öko (organic) |
11-25 (junior) | 3.60 kr. | 108 | 389 | http://www.torvet.dk/ | |
| helsehelse.dk | Moltex Öko (organic) |
7-18 (maxi) | 3.07 kr. | 42 | 129 | http://www.lamai.dk/ |
| 11-25 (junior) | 3.58 kr. | 36 | 129 | http://www.lamai.dk/ | ||
| 16-30 (XL) | 4.30 kr. | 30 | 129 | http://www.lamai.dk/ | ||
| PUSLERIET | Libero Comfort Fit |
7-14 (maxi) | 2 kr. | 60 | 120 | http://www.pusleriet.dk/ |
| 10-16 (maxi plus) | 2.14 kr. | 56 | 120 | http://www.pusleriet.dk/ | ||
| Libero Up&Go | 10-14 (maxi plus) | 2.86 kr. | 42 | 120 | http://www.pusleriet.dk/ | |
| Bambo Nature | 8-18 (maxi) | 2.50 kr. | 50 | 125 | http://www.pusleriet.dk/shop/ | |
| 12-22 (maxi plus) | 2.72 kr. | 46 | 125 | http://www.pusleriet.dk/shop/ | ||
| YELLOWMAN ApS | Moltex Öko | 7-18 (maxi) | 2.38 kr. | 42 | 99,95 | http://www.yellowman.dk/ |
| 11-25 (junior) | 2.78 kr. | 36 | 99,95 | |||
| 16-30 (XL) | 3.33 kr. | 30 | 99,95 | |||
| Med24 ApS | Moltex Öko | 7-18 (maxi) | 3.31 kr. | 42 | 139 | http://www.med24.dk/ |
| 11-25 (junior) | 3.86 kr. | 36 | 139 | http://www.med24.dk/ | ||
| 16-30 (XL) | 4.63 kr. | 30 | 139 | http://www.med24.dk/ |
Table 5.19 Examples of paper diapers from the survey - shop visits
| Product name | Retailer | Comments |
| Libero | Bilka Føtex LIC (Lærernes indkøbscentral – a purchasing cooperative for teachers) SuperBest Kvickly |
|
| Pampers | Bilka Føtex LIC (Lærernes indkøbscentral – a purchasing cooperative for teachers) SuperBest |
|
| Babycare | Bilka Føtex |
|
| Huggins Pull Ups | Bilka Føtex Kvickly |
With colourful design on outside, e.g. cars and princesses or jeans design |
| Huggies | Super Brugsen Fakta Kvickly |
|
| Pusletid | Fakta | |
| Unique | SuperBest | |
| Moltex | SuperBest Kvickly |
Organic |
| Coop | Kvickly | All Swan Marked and perfume-/lotion-free |
| Vibelle | Aldi |
5.9.5.6 Product prices
As mentioned above, diapers are sold on offer and the price therefore varies from shop to shop, as well as week by week. However, Vibelle from Aldi is generally a very cheap diaper.
5.9.5.7 Selected products
Five products were selected within the diaper product group for detailed studies.
Every effort was made to select popular brands, organic/non-organic brands and expensive and cheap brands.
5.10 Sunscreens
Sunscreens are used frequently by 2-year-old children. Throughout the summer, there is long-term and direct exposure via the skin.
There are two main groups of sunscreens: Lotion/oil-based cream or spray.
There are a number of UV filters on the EU's candidate list of potential endocrine disruptors. These UV filters have been compared with the annex of the statutory order on cosmetics, on permitted UV filters in cosmetics. A number of parabens are also suspected of having endocrine disrupting effects including:
- UV filters of which two in particular permitted in cosmetic products are suspected of being endocrine disruptres:
- CAS 15087-24-8 – 3-benzylidene camphor
- CAS 5466-77-3 – Ethylhexyl methoxycinnamate.
- Parabenes (preservatives) permitted in cosmetic products:
- CAS 99-76-3 – Methylparaben
- CAS 120-47-8 – Ethylparaben
- CAS 94-13-3 – Propylparaben
- CAS 94-26-8 – Butylparaben
- CAS 4247-02-3 – Isobutylparaben (not on the EU's candidate list of potential endocrine disruptors).
- Perfume and aroma compounds (the 26 mandatory declaration perfume and aromatic compounds).
The Swan symbol criteria for cosmetics includes a requirement that none of the ingredients can be regarded as a potential endocrine disruptor in accordance with the official lists in any of the Nordic countries or EU (Nordic Environmental Marking, 2007 (Requirement K4)). If new substances are listed on the EU's candidate list of potential endocrine disruptors, they will not be permitted in Swan labelled cosmetics. Since 1 May 2008, it should therefore have been possible to phase out “new” substances listed on the EU's candidate list of potential endocrine disruptors (DG Environment, 2007) in Swan labelled cosmetics. However, there will still be some products on the shelves containing some EU-listed substances, as the manufacturers have been granted permission to sell products in stock produced before 1/5-08. As such, the EU-listed UV filter ethylhexyl methoxycinnamate (OMC) will still temporarily be available in the shops. Swan labelled products for the 2009 summer season will have been manufactured without OMC or other substances on the candidate list (personal communication with Miljømærkning Danmark, September 2008). Other products that do not have the Swan symbol, may also be free of parabens and substances suspected to be endocrine disruptors. If cosmetic products do contain parabens, for example, this will be apparent from the symbol.
5.10.1 Legislation
The statutory order on cosmetics applies to sunscreens. This is described in detail in section 4.3 Statutory order on cosmetics.
5.10.2 Delimitation
We have exclusively focused on sunscreens sold specifically for children, i.e. marked with "kids", "children", "børn", "baby" or "junior". Sunscreens used for children, even though they do not specifically state they are for children, have been included, such as those for the whole family; those with the Danish Asthma and Allergy Association’s symbol; or the Environment symbol, and bought for children. For example Sol Lotion and Dermas sunscreen range from the pharmacies (the Swan symbol and declaration in collaboration with the Danish Asthma and Allergy Association).
5.10.3 Description of product type in use
Sunscreen is primarily used during the summer period, from June to August/September. During this period, it is typically used every day on 2-year-old children. An agreement often exists with nurseries/day-care centres that sunscreen is applied before the children are dropped off in the morning and once again by the centre personnel after lunch. Primarily, it will be the child's face, arms, legs and feet to which sunscreen is applied daily during the summer, but the whole body will also be covered if the children are allowed to play in a paddling pool or at the beach.
Sunscreens can of course also be used at other times of the year during holidays abroad (beach or skiing).
Kræftens Bekæmpelse (Danish Cancer Society) writes on its website that use of copious amounts of sunscreen is recommended, i.e. children should use a child's handful (approx. 20 ml). It also states that 20 grams of sunscreen should be used per m2 skin. (Kræftens Bekæmpelse, 2008). As such, children will be exposed daily via their skin to the maximum amount of sunscreen applied during the times of year it is necessary.
5.10.4 Survey of the range of sunscreens
5.10.4.1 Procedure
The Trade Association for Soap, Perfume and Technical/Chemical Articles (SPT) was contacted to establish what sunscreens are found on the Danish market, as well as to obtain an explanation on the list of ingredients, because many of the sunscreen products had been removed from the shelves when the survey was performed in October.
Coop, Dansk Supermarked and Matas were contacted to ask which brands and trade names they carried, which were the best sellers and how large a proportion of total sales in Denmark they accounted for.
Information on the various types of sunscreen on the web was sought via Google. This was done to find general details of sunscreens on the market and to identify a number of webshops selling them.
The primary method of surveying the market for sunscreens has however been physical purchase of the products in various shops, such as perfumeries, supermarkets and pharmacies. Several retail outlets were visited. These include the following:
- Føtex
- Bilka
- Kvickly
- Super Brugsen
- SuperBest
- Fakta
- Netto
- Irma
- Matas
- Pharmacies
- Magasin
- Victoria’s
- Lotus
- Douglas
- Helsemin
- The Body Shop
- Søstrene Grene.
The lists of ingredients were studied and the ingredients entered into an Access database to aid fast searches and provide an overview.
SPT has stated that the composition of sunscreens changes regularly, and that the products that are included in the project will not necessarily contain the same substances today. The lists of ingredients list the substances contained in the sunscreens.
5.10.5 Results of the survey
5.10.5.1 Products
Sunscreens are typically found in two variants: Lotion/oil-based cream or spray. They either contain a physical UV filter (often titanium dioxide), a chemical UV filter, or a combination of both for protection against UV radiation from the sun.
5.10.5.2 Results of surveying via trade associations and large retail chains
Trade association SPT
The SPT was contacted concerning which sunscreens were found on the Danish market; for details of the list og ingredients; and for concentrations of UV filter substances (if relevant). As agreed with SPT, the association sent an e-mail to selected members selling/stocking sunscreens, on behalf of the project group.
The association stated that often a new formulation is used for sunscreens every year. This means that the sunscreens bought for this survey will be out of date next year, at the time of the information campaign. We therefore enquired about the list of ingredients for sunscreens on the market in 2009. Focus has also been placed on the two UV filters suspected of being endocrine disruptors, in the hope of provoking reactions to their use on the market in 2009.
Individual companies made contact by phone to ask for more details on the project, but none have supplied information. The manufacturer of Derma products – Derma Pharm - has offered help, but the lists of ingredients for these products are already available via the web.
Coop
Coop has sent the lists of ingredients on their current range of products. These were entered into the database.
Matas
The lists of ingredients for formulations for 2009 could not be included in the survey, but Matas sunscreens have awarded the Nordic Environmental Label (the Swan symbol) and do not contain substances that are found on the EU's candidate list of potential endocrine disruptors nor the 26 perfume and aromatic compounds subject to mandatory declaration.
Derma Pharm
Derma Pharm have confirmed that all their products can and are used by 2-year-olds, including those products not in their baby range. The lists of ingredients are found on their website and have been entered into the database. Derma Pharm states that they strive to ensure that their baby sunscreens in particular contain the minimum amounts of chemical solar filters, and to keep the number of ingredients to a minimum.
Pharmacies
Two pharmacies were visited to purchase sunscreens, one of which stated that the Vichy and La Roche Posay sunscreens were the best sellers.
5.10.5.3 Product list
Table 5.20 lists the sunscreens surveyed in the project. Unfortunately, late September/early October is not a good time for surveying sunscreens, as many stockists have removed them from the shelves. We did however manage to visit several shops and find a total of 28 different sunscreens for children/babies.
Table 5.20 Sunscreens found in shops and webshops
| Shop | Product name | Manufacturer/Importer |
| Douglas | Nivea Sun Children's Sun Spray | Beiersdorf, Copenhagen |
| Lotus | Dr. Hauschka Sunscreen Cream Children | Dr. Hauschka Skin Care, WALA Heilmittel GmbH, Germany |
| Magasin | Clarins Paris - Sun Care Cream High Protection | Clarins Paris |
| Svane Apotek (pharmacy) | VICHY Capital Soleil Spray enfants 30 SPF | Vichy France |
| Svane Apotek | Eau Thermale Avène High Protection Lotion for children SPF40 | Laboratoires Dermatologiques Avene, France |
| Svane Apotek | La Roche-Posay - Anthelios - Peau fragile de l'enfant | La Roche-Posay, France |
| Svane Apotek | Cosmea Børne sollotion SPF25 | Cosmea Aco, Hørsholm |
| www.neutral.dk | Neutral - Kids Solcreme faktor 25 | |
| www.med24.dk | Lavera Sun Sensitive Kids Sol Spray SPF25 – Sunblock | Lavera? |
| www.solbutikken.dk | Lavera Sun Sensitiv Baby & Children Solcreme SPF30 – Sunblock | Lavera? |
| www.aloevera.dk | Aloe Vera Kids SunSafe SPF 25 | |
| www.med24.dk | Junior Intensive Protection Lotion SPF 25 | |
| www.med24.dk | Lavera Sun Sensitiv Baby & Children Neutral Solspray SPF30 | |
| www.derma.dk | Derma Baby Solcreme, SPF 30 - Svanemærket | Derma |
| www.derma.dk | Derma Solcreme SPF 20 – Svanemærket | Derma |
| www.derma.dk | Derma Solspray SPF20 – Svanemærket | Derma |
| Super Brugsen | Sunsafe Sunlotion SPF 30 - til børn og babyer | Marinello Cosmetics |
| Super Brugsen | Nivea Sun Childrens Sun Lotion 15 | Beiersdorf |
| Allerød apotek | Apotekets Sol Lotion Faktor 20 - Svanemærket | Apotekernes amba |
| Coop | Coop änglamark Minirisk Sunlotion til børn og voksne - Faktor 15 – Svanemærket | Coop |
| Coop | Coop änglamark Minirisk Sunlotion til børn og voksne - Faktor 30 – Svanemærket | Coop |
| www.aquakids.dk | Organic Children Sunlotion SPF25 | Greenpeople |
| www.livfuld.dk | Aubrey Natural Sun SPF25 Ideal for Children | aubrey |
| ABENA | Bambo skincare solcreme til børn SPF30 | Abena |
| www.apotekernes.dk | Apotekets Sol Lotion Faktor 10 - Svanemærket | Apotekernes amba |
| www.apotekernes.dk | Apotekets Sol Lotion Faktor 30 - Svanemærket | Apotekernes amba |
| Matas | Matas Kids Solspray SPF 15 – Svanemærket | Matas |
| Matas | Matas Kids Sollotion SPF 15 – Svanemærket | Matas |
5.10.5.4 Exctracts from the Access database
An extract from the Access database reveals the following:
Sunscreens containing UV filters suspected of being endocrine disruptors
An extract from the Access database shows that none of the 28 sunscreens contain the UV filter 3-benzylidene camphor[15] but that two of them contain the UV filter ethylhexyl methoxycinnamate. They are:
- Nivea Sun Children's Sun Spray
- Eau Thermale Avène High Protection Lotion for children SPF40.
Sunscreens containing parabens
Seven sunscreens containing parabens were found:
- Seven sunscreens containing methylparaben.
- Two sunscreens containing ethylparaben.
- Five sunscreens containing propylparaben. They are:
- Nivea Sun Children's Sun Spray (found in a perfumery).
- Nivea Sun Children's Sun Lotion 15 (found in a supermarket).
- Cosmea Børne sollotion SPF25 (found in a pharmacy)
- Junior Intensive Protection Lotion SPF 25 (found at www.med24.dk).
- Eau Thermale Avène High Protection Lotion for children SPF40 (found in a pharmacy).
- One sunscreen containing butylparaben. This is:
- Eau Thermale Avène High Protection Lotion for children SPF40 (found in a pharmacy).
Apotekernes A.m.b.a., which sells Eau Thermale Avène sun lotion states that the product will not be sold in Denmark in 2009, and that all parabens will be removed form the product in 2010.
Sunscreens containing the 26 allergenic perfume and aromatic compounds whose declaration is mandatory.
Six sunscreens containing one or more of the 26 allergenic perfume and aromatic compounds at a concentration at which they must be declared on the product were found. They are:
- Nivea Sun Children's Sun Lotion 15 (contains 10 of the 26 perfume and aromatic compounds whose declaration is mandatory).
- Nivea Sun Children's Sun Spray (contains 8 of the 26 perfume and aromatic compounds whose declaration is mandatory).
- Dr. Hauschka Sunscreen Cream Children (contains 8 of the 26 perfume and aromatic compounds whose declaration is mandatory).
- Lavera Sun Sensitive Baby & Children Solcreme SPF30 – Sunblock (contains 7 of the 26 perfume and aromatic compounds whose declaration is mandatory).
- Lavera Sun Sensitive Kids Sol Spray SPF25 – Sunblock (contains 7 of the 26 perfume and aromatic compounds whose declaration is mandatory).
- Clarins Paris - Sun Care Cream High Protection (contains 5 of the 26 perfume and aromatic compounds whose declaration is mandatory).
A list of all the ingredients found in these 28 sunscreens is contained in Appendix A.
5.10.5.5 Selected products
On the basis of the survey that revealed that two sunscreens contain the potential endocrine disruptor UV filters, it was decided to perform a quantitative analysis of the UV filter in:
- Nivea Sun Children's Sun Spray
- Eau Thermale Avène High Protection Lotion for children SPF40.
The manufacturers were subsequently contacted to find out the volume of the UV filter used in these two products.
The co-operative trade company Apotekernes A.m.b.a., which stocks Eau Thermale Avène sunscreen, has contacted the French manufacturer, who could not state the precise concentration of the UVfilter. The manufacturer states that the contents are within the permitted limit stated in the statutory order on cosmetics (10%). Apotekernes A.m.b.a. state that the product will not be on the market in 2009, and that the UV filter will be phased out from sunscreen products in 2010.
Beiersdorf, which stocks Nivea sunscreens, has stated that the sunscreen bought during the survey is no longer manufactured. It has been replaced by Nivea Sun Children Spray SPF 20 with a new formula with no ethylhexyl methoxycinnamate UV filter content. This filter is, however, still found in the spray product with SPF 50, but this is not sold in Denmark.
5.11 Moisturising creams/ oil-based creams/lotions.
Moisturising creams, oil-based creams and lotions for children can be frequently used on 2-year-olds. This may depend on the habits of the adult (particularly women) and whether the child suffers from eczema. In the case of the latter, when use of moisturising creams and oil-based creams is extensive, there will be long-term and direct exposure all year round via the skin.
With regard to the prioritised relevant chemical substances in this project, moisturising creams, oil-based creams and lotions are relevant in relation to parabens and perfume and aromatic compounds. There are also a number of parabens suspected of having endocrine disruptor effects including:
- Parabenes (preservatives) permitted in cosmetic products, but suspected of being endocrine disruptors:
- CAS 99-76-3 – Methylparaben
- CAS 120-47-8 – Ethylparaben
- CAS 94-13-3 – Propylparaben
- CAS 94-26-8 – Butylparaben
- CAS 4247-02-3 – Isobutylparaben (not on the EU's candidate list of potential endocrine disruptors).
- Perfume and aromatic compounds (the 26 mandatory declaration perfume and aromatic compounds).
The Swan symbol criteria for cosmetics includes a requirement that none of the ingredients can be regarded as being a potential endocrine disruptor in accordance with the official lists in any of the Nordic countries or EU (Nordic Environmental Marking, 2007 (Requirement K4)).
5.11.1 Legislation
The statutory order on cosmetics applies to creams. This is described in detail in section 4.3 of the Statutory order on cosmetics.
5.11.2 Delimitation
We have focused exclusively on moisturising creams, oil-based creams and lotions sold specifically for or used by children. This means the focus was on moisturising creams, oil-based creams and lotions stated on the labels as being specifically for "kids", "children", "baby", or equivalent. In addition, products have been included in particular from pharmacies which stock a range of moisturising creams, oil-based creams and lotions recommended for children – for general skin care and for children with eczema.
We had decided in advance not to perform any analyses of this product group, but details have been collected of their ingredients, either by contacting the manufacturer or by buying the products (and reading the INCI names on the list of ingredients).
5.11.3 Description of product types in use
Moisturising creams, oil-based creams and lotions can be used on 2-year-olds all year round. Some will have moisturising creams, oil-based creams and lotions applied daily, others only after a bath, eczema-sufferers in particular will have them applied up to twice daily all year round, whilst others do not have any applied at all. Moisturising creams, oil-based creams and lotions can of course also be used at other times of the year, for example on the face during the winter against chapping. Exposure is thus direct, via skin contact.
5.11.4 Survey of the range of moisturising creams, oil-based creams and lotions
5.11.4.1 Procedure
The Trade Association for Soap, Perfume and Technical/Chemical Articles (SPT) was contacted to establish which moisturising creams, oil-based creams and lotions are available on the Danish market, as well as for an explanation on the list of ingredients.
Coop, Dansk Supermarked and Matas were contacted to ask which brands and trade names they carried, what were the best selling brands and how large a proportion of total sales in Denmark they accounted for.
Information on the various types of moisturising creams, oil-based creams and lotions on the web was sought via Google. This was done to find general details of moisturising creams, oil-based creams and lotions on the market and to identify a number of webshops selling them.
The primary method of surveying the market for moisturising creams, oil-based creams and lotions has however been physical purchase of the products in various shops, such as perfumeries, supermarkets and pharmacies. Several retail outlets were visited. These include the following:
- Føtex
- Bilka
- Kvickly
- Super Brugsen
- SuperBest
- Fakta
- Netto
- Irma
- Matas
- Pharmacies
- Magasin
- Victoria’s
- Lotus
- Douglas
- Helsemin
- The Body Shop
- Søstrene Grene.
The lists of ingredients were studied and the ingredients entered into an Access database to aid fast searches and provide an overview.
SPT has stated that the composition of sunscreens changes regularly, and that the products that are included in the project will not necessarily contain the same substances today. The lists of ingredients identify the substances contained in the sunscreens.
5.11.5 Results of the survey
5.11.5.1 Products
During the survey, the following types of moisturising creams, oil-based creams and lotions were found:
- Face creams
- Body lotion/skin lotion
- Moisturising creams
- Oil-based creams
The difference between body lotion, moisturising creams and oil-based cream variants is typically a question of oil-content. Lotions are more viscous and contain less oil than moisturising creams and oil-based creams. Oil-based creams have a paste-like consistency and a high oil content.
5.11.5.2 Results of surveying via trade associations and large retail chains
The Trade Association SPT
The SPT was contacted on the issue of what moisturising creams, oil-based creams and lotions were available on the Danish market, as well as for details of the list of ingredients. As agreed with SPT, the association sent an e-mail on behalf of the project group to selected members that sell/stock moisturising creams, oil-based creams and lotions.
Contact with the SPT resulted in individual companies making contact by phone to ask for more details on the project, but none have supplied information. The manufacturer of Derma products – Derma Pharm - offered help, but the lists of ingredients for these products are already available via the web.
Coop
Coop forwarded the lists of ingredients on their current range of products. These were entered into the database. Coop states that their own brand of babycare products account for most of their sales, but other than that Natusan is the brand that sells most.
Derma Pharm
Derma Pharm have confirmed that all their products can and are used by 2-year-olds, including those products not in their baby range. The lists of ingredients are available on their website and have been entered into the database.
Pharmacies
Moisturising creams, oil-based creams and lotions were purchased from two pharmacies. In one of the pharmacies it was stated that the brands Dermalog and Decubal were the most sold products for general skin care, whereas A-derma was the bestselling product for eczema treatment.
5.11.5.3 Product list
Table 5.21 lists the 32 moisturising creams, oil-based creams and lotions surveyed in the project.
Table 5.21 moisturising creams/oil-based creams/lotions found in shops and webshops
| Address of purchase | Product name | Manufacturer/Importer |
| Helsemin | Earth Friendly Baby - Organic Lavender Body Lotion | HealthQuest Ltd, Edgeware HA8 7BJ, UK |
| Helsemin | Earth Friendly Baby - Organic Chamomile Body Lotion | HealthQuest Ltd, Edgeware HA8 7BJ, UK |
| Helsemin | Mellisa Luksus Mild Baby Lotion m. Aloe Vera | Mellisa Naturkosmetik ApS |
| Magasin | Weleda Baby - Calendula Moisturising Body Cream | Weleda AG, Germany |
| Magasin | Weleda Baby - Calendula Body Lotion | Weleda AG, Switzerland |
| Bilka One Stop | Natusan baby Original lotion | Johnson & Johnson |
| Bilka One Stop | Natusan baby - Softlotion Extracare | Johnson & Johnson |
| Bilka One Stop | Neutral Baby Lotion – Svanemærket | a/s Blumøller |
| Bilka One Stop | Baby Care Hudlotion | Manufactured in the EU for Dansk Supermarked |
| Bilka One Stop | Baby Care Ansigtscreme | Manufactured in the EU for Dansk Supermarked |
| Bilka One Stop | Baby Care créme | Manufactured in the EU for Dansk Supermarked |
| Netto | Baby' O Soft Cream | Manufactured in Denmark for Netto A/S |
| Svane Apotek | Locobase Fedtcreme | Astellas pharma |
| Svane Apotek | Decubal - The original decubal cream | Actavis, Gentofte |
| Svane Apotek | Apotekets Baby Lotion - Svanemærket | Apotekernes amba |
| Svane Apotek | A-DERMA Atopic Skin Exomega Emollient milk body | Ducray Paris |
| Svane Apotek | Danatekt creme | Orion Pharma, Nivå |
| www.oriflame.dk | Body Lotion - Giraffen Gerald | Oriflame? |
| www.derma.dk | Derma Babycreme - Svanemærket | Derma |
| www.derma.dk | Derma Bodylotion - Svanemærket | Derma |
| www.dermalog.dk | Dermalog Fedtcreme - Svanemærket | Dermalog, Holte |
| www.dermalog.dk | Dermalog Fugtighedscreme - Svanemærket | Dermalog, Holte |
| Victoria's | Crabtree & Evelyn Pudycat comfort cream | |
| Allerød apotek | Dermalog Hudlotion - Svanemærket | Dermalog, Holte |
| Allerød apotek | Ceridal Fedtcreme | Stiefel Laboratories, CPH |
| Allerød apotek | Locobase Repair | Astellas |
| Allerød apotek | Apotekets Baby Creme - Svanemærket | Apotekernes amba |
| Allerød apotek | A-derma Exomega Creme - tør og irriteret hud | Laboratoires Dermatologiques Ducray, France |
| Allerød apotek | Decubal Recover Cream | Actavis |
| Coop | Coop änglamark Minirisk Baby lotion - Svanemærket | Coop |
| Coop | Coop änglamark Minirisk Baby Fed creme - Svanemærket | Coop |
| www.aquakids.dk | Organic Children Toptotoe Lotion & Aftersun | Green People |
5.11.5.4 Extracts from the Access database
An extract from the Access database reveals the following:
Moisturising creams, oil-based creams and lotions containing parabens
Seven moisturising creams, oil-based creams and lotions containing parabens were found:
- Seven moisturising creams, oil-based creams and lotions containing parabens.
- Four moisturising creams, oil-based creams and lotions containing ethylparaben.
- Six moisturising creams, oil-based creams and lotions containing propylparaben. These moisturising creams, oil-based creams and lotions are:
- Baby Care Hudlotion (found in a supermarket).
- Baby Care Ansigtscreme (found in a supermarket).
- Baby Care Creme (found in a supermarket).
- Body Lotion - Giraffen Gerald (found at www.oriflame.dk).
- Crabtree & Evelyn Pudycat comfort cream (found in a perfumery)
- Decubal Recover Cream (found in a pharmacy).
- One moisturising cream, oil-based cream or lotion containing butylparaben. This is:
- Crabtree & Evelyn Pudycat comfort cream (found in a perfumery)
- One moisturising cream, oil-based cream or lotion containing isobutylparaben. This is:
- Crabtree & Evelyn Pudycat comfort cream (found in a perfumery) However, this was a discontinued product which is being withdrawn from the market to be replaced by a new product.
Moisturising creams, oil-based creams or lotions containing the 26 allergenic perfume and aromatic compounds whose declaration is mandatory.
Six moisturising creams, oil-based creams and lotions containing one or more of the 26 perfume and aromatic compounds whose declaration is mandatory in a concentration at which they must be declared on the product were found. They are:
- Body Lotion - Giraffen Gerald (contains 2 of the 26 perfume and aromatic compounds).
- Earth Friendly Baby - Organic Chamomile Body Lotion (contains 2 of the 26 perfume and aromatic compounds whose declaration is mandatory).
- Organic Children Toptotoe Lotion & Aftersun (contains 2 of the 26 perfume and aromatic compounds whose declaration is mandatory).
- Earth Friendly Baby - Organic Lavender Body Lotion(contains 3 of the 26 perfume and aromatic compounds whose declaration is mandatory).
- Weleda Baby - Calendula Body Lotion (contains 3 of the 26 perfume and aromatic compounds whose declaration is mandatory).
- Weleda Baby - Calendula Moisturising Body Cream (contains 5 of the 26 perfume and aromatic compounds whose declaration is mandatory).
A list of all ingredients found in these 32 moisturising creams, oil-based creams and lotions is contained in Appendix B.
5.12 Bed linen
Two -year-old children can be expected to use a duvet with a duvet cover primarily at night, but in many cases also when they take a nap. As such, the child has skin contact with the bed linen for many hours at a time.
5.12.1 Legislation
Legislation applying to bed linen has different limitations on use of substances such as brominated flame retardants, impregnation substances, PFOS and its derivatives, heavy metals, nickel etc. These are described further in section 4.2. Textiles.
5.12.2 Delimitation
Bed linen for 2-year-olds are defined as junior bed linen, i.e. size 90 x 140 cm/100 x 140 cm.
5.12.3 Description of product types in use
Two-year-olds sleep under a duvet covered by a duvet cover or sometimes under the cover alone (i.e. without the duvet). As such, they are exposed to the chemical substances possibly contained in the bed linen for the many hours they are asleep. There can be direct skin contact if they sleep without nightclothes in the summer. The possibility of direct ingestion of various substances exists if the children suck on a corner of a sheet, for example.
5.12.4 Survey of the range of bed linen
5.12.4.1 Procedure
An enquiry was made to The Danish Chamber of Commerce for contacts with trade associations.
Coop, Dansk Supermarked and Ikea were contacted to ask which brands and trade names they carried, which were the best sellers and how large a proportion of total sales in Denmark they accounted for.
A number of retail chains specialising in baby articles were also contacted, including BabySam, Ønske Børn and BabyVest.
Several retail outlets were visited. These include the following:
- Føtex
- Netto
- Bilka
- Kvickly
- Jysk
- Ikea
- LIC (Lærernes indkøbscentral – a purchasing cooperative for teachers)
- Toys’R’Us
- BabySam
- BabyVest
- Magasin
In addition, catalogues, advertisements, etc. were also surveyed.
The Google search engine was searched using various search words and combinations of the same. This was done to find general details of junior bed linen on the market, and to identify a number of webshops selling junior bed linen.
A number of specific websites were also searched.
5.12.5 Results of the survey
5.12.5.1 Results of surveying via trade associations and large retail chains
The Danish Chamber of Commerce
The Danish Chamber of Commerce did not consider itself able to provide any details stating that companies cannot be expected to inform which products they sell most of, as doing so will ensure that their products are selected for analysis and thus place them in the public spotlight. The Danish Chamber of Commerce suggested direct contact with the major baby article chains, which was subsequently taken up.
Coop
Coop has stated that they the junior bed linen they stock are mainly own brand (ID) and brands they sell under license.
Jysk
Jysk has stated that they can regrettably not take part in the survey. The reason given is the very tight deadlines of the project.
5.12.5.2 Result of surveying via websites
8 relevant online webshops were found using the Google search machine and the websites of presumed retailers.
"Junior bed linen" - returned approx. 12,900 results. The first 7 pages presented were surveyed for dealers. Each page contains 10 search results – i.e. 70 results in total. The survey was performed through the search engine's short results or by visiting individual sites.
5.12.5.3 Result of surveying via shop visits
The largest range of junior bed linen registered from the shops visited was at Ikea, but Jysk also stocked a large range.
The Disney brand was stocked by many of the shops visited.
Prices registered at LIC (a purchasing cooperative) are typically 100-150 kr. under market price (according to details in the shop).
All bed linen registered at Ikea were 100% cotton.
5.12.5.4 Product list
Table 5.22 and Table 5.23 present a range of products registered during the survey.
Table 5.22 Examples of junior bed linen from the survey - webshops
Table 5.23 Examples of junior bed linen from the survey - shop visits
| Product name | Retailer | Price | Comments |
| No name | Netto | 149 kr. | With Rasmus Klump and Cirkeline print |
| Høie – bil | LIC (Lærernes indkøbscentral – a purchasing cooperative for teachers) | 225 kr. | Extra fine cotton |
| Høie – fisk aqua | LIC (Lærernes indkøbscentral – a purchasing cooperative for teachers) | 189 kr. | Fine cotton |
| Høie – Kardemommeby | LIC (Lærernes indkøbscentral – a purchasing cooperative for teachers) | 279 kr. | Fine cotton |
| Høie Prinsesse | LIC (Lærernes indkøbscentral – a purchasing cooperative for teachers) | 279 kr. | Fine cotton |
| Høie Junior krepp | LIC (Lærernes indkøbscentral – a purchasing cooperative for teachers) | 229 kr. | |
| Fryd | LIC (Lærernes indkøbscentral – a purchasing cooperative for teachers) | 229 kr. | |
| Night & Day | LIC (Lærernes indkøbscentral – a purchasing cooperative for teachers) Magasin |
449 kr. 399 kr. and 599 kr. |
|
| Night & Day | Magasin | 499 kr. | Made of organic cotton. |
| Mads og Mette | Føtex | 79.95 kr. | Many different prints and patterns |
| Disney | Jysk Bilka |
149 kr. 109 kr.-119 kr. |
Many different prints and patterns |
| Note | Bilka | 69.95 kr. | Many different prints and patterns |
| Kids Collection | Jysk Magasin |
99 kr.-149 kr. 279 kr. |
Many different prints and patterns |
| Peder Pedal | Jysk | 149 kr. | KE Leisure (K. E. Mathiasen i Brabrand) |
| Postman Per | Jysk | 149 kr. | KE Leisure (K. E. Mathiasen i Brabrand) |
| Spiderman | Jysk | 149 kr. | |
| Bamse og Kylling | Jysk | 149 kr. | www.dr.dk |
| Kaj og Andrea | Jysk | 149 kr. | www.dr.dk |
| Baby Dan | BabyVest | 299 kr. | Very big brand according to manager of the BabyVest shop visited. |
| Gaia og Ko | BabyVest | 399 kr. | Very modern brand at this time according to manager of the BabyVest shop visited. |
| Barnslig Snurr | Ikea | 75 kr. | 3 piece (incl. sheet) |
| Barnslig Djur | Ikea | 129 kr. | |
| Barnslig Djur | Ikea | 149 kr. | |
| Fabler Kalas | Ikea | 149 kr. | |
| Fabler Kalas | Ikea | 129 kr. | |
| Siffror | Ikea | 75 kr. | 3 piece (incl. sheet) |
| Hjärten | Ikea | 75 kr. | 3 piece (incl. sheet) |
| Korall Rev | Ikea | 99 kr. | |
| Korall Rev | Ikea | 99 kr. | |
| ID – Ideas daily | Kvickly | 69.95 kr. | Øko-Tex mark |
| ID – Ideas daily | Kvickly | 59.95 kr. | No Øko-Tex mark |
| Frank Fisher | Magasin | 449 kr. and 49 kr. | |
| Borås | Magasin | 329 kr. | |
| Sebra | Magasin | 269,95 kr. | |
| Magasin – Egyptian satin cotton | Magasin | 249.95 kr. |
5.12.5.5 Product prices
The survey registered junior bed linen prices from between 69.95 kr. per set to 649 kr. per set.
5.12.5.6 Selected products
Five products were selected from the junior bed linen product group for detailed studies.
[13] www.varefakta.dk/73/oversigt-narresutter_med_varefakta
[14] According to netdoktor.dk, 2-year olds weigh between 11.0 and 16.3 kgs, with an average of 13.3 kgs.
[15] A scan was also performed for 4-MBC, which should now have been removed from Danish sunscreen products. None of the 21 sunscreens contained 4-MBC (4-methylbenzylidene camphor)
6 Chemical analyses
- 6.1 Analyses
- 6.2 Exposure scenarios
- 6.3 Outdoor clothes (jackets and mittens)
- 6.3.1 Summary of results
- 6.3.2 Description of product type
- 6.3.3 Selected products
- 6.3.4 Analyses methods
- 6.3.4.1 X-ray analysis
- 6.3.4.2 GC/MS analysis, extractable organic substances
- 6.3.4.3 Spectrophotometer analysis of formaldehyde.
- 6.3.4.4 ICP-MS and GC/MS for organotin compounds
- 6.3.4.5 Quantitative GC/MS analysis for perfluorous compounds
- 6.3.4.6 GC/MS analysis, migration studies for organic compounds
- 6.3.4.7 HPLC analyses and migration studies for TDI and MDI
- 6.3.5 Results of initial analyses
- 6.3.6 Quantitative analyses and migration studies
- 6.4 Footwear
- 6.5 Pacifiers
- 6.6 Soap packaging
- 6.7 Non-slip figures and mats
- 6.8 Soft toys
- 6.9 Diapers
- 6.10 Bed linen
- 6.11 Overview of quantitative analyses and migration analyses
6.1 Analyses
The purpose of the analysis in this project was to establish whether the product groups selected contained chemical substances that are potentially endocrine disruptors or allergens. The analysis programme consists of three elements: Screening analyses, quantitative analyses and migration analyses with different exposure scenarios.
The screening analyses were performed to identify the ingredients in the products selected. Further studies were performed on some of the products based on the results of the screening analyses. The product groups selected contained chemical substances that are potentially endocrine disruptors or allergens. Various exposure scenarios simulate contact with the skin and mouth using artificial sweat and saliva. Simulated inhalation was used to study release. The reasons for choosing these scenarios are described in Chapter 7.
Quantitative content analyses of selected substances and products were made to compare the total content of a product with that a child can be expected to be exposed to through contact with the product. The results were used to perform a risk assessment, including a comparison with previous quantitative studies that did not include exposure scenarios.
6.1.1 Product groups selected for analysis.
On the basis of the knowledge collected in Chapter 3 on previously studied substances and products, 12 product groups were selected for surveying.
The following 12 product groups were surveyed, see Chapter 3:
- Outdoor clothes in the form of jackets
- Outdoor clothes in the form of mittens
- Footwear in the form of rubber clogs.
- Footwear in the form of rubber boots (rubber boots).
- Pacifiers, primarily those in which the plastic part is made of polycarbonate.
- Bath soap packaging in which packaging is shaped as various figures and animals
- Non-slip figures and mats for bathtubs/showers
- Soft toys, including scented soft toys to be heated in a microwave oven
- Diapers
- Sunscreens
- Moisturising creams/oil-based creams/lotions
- Bed linen.
Of these 12 product groups, the following 10 were selected for analyses:
- Jackets
- Mittens
- Rubber clogs
- Unlined rubber boots
- Pacifiers, primarily those in which the plastic part is made of polycarbonate
- Bath soap packaging in which packaging is shaped as various figures and animals
- Non-slip figures and mats for bathtubs/showers
- Soft toys, including scented soft toyss to be heated in a microwave oven
- Diapers
- Bed linen.
Moisturising creams/oil-based creams/ lotions and sunscreens were not selected because, as agreed with DEPA, risk assessment was to be performed based on maximum permitted amount of the declared content of the products.
Each product group belongs to an arena of use, described in more detail in Chapter 3. Table 6.1 presents a list of the product groups by arena.
Table 6.1 Relationship between arenas of use and product groups analysed
| Arena of use | Product group |
| Good morning: Clothes | Diapers |
| Good morning: Breakfast: | |
| Good day: Indoors play | |
| Good day: Playing outside | Outdoor clothes, footwear, sunscreens |
| Good night: Bath | Bath soap packaging, non-slip figures and bath mats, moisturising creams |
| Good night: Bed | Pacifiers, bed linen, soft toys |
Diapers fall into all arenas, which is to be expected as most 2-year-olds wear diapers day and night.
6.1.2 Analysis programme composition
The structure of the analysis programme is justified below. First an overall description is provided, followed by a summary of the conclusions of all analyses.
The product groups are described individually in the following chapters. The description includes methods and results of screening analyses, quantitative analyses and migration analyses, including reasons for selection of substances and products for more detailed studies.
A range of substances or substance groups have been selected and described in Chapter 3. Initially, there were more under consideration, but some were excluded. The analyses focused on the following substances and substance groups:
- Bisphenol A, used for the production of certain plastic types, e.g. polycarbonate, and previously found in items such as baby bottles.
- Phthalates, used as softeners, primarily in PVC.
- Poly- and perfluorous compounds, which can be used in impregnating agents, and which were previously found in impregnated products.
- Organotin compounds used as preservatives, biocides, and as a stabiliser in soft plastics. The substances were previously found in products in which odour problems were to be minimised, e.g. textiles.
- Formaldehyde, used as a preservative, usually in cotton products stored and transported over long periods and under hot and humid conditions. Formaldehyde occurs most frequently in non-crease impregnated/non-iron-impregnated or printed textiles. Formaldehyde can also be found in adhesives, e.g. if a substance has a napped surface, or if decorative stones/glitter have been glued on.
- Orthophenylphenol (OPP), used as a preservative and previously found in textile and paper products.
- 2-mercaptobenzothiazole (MBT), typically used as an accelerator in the production of rubber.
- Colofonium, a mixture of 3 resin acids, of which abietine acid comprises 90%. This substance has adhesive properties and is therefore used as an adhesive in many different products.
Table 6.2 presents the analysis methods used in the project.
The initial screening programme was based on knowledge from the survey as to which products could contain the substances. All the products selected were extracted with dichloromethane and analysed using GC/MS to determine the content of extractable organic substances.
In cases where the material composition is not stated on the product nor the accompanying packaging, and where the product was suspected of being made of polycarbonate or PVC, an FTIR analysis has been performed in order to determine the material type. The aim was to provide information to consumers on the relationship between material composition and the presence of bisphenol A and phthalates. The studies were not weighted, which gives the total material composition of the product.
Table 6.2 Analysis methods
| Substance groups | 1. X-ray analysis |
2. ICP-MS |
3. GC/MS |
4. Spectroph otometer |
5. FTIR |
6. Headspace GC/MS |
7. SPME |
8. HPLC |
| Bisphenol A | X | |||||||
| Phthalates | X | |||||||
| Poly -and perfluorous compounds | X (F) | X | ||||||
| Organotin | X (Sn) | X | ||||||
| Formaldehyde | X | |||||||
| 2-mercaptoben zothiazole (MBT) |
X | |||||||
| Orthophenylphenol (OPP) | X | |||||||
| Colofonium | X (derivatized) | |||||||
| Isocyanates | X | |||||||
| Material determination | X | |||||||
| Release of volatile organic compounds | X | |||||||
| Extractable volatile and semi-volatile organic compounds | X | |||||||
| Quantitative determination of substances from migration studies | X | X |
- X-ray analyses are used to screen for fluoride. If fluoride can be identified by X-ray screening, there may be perfluoride compounds in the product. Extraction and GC/MS analysis confirm possible content by identification of the compounds and quantification. Similarly, information is obtained on other interesting elements such as bromine, which can reveal flame-retardants.
- ICP-MS is used to determine the total content of tin, which can indicate possible content of organotin compounds. In the event of positive findings, GC/MS is performed to confirm by identification of the compounds and quantification.
- GC/MS screening is used to investigate the content of bisphenol A, phthalates, OPP, MBT and colofonium plus other volatile and semi-volatile organic substances, e.g. perfume and aromatic compounds. GC/MS-screening was performed on all products and quantitative analysis on certain products for certain substances.
- Spectrophotometric analysis was used to identify formaldehyde.
- FTIR was used to determine material type in those products where such information was of interest and not declared on the product.
- Headspace analysis was used to identify volatile organic compounds released by the product when heated.
- SPME was used for quantitative determination from migration studies
- HPLC was used for quantitative determination of isocyanates from migration studies
The screening methods used are described under each product group, as there are variations between methods due to the different material composition of the products. Results and details of which part(s) of the products were used for analysis are also given under each product group.
Based on the results of the screening analyses, products and substances were selected for quantitative analyses and exposure scenarios. The grounds for such choices are given under each product group and described in more detail in Chapter 3.
The exposure scenarios used are described in the following section, whilst the methods of quantitative determination of migrating substances and results are given under each product group.
Section 6.11 contains a list of the results of quantitative analyses and results of the migration studies.
6.2 Exposure scenarios
Choice of relevant exposure scenarios was based on the possible use of the products by 2-year-olds. This project focused on skin contact (sweat) and mouth contact (saliva) plus inhalation of perfume and aromatic compounds where relevant.
The scenarios (including the simulant used and exposure time) were selected in consultation with DEPA. Further grounds and references concerning the exposure scenarios are given in Chapter 7, Table 7.1.
Analysis results are given under each product group in the following section and in Table 6.82. Risk assessment of the analysis results is given in Chapter 7.
6.2.1 Exposure scenarios
Table 6.3 describes the various exposure scenarios used in this project.
Table 6.3 Exposure scenarios used
| Product | Simulant | Number hours per day | Reason |
| Lining in outdoor clothes (jackets and mittens) | Sweat | 3 hours | The child's skin can be in contact with the lining and the child can suck on the outside of the products. Children wear outdoor clothing when outdoors. |
| Outer material in outdoor clothes (jackets and mittens) | Saliva | 3 hours | |
| Pacifiers (coverage) | Saliva | 7 hours, 45 minutes | The child can hold a pacifier in its hand and suck/bite on the coverage. The child can use a pacifier at night, when taking a nap and for comfort. |
| Pacifiers (coverage) | Sweat | 7 hours, 45 minutes | |
| Soap packaging | Sweat | 0.5 hours | During bath time, the child can play and suck on the products. |
| Soap packaging | Saliva | 0.5 hours | |
| Non-slip mats | Sweat | 0.5 hours | The child sits on the product |
| Soft toys | Inhalation | 16 hours | Soft toys can be used for play and comfort and when sleeping. This project also focused on soft toys containing perfume and aromatic compounds. |
| Bed linen | Sweat | 10 hours | The child sleeps in bed linen at night when there is contact with the skin, including the face and hands. |
Studies were made for certain substances deemed to be relevant to risk assessment.
6.2.2 Artificial sweat, saliva simulants and temperatures used
Simulants for sweat and saliva migrations were selected based on whether they had previously been used for comparable analyses of toys and textiles, for example. Furthermore, these migration fluids were selected because they only contain organic substances, and thus minimise the risk of interference of the organic substances being analysed.
The artificial sweat simulant used is described in DS/EN ISO 105-E04, as used for ØKO-TEX certification (Öko-Tex Standard 100). The sweat simulant in DS/EN ISO 105-E04 consists of 1-histidine-monohydrochloride-1-hydrate, sodium chloride, sodium dihydrogen phosphate, and sodium hydroxide for adjustment of pH to pH 5.5.
The artificial saliva simulant is described in an EU project (Simoneau et al, 20001 EUR 19826 EN). It consists of calcium chloride, magnesium chloride, potassium carbonate, potassium chloride, potassium phosphate, sodium chloride, and hydrochloric acid for adjustment of pH to pH 6.8.
The migration tests were performed at 37°C, which is close to body temperature and is used in DS/EN-71-3, DS/EN ISO 105-E04 and the aforementioned EU report. The simulant was heated before being applied to the products for the migration tests. The samples were placed in a temperature-controlled oven (37+/- 3°C) for the number of hours stated in the analysis programme.
Where sample quantity was sufficient, approx. 2.5 g material to 50 ml simulant was used, which is the amount used in DS/EN ISO 105-E04. The samples were cut into as few pieces as possible to maximally simulate use situations.
6.3 Outdoor clothes (jackets and mittens)
Outdoor clothing comes under the Good Day arena: Playing outside. The project focussed on outdoor clothes marketed as being waterproof, water resistant, or dirt resistant.
6.3.1 Summary of results
Screening the exterior part of the textile materials in the products provided evidence for the presence of a large number of organic substances. Some of these organic substances are suspected of being harmful or potential endocrine disruptors. For example, isocyanates (potential allergens) were found in several of the products. Migration studies on artificial saliva showed that only a fraction of the content migrates.
In addition to the product textiles, certain labels, straps and a reflector that were made of soft polymer materials and deemed to represent a risk of phthalate content, were selected for analysis for phthalates. Phthalates were found in labels printed with product names on two mittens, in a loose-hanging reflector and in a strap on a jacket zip.
To test for impregnating agents containing perfluoride compounds all the products were screened for fluoride. The analysis revealed fluoride in all of them apart from product nos. 1-4. Closer investigation of certain jackets and mittens revealed the content of various perfluoride compounds. It was not possible to perform migration studies on these substances.
Formaldehyde was found in the lining of all products. Migration studies of a mitten lining showed that a large proportion of the content migrated to artificial sweat.
6.3.2 Description of product type
Jackets and mittens consist of an inner part which can come in contact with the child's skin and an outer part, which the child can suck on. It was therefore deemed to be important that both the outside and inside of the products were tested. Products with straps attached to zips were of interest, as 2-year-olds tend to suck on the strap.
The project focussed on outdoor clothes marketed as being waterproof and/or water resistant. To achieve these properties, the clothes can have:
- Impregnation on the outside
- Plastic linings/coatings on the outside or inside.
- Membranes on the rear or as a laminate in between the outer and inner materials.
Impregnation compounds can contain fluoride, but silicon compounds can also be used to provide a water resistant effect. The most common fluoride compounds used for this purpose are fluorocarbons, but fluorotelomers can also occur. It is also likely that membranes contain fluoropolymer compounds. Plastic linings can be polyurethane or polyvinylchloride and possible other types of polymers – it cannot be excluded that they can contain fluoride compounds.
6.3.3 Selected products
Table 6.4 and Table 6.4 list the products selected for analysis. The reasons for choosing these products are described in the survey.
Table 6.4 Selected products, jackets
| Product no. | Description | Information stated on the packaging or product (direct transcript) |
| 1-1 | Green with hood and reflectors | Water resistant. Outer material: 100% polyamide Lining: 100% polyester. Padding: 100% polyester. |
| 1-2 | Green and blue check. With reflectors. | Waterproof. Windproof. Breathable. A flexible material even at extreme minus degrees. Very hardwearing and watertight seams. Outer material, body lining and padding are 100% polyester. Arm linings 100% polyamide Extra impregnation |
| 1-3 | Purple, with reflectors. | Thermolite micro. Outer material 100% polyamide Lining and padding 100% polyester. |
| 1-4 | Yellow with reflectors on the arms. | Kaporous Waterproof, windproof and breathable. Water resistance: 2000 mm. Moisture permeability: 2000 - 2500 g/spm/24hrs. Air permeability: 0.01cc/spm.sec. Water repellence: 99%. Outer material: 100% nylon. Lining and padding 100% polyester. |
| 1-5 | Army green with reflectors on back and three exterior flaps. | Thermolite. WP 7000 waterproof and breathable fabric. Also windproof. Outer material: 100% nylon. Lining and padding 100% polyester. |
Table 6.5 Selected products, mittens
| Product no. | Description | Information stated on the packaging or product (direct transcript) |
| 2-1 | Dark purple mittens. Weight 40 g. Outer material: 100% nylon/PU Lining: 100% polyester. |
Thinsulate insulation 3M. Neo Kapo: Breathable, waterproof and windproof, due to a Hydrophillic PU membrane. Water resistance: <5000 - 8000 mmH2O. Moisture Permeability: 5000 g/m2/24Hrs. Water Repellence: 99% |
| 2-2 | Brown, with pink strips and Velcro closure. Weight 40 g. | Thinsulate TM insulation 3M. Water resistant. |
| 2-3 | Green with Velcro closure. | X-static: Anti odour, Thermodynamic, anti-static. Fibre system made fromf silver. |
| 2-4 | Red with black palm surface. | Dirt-resistant. |
| 2-5 | Pink with Velcro closure. | Waterproof and breathable. Water resistance: 10,000 mm. Air permeability: 8,000 gm, Water repellence: 99%. Outer material Mini ripstop 108. |
6.3.4 Analyses methods
The following sections explain the screening methods and quantitative Analysis methods applied. The migration analyses have been carried out as described in Chapter 6.2, and have subsequently been analysed using quantitative analyses. The procedures are described below.
6.3.4.1 X-ray analysis
X-ray screening analyses (WEXRF) were performed on the outer material of jacket arms and mittens for elementary substances that could indicate impregnation using poly and perfluorinated compounds (Fluoride) and flame-inhibitors (Sb, Br).
6.3.4.2 GC/MS analysis, extractable organic substances
A GC/MS analysis is used to test for the presence of extractable volatile and semi-volatile organic components. The outer material and other textile parts that are easily accessible to the child were analysed, e.g. zip straps and Velcro tapes. If mittens were made of different materials on the back and palm, both were analysed. A single analysis was performed. The analysis method is described in Table 6.6.
Some jackets and mittens have labels, straps and reflectors easily accessible to the child, and made of soft polymer materials deemed to represent a risk of phthalate content. These parts were analysed quantitatively for phthalates. A single analysis was performed due to limited samples.
Table 6.6 GC/MS screening of textiles and quantitative determination of phthalates in other materials
| Sampling | Outer material and other product parts. |
| Extraction agent and internal standards | Outer material (and edge material if relevant): ASE - Extraction agent: Acetone. Internal standard: Pyrene-d10. Velcro tapes, textile and elastic straps: Extraction agent: Dichlormethane: Acetone (3:1), extracted 1 hour using ultrasound and 1 hour using mechanical agitation. Internal standards: DEHP-d4, Pyrene-d10, Naphthalene-d8. Reflectors, labels, straps, etc of non-textile materials: Extraction method: Acetone. Internal standard: DEHP-d4 |
| GC/MS-instrument | Agilent GC/MS |
| GC-parameters | Column Phenomenex ZB-5 MS, 30 m x 0.5 mm id., 0.25 µm phase film Carrier gas: Helium, constant flow at 1.9 ml/min. Oven settings: 40ºC for 0.5 min., 20ºC/min. to 320ºC for 15 mins. Injection: 280ºC, splitless |
| MS-parameters | Scan mode: 29-550 m/z Solvent delay: 3 min. |
| Detection threshold | Outer material (and edge material if relevant) Velcro tapes, textile and elastic straps: 1-10 μg/g Phthalate analyses of reflectors, labels, straps, etc of non-textile materials: 10 μg/g |
6.3.4.3 Spectrophotometer analysis of formaldehyde.
Spectrophotometer analysis was used to identify formaldehyde. The analysis was performed according to Japanese law no. 112 (1973). This determines the content of formaldehyde which is not bound. The result is quantitative. Dual analyses were performed on mittens, whereby the analysis was accredited. Single analyses were performed on jackets, whereby the analysis was not accredited. Priority was given to obtaining maximum knowledge of the product's formaldehyde content, as the jacket linings consisted of several different materials, making it relevant to take samples on several places on the product. The analysis method is described in Table 6.7.
Table 6.7 Spectrophotometer analysis
| Sampling | 2.5 g |
| Extraction | Japanese law no. 112 (1973) Extracted at 40°C using 100 ml water in 1 hour. Filters, with acetyl acetone reagent added and 30 minutes in a water bath at 40°C |
| Spectrophotometer | Absorption maximum 412-415 nm |
| Detection threshold | 2 µg/g |
Sweat migration was performed according the methods described in Chapter 6.2 Exposure scenarios for a set of bed linen and a mitten. The migration fluid was then analysed as described above, as extraction with water was avoided. A dual analysis was performed.
6.3.4.4 ICP-MS and GC/MS for organotin compounds
The products were analysed for organotin compounds using migration to artificial sweat. The sweat was then ICP-MS analysed to screen for tin content. In the event of positive findings, GC/MS was performed to identify and quantify the organic tin compounds (mono-, di- and tributyltin. A single analysis was performed.
The analysis method is described in Table 6.8.
Table 6.8 ICP/MS and GC/MS analyses
| Sampling | Samples of the outer and inner material plus padding were taken. |
| Extraction ICP-MS | Extraction method: 1 hour using artificial sweat at 40 ºC, conc. nitric acid 0.14 M added. Extraction volume: 100 ml for padding and 50 ml interfacing/elastic |
| ICP-MS equipment | ion 118 og 120 |
| Settings | Rh |
| Detection threshold ICP-MS | 0.02 µg/g |
| Migration, GC/MS | Sweat migration Oven at 40 ºC for 3 hours. |
| Extraction method GC/MS | Migration fluid transferred to organic solvent: isooctane. Internal standard: DPT(di-n-propyltindichloride)-149 |
| GC/MS instrument | Agilent GC/MS |
| GC parameters | Column CP-Sil 8 CB Low Bleed, 30m x 0.25mm x0.50mm Carrier gas: Helium, constant flow at 15 PSI. Oven settings: 70 ºC for 0.5 min., 20 ºC/min. to 280 ºC for 16 mins. Injection: 280 ºC, splitless |
| MS-parameters | Sim mode Solvent delay: 4 min. |
| Detection threshold GC/MS | 0.05 μg/g |
6.3.4.5 Quantitative GC/MS analysis for perfluorous compounds
Analysis performed by Rosanna Bossi, Danmarks Miljøundersøgelser. The analysis method is described in
Table 6.9. External standards were used for quantification of the substances found.
Quantitative analysis of the perfluorous compounds in the migration fluids was attempted, but it was not possible to optimise the method to achieve satisfactory detection.
Table 6.9 Quantitative GC/MS analysis for perfluorous compounds
| Sampling | Outer material |
| Extraction method and internal standards | Extraction: MTBE/acetone (50:50, v/v) using soxhlet. Extracts evaporated. Internal standards: 4:2 FTOH d4, 6:2 FTOH d4, 8:2 FTOH d4, 10:2 FTOH d4, N-Me-FOSA d3, N-Et-FOSA d5, N-Me-FOSE d7 and N-ET-FOSE d9. |
| Detection threshold | 0.002-0.02 ng/cm2 |
Table 6.10 List of abbreviations and names for perfluorous compounds
| Group | Abbreviation | CAS-no. |
| Fluorotelomer alcohols | ||
| 1H,1H,2H,2H -perfluorohexanol | 4:2 FTOH | 2043-47-2 |
| 1H,1H,2H,2H –perfluorooctanol | 6:2 FTOH | 647-42-7 |
| 1H,1H,2H,2H-perfluorodecanol | 8:2 FTOH | 678-39-7 |
| 1H,1H,2H,2H-perfluorododecanol | 10:2 FTOH | 865-86-1 |
| Perfluorosulfonamides and sulfonamidoethanols | ||
| n-methyl perfluorooctanesulfonamide | N-Me-FOSA | 31506-32-8 |
| n-ethyl perfluorooctanesulfonamide | N-Et-FOSA | 4151-50-2 |
| n-ethyl perfluorooctanesulfonamidoethanol | Et-FOSE | 1691-99-2 |
| n-methyl perfluorooctanesulfonamidoethanol | Me-FOSE | 24448-09-7 |
6.3.4.6 GC/MS analysis, migration studies for organic compounds
Saliva migration was performed in accordance with the methods described in Chapter 6.2 of selected jackets and mittens for phthalates, triphenylphosphate, diglycidylbisphenol A and o-toluidine. A dual analysis was performed. The migration fluid was then extracted and analysed as described in Table 6.11.
Table 6.11 GC/MS analysis of migration fluids
| Sampling | Outer, inner and padding material. |
| Migration | Outer, inner and padding material: migration using sweat or saliva. Oven at 40 ºC for 3 hours. |
| Extraction method | Outer material: Migration fluid extracted using organic solvent; 2x20 ml dichlormethane by agitation in separation funnel. Labels: migration fluid extracted using organic solvent; 2x10 ml dichlormethane by agitation in separation funnel. Internal standard: DEHP-d4. |
| GC/MS instrument | Agilent GC/MS |
| GC parameters | Column: Phenomenex ZB-5 MS, 30 m x 0.5 mm id., 0.25 µm phase film Carrier gas: Helium, constant flow at 1.9 ml/min. Oven settings: 40 ºC for 0.5 min., 20 ºC/min. to 320 ºC for 15 mins. Injection: 280 ºC, splitless |
| Detection threshold | Phthalate analyses of reflectors, labels, straps, etc. of non-textile materials: 10-20 μg/g |
6.3.4.7 HPLC analyses and migration studies for TDI and MDI
Saliva migration was performed in accordance with the methods described in Chapter 6.2 Exposure scenarios of selected jackets and mittens for isocyanates 2.4-TDI, 2.6-TDI and MDI. The migration fluid was then extracted and analysed as described in Table 6.12.
Table 6.12 HPLC analysis of migration fluids for TDI and MDI
| Migration | Sweat migration Oven at 40 ºC for 3 hours. |
| Sample preparation | Derivation reagent 1- (2-Pyridyl)-Piperazine added to a saliva extract and heated at 50 ºC. Evaporated until dry and rehydrated in mobile phase. |
| HPLC instrument | Perkin Elmer HPLC pump, Merck Hitachi auto sampler and fluorescence detector |
| HPLC parameters | Column: Hypersil ENV, 250 mm x 4.6 mm, room temperature Mobile phase: A: 10% Acetonitrile/90% 0.01 ammonium acetate, pH 6, B:90% Acetonitrile/10% 0.01 ammonium acetate, pH 6. Program: Gradient Detector: 240/370 |
| Detection threshold | 0.1 ug/g |
6.3.5 Results of initial analyses
The results of the screening analyses and other preliminary analyses are presented in the sections below.
6.3.5.1 Results of X-ray screening analyses
Table 6.13 and Table 6.14 list the results of X-ray screening analysis of the product surfaces. Results are given in % weight.
Table 6.13 Results of X-ray screening analyses of jackets, % weight
| Product no. | Fluoride, F | Antimony, Sb | Bromide, Br |
| 1-1 | 0.41 | - | - |
| 1-2 | 1.4 | 0.01 | - |
| 1-3 | 0.68 | - | - |
| 1-4 | - | - | - |
| 1-5 | 0.34 | - | - |
| Detection threshold | 0.05 | 0.002 | 0.002 |
-: Below the detection threshold
Table 6.14 Results of X-ray screening analyses of mittens, % weight
| Product no. | Fluoride, F | Antimony, Sb | Bromide, Br |
| 2-1 | 2.0 | - | - |
| 2-2 | 0.18 | 0.02 | 0.066 |
| 2-3 | 1.3 | 0.004 | - |
| 2-4 | 1.1 | - | - |
| 2-5 | 0.68 | - | - |
| Detection threshold | 0.05 | 0.002 | 0.002 |
-: Below the detection threshold
Fluoride was found in all products except nos. 1-4. Further analyses were therefore performed to establish if the fluoride found came from impregnating agents containing fluorotelomers.
The presence of bromide and antimony could indicate that the products were impregnated with flame-retardants. However, the values are so low that they do not support this.
6.3.5.2 Results of GC/MS analyses
The tables below contain the results of the GC/MS analyses
Table 6.15 and Table 6.16 present the results for outer materials on jacket arms. The results are from screening analyses and stated in µg/g. The results are semi-quantitative as the substances are estimated according to internal standards.
Table 6.15 Results for the GC/MS-analysis of jacket outer material, µg/g
Table 6.16 Results for the GC/MS-analysis of jacket outer material, µg/g
| Product no. | |||||
| 1-4 | 1-5 | ||||
| Component | CAS-no. | Outer material | Fleece | Outer material | Fleece |
| Toluene | 108-88-3 | 5 | - | - | - |
| Styrene | 100-42-5 | - | - | - | 12 |
| Isocyanatbenzene or 1H-Benzotriazole |
103-71-9 or 95-14-7 |
- | - | 2 | - |
| 3-Methyl-2-cyclohexene-1-one | 1193-18-6 | - | - | 8 | - |
| 1-Methylnaphthalene | 90-12-0 | - | 11 | - | - |
| 1-Methylnaphthalene isomers | - | 11 | - | - | |
| Benzylmetacrylate | 2495-37-6 | 6 | - | - | - |
| 1.6-Diisocyanatohexane | 822-06-0 | 15 | - | - | - |
| 2.4-Diisocyanato-1-methylbenzene | 584-84-9 | - | - | 85 | - |
| 1.3-Dihydro-5-mrthyl-2H-benzimidazole-2-on or 5-Formyl-2.4-dimethyl-1H-pyrrole-3-carbonitrile | 5400-75-9 or 32487-71-1 | - | - | 4 | - |
| 1.6-Dioxacyclododecan-7.12-dione | 777-95-7 | - | - | 7 | - |
| N-(3-Pyridinyl)benzenesulfon-amide | 53472-19-8 | - | 12 | - | - |
| 5-Methoxycanthine-6-one | 15071-56-4 | 4 | - | 8 | - |
| 2-(2-Hydroxy-5-methylphenyl)benzotriazole (Tinuvin P) or 2-(2H-1,2,3-Benzotriazole-2-yl)-5-methylphenol | 2440-22-4 or 4998-48-5 | - | - | 25 | - |
| Diphenylmethanediisocyanate | 101-68-8 or 26447-40-5 | 330 | - | 410 | - |
| Triphenylphosphate | 115-86-6 | 20 | - | 7 | - |
| 4-Isopropyl-2-pentadecyl-1.3-dioxolane or 4,4,5-Trimethyl-2-pentadecyl-1.3-dioxolane | 56559-35-0 or 56599-79-2 | 70 | - | - | - |
-: Below the detection threshold
Table 6.17 presents results for other jacket textile parts. The results are semi-quantitative since the substances are estimated according to internal standards.
Table 6.17 Results for the GC/MS analysis of other jacket parts, µg/g
Table 6.18 presents results of analyses for phthalates in labels and reflectors from jackets. These components are made of soft polymer materials, deemed to represent a risk of phthalate content. Analyses were performed as single analysis and quantitative content analysis.
Table 6.18 Results for the GC/MS analysis of jacket labels and reflectors*, µg/g
| Product no. | Description | Dibutylphthalate, DBP | Diethylhexylphthalate, DEHP |
| 1-2 | Product name label | - | - |
| 1-4 | Product name label | - | - |
| Strap on zip | 43 | 74 | |
| 1-5 | Loose reflector | 120 | 213000 |
| Product name label (small) | - | - | |
| Product name label (large) | - | - |
-: Below the detection threshold < 10 µg/g *: Analyses were run for the following phthalates: DMP, DEP, DIBP, BBP, DOP, DIDeP and DINP, which were not detected.
Table 6.19 presents the results for mitten outer material. The results are semi-quantitative since the substances are estimated according to internal standards.
Table 6.19 Results for the GC/MS analysis of mitten outer material, µg/g
Table 6.20 presents the results of analysis of Velcro fastener on mittens. The results are semi-quantitative since the substances are estimated according to internal standards.
Table 6.20 Results for the GC/MS analysis of Velcro fasteners on mittens, µg/g
| Product no. | |||||
| Component | CAS no. | 2-1 | 2-2 | 2-3 | 2-5 |
| Toluene | 108-88-3 | - | - | 37 | 28 |
| Styrene | 100-42-5 | 5 | - | - | 11 |
| Xylene | 100-42-5 | - | - | - | 15 |
| 6-Methylheptylacrylate | 54774-91-3 | 24 | - | - | 9 |
| 2.4-Diisocyanatetoluene | 584-84-9 | - | 250 | 18 | - |
| 5-Methylbenzimidazolone or 5-formyl-2.4-dimethyl-pyrrole-3-carbonitrile | 5400-75-9 or 32487-71-1 | - | 7 | 15 | - |
| 4-(Methylenamine)phenyldimethylamine | 147354-14-1 | - | 8 | - | - |
| Methylenbisacrylamide | 110-26-9 | - | - | - | 16 |
| 1.2-Dibromo-4-nitrobenzene or Tridecyl bromide | 5411-50-7 or 765-09-3 | - | - | - | 22 |
| Mono-2-ethylhexyladipate or equiv. | 4337-65-9 | - | - | 14 | - |
| Amide | - | 8 | - | - | |
| Triphenyl phosphite (Stabilizer P 36) | 101-02-0 | - | - | 25 | - |
| Unidentified adipic acid | - | 24 | - | - | |
| o-Toluidine | 95-53-4 | - | - | 19 | - |
| Ester | - | - | 130 | - | |
| Tinuvin (R) 292 | 41556-26-7 | - | - | 62 | - |
| Aliphatic hydrocarbons | 6100 | - | - | 4400 | |
-: Below the detection threshold <1-10 µg/g
Table 6.21 presents the results of analysis for phthalates in mittens. These components are made of soft polymer materials, deemed to represent a risk of phthalate content. Analyses were performed as single analysis and quantitative content analysis.
Table 6.21 Results for the GC/MS analysis of mitten labels and reflectors*, µg/g
| Product no. | Description | Diethylhexyl phthalate, DEHP | Diisononyl phthalate, DINP |
| 2-3 | Product name label | 124000 | 86000 |
| 2-4 | Product name label | 147000 | 78000 |
-: Below the detection threshold < 10 µg/g *: Analyses were run for the following phthalates: DBP, DMP, DEP, DIBP, BBP, DOP and DIDeP, which were not detected.
Analyses of jackets and mittens revealed the presence of a large number of organic compounds.
Phthalates, triphenylphosphate (a softener), o-toluidine (a primary aromatic amine, carcinogen), and a number of isocyanates were found in the outer material and Velcro fastenings of some of the mittens.
Phthalates were found in loose-hanging reflectors and a strap on a jacket zip. Phthalates were also found in labels on the back of mittens made of a non-textile material printed with a product name.
6.3.5.3 Results of analyses for formaldehyde
Table 6.22 and Table 6.23 present the results of spectrophotometer analysis for formaldehyde. Results are given in units of µg/g. The results are quantitative (single analysis) and state the content of free formaldehyde in the product.
Table 6.22 Results for formaldehyde analysis of jackets, individual analyses, µg/g
| Product number | 1-1 | 1-2 | 1-3 | 1-4 | 1-5 |
| Lining in arms and body | 5 | 6 | 5 | 5 | 5 |
| Fibre padding in arms and body | - | 9 | 5 | 5 | 7 |
| Lining in collar and arm cuffs | - | n/r. | n/r. | n/r. | 5 |
-: Below the detection threshold < 2 µg/g * n/r = not relevant.
Table 6.23 Results for formaldehyde analysis of mittens, average of dual analyses, µg/g
| Product number | Test description | Formaldehyde, µg/g |
| 2-1 | Lining, fibre insulation and fibre padding | 6 |
| 2-2 | Lining, fibre insulation, fibre padding, outer material (cuff, inside) | 7 |
| 2-3 | Lining, fibre padding and outer material (cuff, inside) | 11 |
| 2-4 | Lining and outer material (cuff, inside) | 8 |
| 2-5 | Lining, fibre padding and outer material (cuff, inside) | 9 |
-: Below the detection threshold < 2 µg/g
Formaldehyde was found in jackets and mittens.
6.3.5.4 Results of analyses for organotin compounds
Table 6.24 and Table 6.25 present the results of analyses for organotin compounds. Results are given in units of µg/g.
Table 6.24 Results for total tin in jackets, µg/g
| Product no. | |||||
| 1-1 | 1-2 | 1-3 | 1-4 | 1-5 | |
| Outer material | - | - | - | - | 0.+3 |
| Lining/inner material | - | - | - | - | - |
| Padding | - | - | - | - | - |
Below the detection threshold < o.02 µg/g
Table 6.25 Results for total tin in mittens, µg/g
| Product no. | |||||
| 2-1 | 2-2 | 2-3 | 2-4 | 2-5 | |
| Outer material | - | 0,13 | - | - | 0,53 |
| Lining/inner material | - | - | - | - | - |
| Padding | - | - | - | - | - |
-: Below the detection threshold < o.02 µg/g
Tin was found in the outer material of jacket product nos.1-5 and mitten product nos.2-2 and 2-5, which could stem from the content of organotin compounds.
GC/MS analysis for organotin subsequently showed that there were no organotin compounds in the 3 products in which tin had been detected.
6.3.6 Quantitative analyses and migration studies
6.3.6.1 Selection of products and substances
In collaboration with the Danish Environmental Protection Agency, a series of products and substances were selected to undergo further examinations based on screening tests. Selection of products was based on high content of the selected substances, and presentation of cheap and expensive products.
Table 6.26 Overview of products and substances selected for analysis
| Product no. | Description | Components analysed for: | Analyses | Reason |
| 1-1 | Jacket, outer material | FTOH* |
Quantitative + saliva migration: 3 hours | High F at X-ray, fluoride compounds at GC/MS screening. "Cheap" product. |
| 1-2 | Jacket, outer material | FTOH* MDI, TDI DIBP |
Quantitative + saliva migration: 3 hours Saliva-migration: 3 hours Saliva-migration: 3 hours |
High F at X-ray, fluoride compoundsat GC/MS screening. "Expensive" product MDI and TDI content. |
| 1-3 | Jacket, outer material | FTOH* |
Quantitative + saliva migration: 3 hours | High Fat X-ray, fluoride compounds at GC/MS screening. "Expensive" product |
| 1-4 | Jacket, zip strap | DEHP, DBP | Saliva-migration: 3 hours | Located close to mouth. Can only be performed as single analysis. Quantitative result from single analysis available. |
| 1-5 | Jacket, outer material | Organic tin | Saliva migration: 3 hours | Sn detected at screening. |
| 2-1 | Mitten, outer material | FTOH* |
Quantitative + saliva migration: 3 hours | High F at X-ray. "Cheap" product. |
| 2-2 | Mitten, outer material | Organic tin | Saliva migration: 3 hours | Sn detected at screening. |
| 2-2 | Mitten, outer material, palm | Triphenylphosphate. DEHP | Saliva migration: 3 hours | Triphenylphosphate: softener (included in EN 71-9 requirements). |
| 2-2 | Mitten, outer material, back | MDI, TDI | Saliva migration: 3 hours | Highest MDI content. "Cheap" product. |
| 2-3 | Mitten, outer material | FTOH* Diglycidylbisphenol A, o-Toluidine, Triphenyl phosphate. MDI, TDI |
Quantitative + saliva migration: 3 hours Saliva-migration: 3 hours Saliva migration: 3 hours |
High F at X-ray. "Expensive" product o-Toluidine is a primary aromatic amine = Carcinogen = EU ban. Second-highest content of MDI. "Expensive" product |
| 2-3 | Mitten, lining, fibre padding and outer material (cuff, inside) | Formaldehyde | Sweat migration: 3 hours | Highest content of formaldehyde found in jackets and mittens analysed. More skin contact expected in mitten linings than in jackets. Sweat possible in mittens. |
| 2-3 | Mitten label (single analysis only) possible. | DEHP | Saliva migration: 3 hours | Easy to suck. |
| 2-4 | Mitten label (used as "double" analysis for 2-3) | DEHP | Saliva migration: 3 hours | Easy to suck. |
| 2-4 | Mitten, outer material | DEHP | Saliva migration: 3 hours | Easy to suck. |
| 2-5 | Mitten, outer material | Organic tin | Saliva migration: 3 hours | Sn detected at screening. |
*: See list of analysed compounds in Table 6.10. Unfortunately, it was impossible to perform migration with sweat for FTOH due to problems retrieving the substances in the analytic method.
6.3.6.2 Results of quantitative and migration analyses
Results of the examinations are shown in the table below.
Table 6.27. Results of quantitative and migration analyses for phthalates.
| Substance (CAS no.) | Product type + no. | Screening analysis, ug/g | Quantitative analysis, ug/g | Migration analysis, ug/g | Migration period, hours | Migration fluid |
| DIBP (84-69-5) | Jacket 1-2, outer material | 18 | n.a. | 0,04 | 3 | Saliva |
| DBP (84-74-2) | Jacket 1-4, zipper strap | 43 | n.a. | 0,51* | 3 | Saliva |
| DEHP (117-81-7) | Jacket 1-4, zipper strap* | 74 | n.a. | <0,1 | 3 | Saliva |
| Mittens 2-3, label* | n.a. | 124000 | 0,56 | 3 | Saliva | |
| Mittens 2-4, label* | n.a. | 147000 | 0,68 | 3 | Saliva | |
| Mitten 2-4, outer material | n.a. | 417 | <0,01 | 3 | Saliva | |
| Mitten 2-2, outer material | 315 | n.a. | 0,27 | 3 | Saliva | |
| DINP (28553-12-0) | Mittens 2-3, label* | n.a. | 86000 | n.d. | 3 | Saliva |
| Mittens 2-4, label* | n.a. | 78000 | n.d. | 3 | Saliva |
n.a.: Not analysed
n.d.: Not detected by analysis
*: A single analysis was performed due to limited samples.
Table 6.28 Results of quantitative analysis for content of perfluorous compounds
| Test no. | 4:2 FTOH | 6:2 FTOH | 8:2 FTOH | 10:2 FTOH | N-Me-FOSA | N-Et-FOSA | N-Me-FOSE | N-Et-FOSE |
| ng/cm2 | ng/cm2 | ng/cm2 | ng/cm2 | ng/cm2 | ng/cm2 | ng/cm2 | ng/cm2 | |
| Jacket 1-1 | n.d. | 0.02 | n.d. | 0.02 | 0.002 | n.d. | n.d. | n.d. |
| Jacket 1-2 | n.d. | 0.02 | 0.48 | 0.34 | n.d. | n.d. | n.d. | n.d. |
| Jacket 1-3 | n.d. | 0.01 | 1.09 | 0.57 | 0.002 | n.d. | 0.004 | n.d. |
| Mitten 2-1 | n.d. | 0.09 | 2.82 | 1.47 | 0.002 | n.d. | 0.008 | 0.007 |
| Mitten 2-3 | n.d. | 0.14 | 1.54 | 0.97 | 0.002 | n.d. | 0.006 | n.d. |
| Det.gr. | 0.02 | 0.02 | 0.02 | 0.02 | 0.002 | 0.002 | 0.002 | 0.002 |
n.d.: Not detected by analysis
Table 6.29. Results of quantitative and migration analyses for isocyanates.
| Substance (CAS-no.) | Product type + no. | Screening analysis, ug/g | Quantitative analysis, ug/g | Migration analysis, ug/g | Migration period, hours | Migration fluid |
| 2.4-TDI (584-84-9) | jacket no. 1-2 | 194 | n.a. | 0,24 | 3 | Saliva |
| Mitten no. 2-2 | 868 | n.a. | 0,20 | 3 | Saliva | |
| MDI (101-68-8) | Jacket no. 1-2 | 125 | n.a. | <0,1 | 3 | Saliva |
| Mitten no. 2-2 | 2880 | n.a. | <0,1* | 3 | Saliva | |
| Mitten no. 2-3 | 1580 | n.a. | 3,4** | 3 | Saliva |
n.a.: Not analysed
*: No MDI was detected by migration - there could be another isocyante, as GC/MS screening is only based on the NIST library's suggestion
**: Result was a single analysis
2.6-TDI, CAS no. 91-08-7 was not shown in any of the tests.
Table 6.30 presents the results of migration analyses of other organic substances.
| Substance (CAS no.) | Product type + no. | Screening analysis, ug/g | Quantitative analysis, ug/g | Migration analysis, ug/g | Migration length, hours | Migration fluid |
| Triphenylphosphate (115-86-6) | Mitten no. 2-2 | 66 | n.a. | 1.1 | 3 | Saliva |
| Mitten no. 2-3 | 23 | n.a. | 1.1 | 3 | Saliva | |
| Diglycidylbisphenol A (1675-54-3) | Mitten no. 2-3 | 146 | n.a. | 3.2 | 3 | Saliva |
| o-toluidine (95-53-4) | Mitten no. 2-3 | 64 | n.a. | 4.5 | 3 | Saliva |
n.a.: Not analysed
Table 6.31. Results of quantitative and migration analyses for formaldehyde.
| Product type + no. | Quantitative analysis | Migration analysis | Migration period | Migration fluid |
| Mitten no. 2-3 | 11 ug/g | 5 ug/g | 3 hours | Sweat |
GC/MS analysis for organotin showed that there were no organotin compounds in the 3 products in which tin had been detected.
The analyses show that only a small number of the phthalates migrate from the products surveyed under the specified conditions. Formaldehyde, isocyanates, triphenylphosphate, diglycidylbisphenol and o-toluidine did not migrate. All products analysed contained perfluorinated compounds.
6.4 Footwear
Footwear comes under the arnea Good Day: Playing outside. The survey focused on rubber boots and rubber clogs.
6.4.1 Summary of results
In three of the five rubber clogs a quantifiable phthalate content was detected (product nos. 3-1, 3-3 and 3-4). Migration studies on artificial sweat showed that only a fraction of the phthalate content migrated from the products.
Only a few organic substances were found in the rubber boots, and one type of phthalate was found in one of the boots (product no. 4-4). Therefore, no further analyses were performed on these products.
6.4.2 Description of product type
The rubber clogs selected consist of the same material on the outside and inside. They are expected to be worn with socks, but can be used without resulting in skin contact.
Some of the boots consist of the same material on the outside and inside, whilst other products have a thin textile lining on the inside. Children were expected to have most skin contact with the upper edge of the boots analysed.
6.4.3 Selected products
Table 6.32 and Table 6.33 list the products selected for analysis. The reasons for choosing these products are described in the survey.
Table 6.32 Selected products, rubber clogs
| Product no. | Description | Information stated on the packaging or product (direct transcript) |
| 3-1 | Pink rubber clogs, size 23 | Water friendly. Tread on bottom for traction. Back strap for secure fit. EVA material. |
| 3-2 | Pink rubber clogs, removable lining, size 26/27 | |
| 3-3 | Lime-coloured rubber clogs, size 23/24 | - |
| 3-4 | Navy blue rubber clogs, size 23-25 | - |
| 3-5 | Orange rubber clogs, size 26-27 | Very comfortable to walk in, warm in winter, cool in summer, breathable and healthy for the feet, shock absorbant and flexible, easy to clean, bacteria resistant, float on water, sporty design, lightweight |
Table 6.33 Selected products, rubber boots
| Product no. | Description | Information stated on the packaging or product (direct transcript) |
| 4-1 | Black and blue rubber boots, size 24 with small crocodile on side and word "dille”. | Uppers, outer sole, lining of other material. |
| 4-2 | Grey rubber boots with drawings on entire surface. Trees, grass, a river and a castle. Laces at the top. | |
| 4-3 | Army green rubber boot with laces at the top. White stripe at top. Size 24 | - |
| 4-4 | Black/white striped rubber boots with an orange-spotted, horned dinosaur print. Size 24 | Made in China |
| 4-5 | Rubber boots size 23, pink, sole, pink with orange and green spots | - |
6.4.4 Analsyis methods
The following sections describe the screening methods and quantitative analysis methods used. The migration analyses have been carried out as described in Chapter 6.2 and have subsequently been analysed using quantitative analyses. The procedures are described below.
6.4.4.1
X-ray analysis
One of the products selected (product 4-2) had a textile edge at the top. This product was X-ray screened for fluoride to see if it had been impregnated with an agent containing per -or polyfluorous compounds. The analysis method is described in Table 6.34.
Table 6.34 X-ray analysis
| Sampling | Textile band at top of boot |
| Spectrophotometer | ESEM, EDX |
| Detection threshold | 0.1% |
| Analysis margin of uncertainty | 5%* |
*: Depends on concentration range
6.4.4.2 GC/MS analysis, extractable organic substances
A GC/MS analysis is used to test for the presence of extractable organic components. Samples were taken from the top edge of the boots or uppers of the rubber clogs. A single analysis was performed during the initial screening followed by a dual analysis for products selected for quantitative analyses. External standards were applied for calculating quantitative content of selected phthalates.
The analysis method is described in Table 6.35.
Table 6.35 GC/MS method
| Sampling | Rubber boots: Upper edge Rubber clogs: Uppers Sample quantity for extraction: 1.5 g |
| Extraction | Extraction agent: Dichloromethane, 15 ml (boots)/25 ml (clogs). Extraction: Overnight extraction as a minimum, performed at room temperature. Thereafter 1.5 ml of extraction fluid withdrawn, adding 13.5 ml of methanol to precipitate any dissolved polymeric material. |
| Internal standards | Hexachlorobenzene (HCB) and Butylbenzenephthalate (BBP) |
| GC/MS instrument | Varian 3800 GC/MS |
| GC parameters | Column RTX-5sil MS, 30 m x 0.25 mm id., 0.25 µm phase film Carrier gas: Helium, constant flow at 1 ml/min. Oven settings: 80 ºC for 2 min., 20 ºC/min. until 200 ºC, 8 ºC/min. until 320 ºC Injection: 325 ºC, split 20 |
| MS-parameters | Scan mode: 35-650 m/z Solvent delay: 5 min. |
| Detection threshold (estimated) | 100 µg/g |
6.4.4.3 SPME analysis of migrating fluids
A 2.5 g sample (cut into as few pieces as possible and with the surface area estimated) was placed in 50 ml of preheated artificial sweat or saliva with BBP as internal standard and left at 37°C for 0.5-7.75 hours. The liquid phase was decanted from the sample pieces and examined using GC/MS, with solid-phase micro-extraction (SPME) of substances migrated to the liquid phase with 7 µm PDMS-fibre after the addition of 25% w/v NaCl.
6.4.5 Results
The results of the screening analyses are given in the sections below.
6.4.5.1 Results of X-ray analyses
No fluoride traces over 0.1% were found in the textile edge at the top of product 4.2, thus there is no evidence that this product had been impregnated with an agent containing per- or polyfluorous compounds.
6.4.5.2 Results of the GC/MS screening analyses
Table 6.36 and Table 6.37 contain the results of the GC/MS screening analysis. Results are given in units of µg/g. The results are semi-quantitative since the substances are estimated according to internal standards.
Table 6.36 Results of the GC/MS analysis of rubber clogs, µg/g
| Product no. | ||||||
| 3-1 | 3-2 | 3-3 | 3-4 | 3-5 | ||
| Substance name | CAS no. | |||||
| Diisobutylphthalate | 84-69-5 | 3000 | - | - | - | - |
| DEHP | 117-81-7 | 50000 | - | - | 800 | - |
| Dibutyl phthalate | 84-74-2 | - | - | 51000 | - | - |
| Unidentifiable aliphatic hydrocarbons | N/A | - | - | + | - | + |
’-’ = Below the detection threshold
'+' = shown to contain the substance
Table 6.37 Results of the GC/MS analysis of rubber boots, µg/g
| Product no. | |||||||
| 4-1 | 4-2 | 4-2, textile edge | 4-3 | 4-4 | 4-5 | ||
| Substance name | CAS no. | ||||||
| 2.4-bis (1-phenylethyl)-phenol | 2769-94-0 | 1500 | - | - | - | - | - |
| Butylisobutyl phthalate | 17851-53-5 | - | - | - | - | 400 | - |
’-’ = Below the detection threshold
Phthalate was detected in three of the five rubber clogs, (product nos. 3-1, 3-3 and 3-4), and in one of the boots (product 4-4).
6.4.6 Quantitative analyses and migration studies
6.4.6.1 Selection of products and substances
In collaboration with the Danish Environmental Protection Agency, a series of products and substances have been selected to undergo further examinations based on screening tests.
Table 6.38 Overview of selected products and substances
| Product no. | Description | Components analysed for | Analyses | Reason |
| 3-1 | Rubber clogs | DEHP, DIBP | Quantitative sweat migration: 7,75 hours | Used without socks in the summer. Quantitative analyses and migration analyses performed to compare with results in literature. |
| 3-3 | Rubber clogs | DBP | Quantitative sweat migration: 7,75 hours | See product 3-1 |
6.4.6.2 Results of quantitative and migration analyses
Analysis results are shown in Table 6.39.
Table 6.39 Results of quantitative and migration analyses for phthalates
| Substance (CAS no.) | Product type + no. | Screening analysis, ug/g | Quantitative analysis, ug/g | Migration analysis, ug/g | Migration period, hours | Migration fluid |
| DIBP (84-69-5) | 3-1, Clogs | 3000 | 670* (431-901) |
84* (32-136) |
6 | Sweat |
| DBP (84-74-2) | 3-3, Clogs | 51000 | 25603 | 249 | 6 | Sweat |
| DEHP (117-81-7) | 3-1, Clogs | 50000 | 15658 | n.d. | 6 | Sweat |
| 3-3, Clogs | n.d. | 137 | n.d. | 6 | Sweat |
*: Relatively large spread of these results (interval stated in brackets)
i.a.: n.d.: Not detected at analysis
6.5 Pacifiers
Pacifiers come under the arena Good Night: Bed
6.5.1 Summary of results
2.4-bis (1-phenylethyl)phenol was found in the teat of one product, no. 5-3. Siloxane compounds were found in products 5-4 and 5-5, made of silicon rubber.
The coverage of all the pacifiers analysed were made of polycarbonate; they all contained bisphenol A. Phthalates were found in the coverage of product no. 5-1 and 5-3. Migration studies showed that the substances did not migrate to artificial sweat or saliva.
2-mercaptobenzothiazole was not found in the teat of the pacifiers analysed.
6.5.2 Description of product type
A pacifier comprises a teat and a coverage of various shapes and combinations. The coverage can also bear printed decorations. The teat was analysed, along with a pooled sample of coverages.
6.5.3 Selected products
Table 6.40 displays those products selected for analysis. The reason for choosing these products is described in the survey.
Table 6.40 Selected products
| Product no. | Description | Information stated on the packaging or product (direct transcript) |
| 5-1 | Pacifier with red coverage, white knob, blank handle. Drawing of a golden crown on the white knob. Anatomic, 3-36 mths (2) | Non-allergen pacifier. Anatomic |
| 5-2 | Pacifier with blank handle. Blue line drawing of two yellow teddies. Anatomic natural rubber. | Natural rubber pacifier, shatterproof polycarbonate coverage. |
| 5-3 | Blue pacifier, round coverage. Shiny blue with silver hue. Natural rubber (latex), round vent hole, 6 mths.+ | Polycarbonate coverage and ring: Teat made of natural rubber. |
| 5-4 | White pacifier with own name (MST 2-year-olds) engraved | Teat: Natural rubber (latex/silicon). Coverage and ring: Polycarbonate |
| 5-5 | 2 pacifiers with clear pink open coverage. Pink knob on one, white on the other. No ring. Ultra soft silicon. Air anatomic, extra skin-friendly (4m+) |
Anatomic. Extra skin-friendly |
6.5.4 Analysis methods
The following sections describe the screening methods and quantitative analysis methods used. The migration analyses have been carried out as described in Chapter 6.2 and have subsequently been analysed using quantitative analyses. The procedures are described below.
6.5.4.1 FTIR analysis of the material composition
In the case of products 5-1 and 5-5, the material composition was not stated on the product nor on the accompanying packaging. Thus, a FTIR analysis has been performed in order to determine the type of material.
6.5.4.2 GC/MS screening, extractable organic substances
A GC/MS analysis is used to test for the presence of extractable organic components. All pacifiers were scalded with boiling water before analysis as agreed with DEPA, and as instructed on their user instructions (scalding or boiling). A sample was taken from the teat, along with a pooled sample of coverages. A single analysis was performed.
The analysis method is described in Table 6.41.
Table 6.41 GC/MS-screening
| Sampling | 1) Teat 2) Shield /knob (equal parts of each) Sample quantity: 1.5 g |
| Extraction | Extraction agent: Dichlormethane, 15 ml. Extraction: Overnight extraction as a minimum, performed at room temperature. Thereafter 1.5 ml of extraction fluid withdrawn, and 13.5 ml methanol added to precipitate any dissolved polymeric material. |
| Internal standards | BBP, HCB |
| GC/MS instrument | Varian 3800 GC/MS |
| GC parameters | Column RTX-5sil MS, 30 m x 0.25 mm id., 0.25 µm phase film Carrier gas: Helium, constant flow at 1 ml/min. Oven settings: 80ºC for 2 min., 20ºC/min. until 200ºC, 8ºC/min. until 320ºC Injection: 325ºC, split 20 |
| MS parameters | Scan mode: 35-650 m/z Solvent delay: 5 min. |
| Detection threshold (estimated) | 100 µg/g (DINP 500 µg/g) |
6.5.4.3 SPM analysis of migrating fluids
A 2.5 g sample (cut into as few pieces as possible and with the surface area estimated) was placed in 50 ml of preheated artificial sweat or saliva with BBP as internal standard and left at 37°C for 0.5-7.75 hours. The liquid phase was decanted from the sample pieces and examined using GC/MS, with solid-phase micro-extraction (SPME) of substances migrated to the liquid phase with 7 µm PDMS-fibre after the addition of 25% w/v NaCl.
6.5.5 Results
The results of the screening analyses are presented in the sections below.
6.5.5.1 Results of FTIR analyses
The FTIR analyses showed that both the pacifier coverages analysed (5-1 and 5-5) were manufactured from polycarbonate.
6.5.5.2 Results of the GC/MS screening analyses
Table6.42 and Table6.43 present the results of the GC/MS-screening analysis. Results are given in units of µg/g. The results are semi-quantitative as the substances are estimated according to internal standards.
Table 6.42 Results for the GC/MS analysis, teat, µg/g
| Product no. | ||||||
| 5-1 (teat) |
5-2 (teat) |
5-3 (teat) |
5-4 (teat) |
5-5 (teat) | ||
| Substance name | CAS no. | |||||
| 2.4-bis (1-phenylethyl)-phenol | 2769-94-0 | - | - | 4400 | - | - |
| Cyclosiloxane compound (several) | 556-71-8 18772-36-6 |
- | - | - | + | + |
-: Below the detection threshold
+: Shown to contain the substance
2-mercaptobenzothiazole was not found in the teat of the pacifiers analysed.
Table 6.43 Results for the GC/MS analysis, coverage, µg/g
| Product no. | ||||||
| 5-1, (coverage) | 5-2, (coverage) | 5-3, (coverage) | 5-4, (coverage) | 5-5, (coverage) | ||
| Substance name | CAS no. | |||||
| DEHP | 117-81-7 | - | - | 300 | - | - |
| DINP | 28553-12-0 | 500* | - | 1600 | - | - |
| Bisphenol A | 80-05-7 | 1900 | 1700 | 1600 | 1000 | 1000 |
| Tert. Butylphenol | 98-54-4 | 1600 | 1500 | - | 2200 | - |
| 2-(4-(1,1-dimethylethyl)-2-methylphenoxyethanol | 54934-87-1 | 250 | 500 | - | 500 | - |
-: Below the detection threshold
+: Shown to contain the substance *: Result close to the detection threshold.
The coverages of all the pacifiers analysed were made of polycarbonate; they all contained bisphenol A. Phthalates were found in the coverage of two of the products, but in such low concentrations that the phthalates cannot have been added as softeners.
Pacifiers are defined as articles for infants as the product is intended to make it easier for the child to sleep or relax by sucking it. REACH, annex XVII, entry 51 and 52 continued the prohibition to use, import or sell toys and childcare articles containing certain phthalates (including DEHP and DINP) in concentrations above 0.1% expressed per mass of the softened material (equivalent to 1,000 µg/g, i.e. 1,000 ppm). This means that the DINP content in the coverage of pacifier 5-3 is above this limit. It may be that the coverage is not intended to be put in the mouth, but the pacifier can be turned the wrong way accidentally. The DEPA Chemical Inspection Service has considered the case.
6.5.6 Quantitative analyses and migration studies
6.5.6.1 Selection of products and substances
In collaboration with the Danish Environmental Protection Agency, a series of products and substances have been selected to undergo further investigations based on screening tests.
Table 6.44 Overview of selected products and substances
| Product no. | Description | Components analysed for | Analyses | Reason |
| 5-1 | Pacifier, coverage | Bisphenol A, Tert. Butylphenol | Quantitative sweat migration: 7.75 hours Saliva migration: 7.75 hours |
Quantitative analyses and migration analyses performed to compare with results in literature. High contents of bisphenol A and content of phthalates. The child's mouth and hands are in contact. |
| 5-3 | Pacifier, coverage | DEHP, DINP Bisphenol A, Tert. Butylphenol |
Quantitative sweat migration: 7.75 hours Saliva migration: 7.75 hours |
See 5-3. |
6.5.6.2 Results of quantitative and migration analyses
Analysis results are shown in Table 6.45. The results of the screening analyses are single determinations. Unless otherwise specified, the results of the quantitative and migration analyses are averages of dual analyses.
Table 6.45 Results for quantitative and migration analyses for bisphenol A and tert. butylphenol
| Substance (CAS no.) | Product type + no. | Screening analysis, ug/g | Quantitative analysis, ug/g | Migration analysis, ug/g | Migration period, hours | Migration fluid |
| Bisphenol A (80-05-7). | 5-1, Pacifier (coverage) | 1900 | 106 | n.d. | 7,75 | Sweat |
| n.d. | 7,75 | Saliva | ||||
| 5-3, Pacifier (coverage) | 1600 | 280 | 7* | 7,75 | Sweat | |
| n.d. | 7,75 | Saliva | ||||
| Tert. Butylphenol | 5-1, Pacifier (coverage) | 1600 | 1264 | n.d. | 7,75 | Sweat |
| n.d. | 7,75 | Saliva | ||||
| 5-3, Pacifier (coverage) | 1900 | 1003 | n.d. | 7,75 | Sweat | |
| n.d. | 7,75 | Saliva |
*: Only found in one of the samples.
n.d. Signifies that the substance has not been detected.
Table 6.46 Results of quantitative analyses and migration analyses for phthalates.
| Substance (CAS-no.) | Product type + no. | Screening analysis, ug/g | Quantitative analysis, ug/g | Migration analysis, ug/g | Migration period, hours | Migration fluid |
| DEHP (117-81-7) | 5-1, Pacifier (coverage) | n.d. | n.d. | n.d. | 7,75 | Sweat |
| n.d. | 7,75 | Saliva | ||||
| 5-3, Pacifier (coverage) | 300 | 275 | n.d. | 7,75 | Sweat | |
| n.d. | 7,75 | Saliva | ||||
| DINP (28553-12-0) | 5-3, Pacifier (coverage) | 1600 | 1047 | n.d. | 7,75 | Sweat |
n.d. Signifies that the substance has not been detected.
Despite high quantitative levels of phthalates and bisphenol A, the results show that these substances do not migrate with the use of artificial saliva or sweat for the stated number of hours.
6.6 Soap packaging
Soap packaging comes under the arena Good Night: Bath.
6.6.1 Summary of the results
All the soap packaging analysed was made of PVC and large quantities of phthalates were found in all the products analysed. The phthalates found were DEHP, DINP, DNOP and DEP. Migration studies showed that the some of the phthalates migrated to artificial sweat and saliva, whilst the heavier DINP did not.
All the soap packaging analysed contained DEHP, DINP and/or DNOP exceeding the permitted threshold of 0.1% in accordance with the statutory order on phthalates in toys (BEK 855, 2009). The Danish Safety Technology Authority subsequently determined that these products can be considered toys. Sales of these products were therefore stopped.
6.6.2 Description of product type
The products are shaped as colourful figures. They are soft products and focus was placed on the container, which represents the largest surface of the product. The packaging was rinsed thoroughly with water prior to analysis, but allowance has to be made for the contents of the product, e.g. perfume residue, that could affect the analysis results.
6.6.3 Selected products
Table 6.47 presents those products selected for analysis. The reason for choosing these products is described in the survey.
Table 6.47 Selected products
| Product no. | Description | Information stated on the packaging or product (direct transcript) |
| 6-1 | Foam bath with lid shaped as a head | Product Ref. 50381. Information about chemicals, including methylparaben, butylparaben and perfume. Plastic code 3 = PVC |
| 6-2 | Small product – fits in your hand. Colour of soap: blue. | Information about chemicals, including methylparaben, ethylparaben, propylparaben and perfume. |
| 6-3 | Small product – fits in your hand. Approximate length: 8 cm. Colour of soap: orange. | Information about chemicals, including methylparaben, ethylparaben, propylparaben and perfume. |
| 6-4 | Small product, max. 12 cm in length Colour of soap: pink. | |
| 6-5 | Small product – fits in your hand. Maximum length: 8 cm. Colour of soap: red. |
6.6.4 Analysis methods
The following sections describe the screening methods and quantitative analysis methods used. The migration analyses have been carried out as described in Chapter 6.2 and have subsequently been analysed as quantitative analyses. The procedure is described below.
6.6.4.1 FTIR analysis of the material composition
In cases where the material composition is not stated on the product nor on the accompanying packaging (products 6-2, 6-3, 6-4, 6-5), an FTIR analysis has been performed in order to determine the type of material.
6.6.4.2 GC/MS screening, extractable organic substances
A GC/MS analysis is used to test for the presence of extractable organic components. Samples have been taken from the product packaging (6-1: From the lid/head. From the rest a sample was extracted from the packaging, which includes valves). A single analysis was performed.
The analysis method is described in Table 6.48.
Table 6.48 GC/MS screening
| Sampling | 6-1 (head/lid), with the rest: The entire packaging, including the soap valve. Sample quantity: 1.5 g |
| Extraction | Extraction method: Dichloromethane, 15 ml (product 6-1) - 25 ml (other). Extraction: Overnight extraction as a minimum, performed at room temperature. Thereafter 1.5 ml of extraction fluid withdrawn, and 13.5 ml methanol added to precipitate any dissolved polymeric material. |
| Internal standards | BBP, HCB |
| GC/MS-instrument | Varian 3800 GC/MS |
| GC-parameters | Column RTX-5sil MS, 30 m x 0,25 mm id., 0,25 µm phase film Carrier gas: Helium, constant flow at 1 ml/min. Oven settings: 80 ºC for 2 min., 20 ºC/min. until 200 ºC, 8 ºC/min. until 320 ºC Injection: 325 ºC, split 20 |
| MS-parameters | Scan mode: 35-650 m/z Solvent delay: 5 min. |
| Detection threshold (estimated) | 100 µg/g |
6.6.4.3 Quantitative SPME analysis of migrating fluids
A 2.5 g sample (cut into as few pieces as possible and with the surface area estimated) was placed in 50 ml of preheated artificial sweat or saliva with BBP as internal standard and left at 37 oC for 0.5-7.75 hours. The liquid phase was decanted from the sample pieces and examined using GC/MS, with solid-phase micro-extraction (SPME) of substances migrated to the liquid phase with 7 µm PDMS-fibre after the addition of 25% w/v NaCl.
6.6.5 Results
The results of the screening analyses are given in the sections below.
6.6.5.1 Results of FTIR analyses
The FTIR analyses showed that all the examined packagings (6-2, 6-3, 6-4, 6-5) consist of PVC softened with phthalates.
6.6.5.2 Results of the GC/MS-screening analyses
Table 6.49 presents the results of the GC/MS screening analysis Results are given in units of µg/g. The results are semi-quantitative since the substances are estimated according to internal standards.
Table 6.49 Results for the GC/MS analysis of soap packagings, µg/g
| Product no. | ||||||
| 6-1 | 6-2 | 6-3 | 6-4 | 6-5 | ||
| Substance name | CAS no. | |||||
| DEHP | 117-81-7 | - | - | - | 190000 | 200000 |
| DINP | 28553-12-0 | - | - | - | 100000 | 200000 |
| DNOP | 117-84-0 | 120000 | 150000 | 150000 | - | - |
| DEP | 84-66-2 | - | 6000 | 11000 | 300 | 300 |
-: Below the detection threshold
+: Shown to contain the substance
Phthalates were found in all examined soap packagings.
6.6.6 Quantitative analyses and migration studies
6.6.6.1 Selection of products and substances
In collaboration with the Danish Environmental Protection Agency, a series of products and substances have been selected to undergo further investigations based on screening tests.
Table 6.50 Overview of selected products and substances
| Product no. | Description | Components being analysed for | Analyses | Reason |
| 6-1 | Soap packaging | DNOP | Quantitative sweat migration: 0.5 hours | The material is stated to be PVC and is hard compared to the other soap packagings, which are soft. Has been selected to test whether migration is different. |
| 6-2 | Soap packaging | DNOP, DEP | Quantitative sweat migration: 0.5 hours Saliva-migration: 0.5 hours |
6-2 and 6-5 contain various phthalates and were therefore both selected. The products are deemed tempting for a child to play with and suck on. |
| 6-5 | Soap packaging | DEHP, DINP, DEP | Quantitative sweat migration: 0.5 hours Saliva-migration: 0.5 hours |
See product 6-2 |
6.6.6.2 Results of quantitative and migration analyses
Results of the examinations are shown in the table below. The results of the screening analyses are single determinations. Unless otherwise specified, the results from the quantitative and migration analyses are averages of dual analyses.
Table 6.51 Results of quantitative and migration analyses for phthalates.
| Substance (CAS-no.) | Product type + no. | Screening analysis, ug/g | Quantitative analysis, ug/g | Migration analysis, ug/g | Migration period, hours | Migration fluid | ||
| DEHP (117-81-7) | 6-1, Soap packaging | n.d. | 133 | n.d. | 0.5 | Sweat | ||
| 6-2, Soap packaging | n.d. | 206 | n.d. | 0.5 | Sweat | |||
| n.d. | 0.5 | Saliva | ||||||
| 6-5, Soap packaging | 200000 | 80130 | 2 | 0.5 | Sweat | |||
| n.d. | 0.5 | Saliva | ||||||
| DINP (28553-12-0) | 6-5, Soap packaging | 200000 | 87692 | n.d. | 0.5 | Sweat | ||
| n.d. | 0.5 | Saliva | ||||||
| DNOP (117-84-0) | 6-1, Soap packaging | 120000 | 57740 | n.d. | 0.5 | Sweat | ||
| 6-2, Soap packaging | 150000 | 64595 | n.d. | 0.5 | Sweat | |||
| n.d. | 0.5 | Saliva | ||||||
| DEP (84-66-2) | 6-2, Soap packaging | 6000 | 11357 | 34 | 0.5 | Sweat | ||
| 34 | 0.5 | Saliva | ||||||
| 6-5, Soap packaging | 300 | 1092 | 5 | 0.5 | Sweat | |||
| 7 | 0.5 | Saliva | ||||||
n.d. means that the substance was not detected above the detection threshold.
Despite high quantitative levels in these projects, the results show that only a small amount of the phthalate contents migrates under the specified conditions. Results also show that the higher molecular weight phthalates DINP and DNOP are not detected in the migration fluids.
6.7 Non-slip figures and mats
Non-slip figures and mats for bathtubs belong to the arena “Go´nat”: Bath.
6.7.1 Summary of the results
The phthalates DEHP and DINP were detected in three of the products. Migration studies show that DEHP migrates to artificial sweat while DINP is not detected.
6.7.2 Description of product type
Non-slip figures and mats often consist of a smooth or structured surface and an underside with suction capabilities. When the child is sitting on the product, the greatest exposure will be from the top surface. However, when the child plays with the product, it may come into contact with both sides. Both sides of the product have been examined (at the edge).
6.7.3 Selected products
Table 6.52 presents those products selected for analysis. The reason for choosing these products is described in the survey.
Table 6.52 Selected products
| Product no. | Description | Information stated on the packaging or product (direct transcript) |
| 7-1 | White mat with print | PVC |
| 7-2 | Toy figures | 100% TPE |
| 7-3 | Toy figures in various colours | PVC-free |
| 7-4 | Bright green shower mat | PVC |
| 7-5 | White mat |
6.7.4 Analysis methods
The following sections describe the screening methods and quantitative snalysis methods used. The migration analyses have been carried out as described in Chapter 6.2 and have subsequently been analysed using quantitative analyses. The procedures are described below.
6.7.4.1 FTIR analysis of the material composition
In case of products 7-3 and 7-5, the material composition was not stated on the product nor on the accompanying packaging. Thus, an FTIR analysis has been made in order to determine the type of material.
6.7.4.2 GC/MS screening, extractable organic substances
GC/MS is used to examine for organic components. Samples have been extracted from the edge of the mats. Product 7-3 consists of figures of various colours and a sample has been analysed from all three colours. A single analysis was performed.
The analysis method is described in Table 6.53.
Table 6.53 GC/MS-screening
| Sampling | At the edge of the mats. In product 7-3 equal amounts have been sampled (weight wise) from each of the 3 colours. Sample quantity: 1.5 g |
| Extraction | Extraction method: Dichloromethane, 20 ml (product 7-1) - 15 ml (other). Extraction: Overnight extraction as a minimum, performed at room temperature. Thereafter 1.5 ml of extraction fluid withdrawn, and 13.5 ml methanol added to precipitate any dissolved polymeric material. |
| Internal standards | BBP, HCB |
| GC/MS-instrument | Varian 3800 GC/MS |
| GC-parameters | Column RTX-5sil MS, 30 m x 0,25 mm id., 0,25 µm phase film Carrier gas: Helium, constant flow at 1 ml/min. Oven settings: 80 ºC for 2 min., 20 ºC/min. until 200 ºC, 8 ºC/min. until 320 ºC Injection: 325 ºC, split 20 |
| MS-parameters | Scan mode: 35-650 m/z Solvent delay: 5 min. |
| Detection threshold (estimated) | 100 µg/g |
6.7.4.3 SPME analysis of migrating fluids
A 2.5 g sample (cut into as few pieces as possible and with the surface area estimated) was placed in 50 ml of preheated artificial sweat or saliva with BBP as internal standard and left at 37 oC for 0.5-7.75 hours. The liquid phase was decanted from the sample pieces and examined using GC/MS, with solid-phase micro-extraction (SPME) of substances migrated to the liquid phase with 7 µm PDMS-fibre after the addition of 25% w/v NaCl.
6.7.5 Results
The results of the screening analyses are given in the sections below.
6.7.5.1 Results of FTIR analyses
Products 7-3 and 7-5 were analysed using FTIR. The analyses have shown that both products are made from poly(ethylene-propylene).
6.7.5.2 Results of the GC/MS screening analyses
Table 6.54 contains the results of the GC/MS screening analysis Results are given in units of µg/g. The results are semi-quantitative as the substances are estimated according to internal standards.
Table 6.54 Results for the GC/MS analysis, µg/g
| Product no. | ||||||
| 7-1 | 7-2 | 7-3 | 7-4 | 7-5 | ||
| Substance name | CAS-no. | |||||
| DEHP | 117-81-7 | 220000 | - | - | - | - |
| DINP | 28553-12-0 | - | - | - | Large quantities* | - |
| Tributyl Acetylcitrate | 77-90-7 | 10000 | - | - | - | - |
| Phthalic acid, diisooctyl ester | 1330-91-2 | 3100 | - | - | - | - |
| Phthalic acid, 2-methylpropylbutyl ester | 17851-53-5 | - | - | 14000 | - | - |
| Butyl octyl phthalate | 84-78-6 | 200 | ||||
| Non-identifiable hydrocarbons | + | + | + | |||
-: Below the detection threshold +: Shown to contain the substance
*: Dilution necessary for a usable result
6.7.6 Quantitative analyses and migration studies
6.7.6.1 Selection of products and substances
In collaboration with the Environmental Protection Agency, a series of products and substances have been selected to undergo further investigations based on screening tests.
Table 6.55 Overview of selected products and substances
| Product no. | Description | Components analysed for | Analyses | Reason |
| 7-1 | Shower mat | DEHP | Quantitative sweat migration: 0.5 hours | The child sits on the mat |
| 7-4 | Shower mat | DINP | Quantitative sweat migration: 0.5 hours | The child sits on the mat |
6.7.6.2 Results of quantitative and migration analyses
Analysis results are shown in Table 6.56 .
Table 6.56 Results of quantitative and migration analyses for phthalates
| Substance (CAS no.) | Product type + no. | Screening analysis, ug/g | Quantitative analysis, ug/g | Migration analysis, ug/g | Migration period, hours | Migration fluid |
| DEHP (117-81-7) | 7-1, Shower mat | 220000 | 128625 | 25 | 0.5 | Sweat |
| DINP (28553-12-0) | 7-4, Shower mat | 800000 | 146330 | n.d. | 0.5 | Sweat |
n.d.: Not detected
Despite large quantities in these products, results show that only a fraction of the contents of the DEHP phthalate migrates and that the higher molecular weight phthalate DINP is not detected in the migration fluids.
6.8 Soft toys
Soft toys come under the arena Good Night: The bed
6.8.1 Summary of results
Two of the soft toys are designed for heating and they release several fragrances consistent with the constituents of lavender oil, both before and after heating. No fragrances were found in the remaining three products.
No trace of formaldehyde was found during analysis of the selected soft toys.
6.8.2 Description of product type
A soft toy may consist of many parts. For example, the fur, the eyes and the nose may be made from different materials such as textiles and polymers, and it may be equipped with a bowtie or be clothed. It was decided to pool the various materials used in the soft toys. Two of the selected soft toys are designed to be heated in the microwave and both these soft toys give off a lavender scent.
6.8.3 Selected products
Table 6.57 presents those products selected for analysis. The reason for choosing these products is described in the survey.
Table 6.57 Selected products
| Product no. | Description | Information stated on the packaging or product (direct transcript) |
| 8-1 | Soft toy with scent. | Microwavable. Gentle relaxing aroma. Washable outer cover. Toy standard EN71 approved*. CE-marked |
| 8-2 | Small soft toy, approx. 40 cm in length. | Machine washable at 30 degrees C. Produced in China CE-marked |
| 8-3 | Soft toy | 100% polyester both filling and external material. CE-marked |
| 8-4 | Soft toy in a cow outfit. | 100% polyester - both filling and external material. CE-marked |
| 8-5 | Soft toy with scent. | Microwave for two minutes max. Microwave Heating Times: 600-700 watts 150 seconds 800-1000 watts 120 seconds Complies with BS EN71-1/2/3 and ASTM-F963 safety standards. CE-marked |
* The information is misleading since it is not made clear exactly which of the standards the product is analysed against.
6.8.4 Analysis methods
The following sections describe the screening methods and quantitative analyses used. Examination of exposure through inhalation is also conducted.
6.8.4.1 GC/MS screening, extractable organic substances
GC/MS is used to examine for organic components. Samples have been extracted from the surface of the soft toys (equal weight samples of each type of fabric on the soft toys). A single analysis was performed.
The analysis method is described in Table 6.58.
Table 6.58 GC/MS screening
| Sampling | In total 1.5 g, equal amounts of each fabric on the soft toys |
| Extraction | Extraction agent: Dichloromethane 15 ml. Extraction: Overnight extraction as a minimum, performed at room temperature. Thereafter 1.5 ml of extraction fluid withdrawn, and 13.5 ml methanol added to precipitate any dissolved polymeric material. |
| Internal standards | BBP, HCB |
| GC/MS instrument | Varian 3800 GC/MS |
| GC parameters | Column RTX-5sil MS, 30 m x 0.25 mm id., 0.25 µm phase film Carrier gas: Helium, constant flow at 1 ml/min. Oven settings: 80 ºC for 2 min., 20 ºC/min. until 200 ºC, 8 ºC/min. until 320 ºC Injection: 325 ºC, split 20 |
| MS parameters | Scan mode: 35-650 m/z Solvent delay: 5 min. |
| Detection threshold (estimated) | 100 µg/g |
6.8.4.2 GC/MS-screening, headspace analysis
A GC/MS-headspace analysis is used to test for the presence of volatile organic components. The soft toys (the entire soft toy) are placed in a closed chamber (in an exsiccator) and volatile substances are then collected using Radiello-tubes (white diffusive body + cartridge code 130) for 16 hours with and without prior heating of the scented bears in the microwave (8-1 and 8-5 respectively). Microwave heating has been conducted according to the instructions on the soft toys, meaning that soft toy 8-1 (just the inside bag) was heated at 650 watts for 45 seconds. Soft toy 8-5 (the entire bear) was heated at 650 watts for 150 seconds. A single analysis was performed.
The analysis method is described in Table 6.59.
Table 6.59 GC/MS-screening
| GC/MS instrument | Varian 3800 GC/MS |
| GC parameters | Column RTX-5sil MS, 30 m x 0.25 mm id., 0.25 µm phase film Carrier gas: Helium, constant flow at 1 ml/min. Oven settings: 40 ºC for 5 min., 5 ºC/min. until 80 ºC, 20 ºC/min. until 250 ºC Injection: 250 ºC, split 30 |
| MS parameters | Scan mode: 35-650 m/z Solvent delay: 2 min. |
| Detection threshold (estimated) | 1 µg absolute |
6.8.4.3 Spectrophotometric analysis of formaldehyde.
Spectrophotometric analysis was used to identify formaldehyde. The analysis was performed according to Japanese law no. 112 (1973). This determines the content of formaldehyde that is not bound. The result is quantitative and a single analysis was performed from two different places on each soft toy, for instance including ribbons. The analysis method is described in Table 6.60.
Table 6.60 Spectrophotometer analysis
| Sampling | 2.5 g |
| Extraction | Japanese law no. 112 (1973) Extracted at 40°C using 100 ml water in 1 hour. Filtered, with acetyl acetone reagent added and incubated for 30 minutes in a water bath at 40°C. |
| Spectrophotometer | Absorption maximum 412-415 nm |
| Detection threshold | 2 µg/g |
6.8.5 Results
The results of the screening analyses are presented in the sections below.
6.8.5.1 Results of the GC/MS analyses, extractable organic substances
Table 6.61 contains the results of the GC/MS-screening analysis. Results are given in units of µg/g. The results are semi-quantitative since the substances are estimated according to internal standards.
Table 6.61 Results for the GC/MS-analysis, µg/g
| Product no. | ||||||
| 8-1 | 8-2 | 8-3 | 8-4 | 8-5 | ||
| Substance name | CAS no. | |||||
| 1,2-Benzenedicarboxylic acid, 2-methylpropylbutyl ester, |
17851-53-5 | - | 1600 | - | 160 | - |
| Dibutyl phthalate | 84-74-2 | - | - | - | 130 | - |
-: Below the detection threshold
Very few organic substances were detected during analysis of the soft toys.
6.8.5.2 Results of the GC/MS analyses, headspace
Tabel 6.62 contains the results of the GC/MS-screening analysis. The collected substances are comparable to substances found in lavender oil. The results for the total amount of lavender oil are given in
Tabel 6.62. The results are semi-quantitative since the substances are estimated according to internal standards. Tablel 6.63 presents the substances identified using the GC/MS NIST database, but the identification is rather uncertain due to the complex composition of structurally similar compounds found in lavender oil.
Tabel 6.62 Results for GC/MS analysis, ug absolute over 16 hours
| Product no. | ||||||||
| 8-1 | 8-1* | 8-2 | 8-3 | 8-4 | 8-5 | 8-5* | ||
| Collected/degassed total amount | ug | 70 | 4800 | - | - | - | 100 | 11000 |
*: Heated in microwave as instructed on the product
-: Not detected in the product
Tablel 6.63 Resultatd for GC/MS analysis, identified substances at headspace analysis, µg absolute over 16 hours
| Product no. | ||||||||
| 8-1 | 8-1** | 8-2 | 8-3 | 8-4 | 8-5 | 8-5** | ||
| Substance name | CAS no. | |||||||
| Linalool | 78-70-6 | 15 | 650 | - | - | - | 17 | 1580 |
| Linalool acetate | 115-95-7 | 16 | 800 | - | - | - | 15 | 1460 |
| Camphene | 79-92-5 | - | 22 | - | - | - | - | 79 |
| Eucalyptol | 470-82-6 | 24 | 2400 | - | - | - | 48 | 6430 |
| Camphor | 76-22-2 | 8 | 370 | - | - | - | 11 | 630 |
| Linalyl oxide | 5989-33-3 | + | 260 | - | - | - | + | 830 |
| a-Cumylalcohol | 617-94-7 | + | + | - | - | - | + | + |
| Camphol | 507-70-0 | + | + | - | - | - | + | + |
| ß-pinene | 127-91-32 | - | 31 | - | - | - | - | 120 |
| m-cymol | 535-77-3 | - | + | - | - | - | - | + |
| Limonene | 138-86-3 | - | + | - | - | - | - | - |
| Terpineol | 7299-41-4 | - | + | - | - | - | - | + |
| 4-terpineol | 562-74-3 | - | + | - | - | - | - | + |
| Bornyl acetate or isobornylacetate |
76-49-3 125-12-2 |
- | 100 | - | - | - | - | 170 |
| Limonene oxide | 1195-92-2 | - | + | - | - | - | - | + |
| a-pinene | 7785-70-8 | - | + | - | - | - | - | + |
**: Heated in microwave as instructed on the product
+: Detected in the product - : Not detected in the product
Two of the soft toys are designed for heating and these give off several fragrances, both before and after heating. No fragrances were found in the remaining three products.
6.8.5.3 Results of analyses for formaldehyde
Stuffing, bows, laces and pouch (depending on product) were analysed for formaldehyde, which was not detected above the detection threshold of 2 µg/g.
6.8.6 Quantitative analyses and migration studies
Headspace analyses were performed, which correspond to exposure through inhalation. The results can be found in section 6.8.5.2.
It was decided not to select more products and fabrics for further analysis in this product category.
6.9 Diapers
The diapers come under the arena Go´morgen: Clothing, but may come under all arenas if the 2-year-old child wears them for 24 hours a day.
6.9.1 Summary of the results
Screening analyses have been performed on the extractable organic compounds in various parts of the diapers. The analyses showed that most of the organic substances found are aliphatic hydrocarbons and polymers which could not be identified using the applied method.
Five of the organic compounds appear in all the products. These are all additives (antioxidants) which may have been used in the production of the polymers that comprise the diapers.
Limonene, which is a perfume substance, was detected in three of the products.
The analysis showed that three of the analysed diapers contained low levels of formaldehyde. However, these levels were so low that they were close to the detection threshold of this method.
No organotin compounds or rosin were detected in the diapers.
6.9.2 Description of product type
A diaper consists of many parts in close contact with the child’s skin. The filling material which provides suction capability is a large component of the product. The diapers’ upper edge and leg edges are also in close contact with the skin and may be made from a different material than the rest of the diaper in order to give a good fit. On selected diapers there is a strip of adhesive for fitting the diaper. This is not in direct contact with the skin. The screening methods below clarify which parts of the diapers have been analysed.
6.9.3 Selected products
Table 6.64 presents those products selected for analysis. The reason for choosing these products is described in the survey.
Table 6.64 Selected products
| Product no. | Description | Information stated on the packaging or product (direct transcript) |
| 9-1 | Diaper with stretch closure. Print on the front side of diaper. Junior/5 11-25. kg | - Latex free. Contains no lotion or perfume - Contains: Cellulose, bleached without chlorine, polypropylene, polyethylene, polyurethane, synthetic rubber. |
| 9-2 | Trouser diaper, print on the front side of diaper. 13.20 kg | - Anti leak technology - All-round soft fit |
| 9-3 | Diaper with stretch closure. Print on the front and back sides of the diaper. Junior 11-25. kg |
- Non-stop fit - Stretch & Hold - Contains: Petrolatum, stearyl alcohol, paraffinum liquidum, aloe barbadensis extract. |
| 9-4 | Diaper with stretch closure. Print on the front side of diaper. Junior 12-22. kg |
- Perfume and lotion free |
| 9-5 | Diaper with stretch closure. Print on the front side of diaper. |
- 100% free of chlorine - Contains over 50% “renewable resources”. - Compostable packaging. - Dermatologically and clinically tested - Breathable foil 100% biodegradable |
6.9.4 Screening methods
In the following sections, the applied screening methods are explained.
6.9.4.1 GC/MS screening, extractable organic substances
A GC/MS analysis is used to test for the presence of extractable volatile and semi-volatile organic components. Samples have been extracted from the filling material, the elastic/rim around the legs, the waistband and, if present, frontal prints and adhesive strips. A single analysis was performed.
The analysis method is described in Table 6.65.
Table 6.65 GC/MS-screening
| Sampling | Samples were collected from 4-5 different places on the diapers. The samples have been analysed individually. |
| Extraction | Extraction agent: Dichloromethane and acetone (3:1), 20-40 ml. Extraction: 60 min. in ultrasound followed by 60 min. of mechanical shaking |
| Internal standards | DEHP-d4, Pyrene-d10, Naphthalene-d8. |
| GC/MS instrument | Agilent GC/MS |
| GC parameters | Column Phenomenex ZB-5 MS, 30 m x 0.5 mm id., 0.25 µm phase film Carrier gas: Helium, constant flow at 1.9 ml/min. Oven settings: 40 ºC for 0.5 min., 20 ºC/min. to 320 ºC for 15 mins. Injection: 280 ºC, splitless |
| MS parameters | Scan mode: 29-550 m/z Solvent delay: 3 min. |
| Detection threshold | 1 µg/g |
6.9.4.2 GC/MS analysis, derivatised from rosin
5 ml of the extract from the GC/MS analysis was reduced to dryness after which 2 ml of BF3 in methanol was added. See Table 6.65 After heating, the sample was cooled and water plus hexane were added. The hexane phase was analysed using GC/MS using the same method as that for screening. Two samples were taken from each diaper, one from the filling and one from the inside lining. The detection threshold is estimated to be 1-2 µg/g.
6.9.4.3 Spectrophotometer analysis of formaldehyde.
A spectrophotometric analysis was employed for the identification of formaldehyde. The analysis was performed according to Japanese law no. 112 (1973). This determines the content of formaldehyde that is not fixed. The result is quantitative and a single analysis was performed. The analysis method is described in Table 6.66.
Table 6.66 Spectrophotometer analysis
| Sampling | 2.5 g |
| Extraction | Japanese law no. 112 (1973) Extracted at 40 °C using 100 ml water in 1 hour. Filter, add acetylacetone reagent and leave for 30 minutes in a water bath at 40 °C. |
| Spectrophotometer | Absorption maximum 412-415 nm |
| Detection threshold | 2 µg/g |
6.9.4.4 ICP-MS for organotin compounds
The products were analysed for organotin compounds using migration to artificial sweat. The sweat was then ICP-MS analysed to screen for tin content. A positive finding meant that a GC/MS analysis was performed to identify and quantify the organotin compounds. A single analysis was performed.
The analysis method is described in table 6.67.
Table 6.67 ICP/MS-analysis
| Sampling | 2.5 g of filling material and elastic rim around legs |
| Extraction | Extraction agent: Artificial sweat at 40 ºC and concentrated nitric acid 0.14 M added. Extraction volume: 100 ml for padding and 50 ml interfacing/elastic |
| ICP-MS equipment | ion 118 and 120 |
| Internal standard | Rh |
| Detection threshold | 0.03 µg/g for filling material and02 µg/g for elastic rim |
6.9.5 Results
The results of the screening analyses are given in the sections below.
6.9.5.1 Results of GC/MS analyses
Several different parts of the diapers were analysed. Filling material, elastic leg rims, stretch closures, inner lining and imprints were all analysed.
GC/MS-analyses showed that most of the organic substances found are aliphatic hydrocarbons and polymers which could not be identified using the applied method.
Analysing the filling material of the diapers revealed no other organic substances in addition to those mentioned - except for Irganox 245 (an additive - antioxidant) found in product no. 9-2, see Table 6.68. The result is given in units of µg/g. The result is semi-quantitative since the substance is estimated according to an internal standard.
Table 6.68 Results for GC/MS-Analysis, filling material in diapers, µg/g
| Substance name | CAS no. | Product no. | ||||
| 9-1 | 9-2 | 9-3 | 9-4 | 9-5 | ||
| Irganox 245 | 36443-68-2 | - | 160 | - | - | - |
-: Below the detection threshold
Table 6.69 contains an overview of the organic substances found in other parts of the diaper. The organic substances are not from the filling material, but from the waistband, the elastic, the stretch closures, the inner lining and the frontal print.
Table 6.69 Results of screening for extractable organic substances
| Name | CAS no. | Product no. | ||||
| 9-1 | 9-2 | 9-3 | 9-4 | 9-5 | ||
| Limonene | 138-86-3 | + | + | + | ||
| 3.6-Dimethyl-1.4-dioxan-2.5-dione | 95-96-5 | + | ||||
| Caprolactam | 105-60-2 | + | + | |||
| 2.4-bis (1,1-dimethylethyl)-phenol | 96-76-4 | + | + | + | + | + |
| Butylhydroxytoluene (BHT) | 128-37-0 | + | + | + | + | + |
| 1-Octadecanol | 112-92-5 | + | ||||
| Unknown ester | N/A | + | ||||
| 2-methylpropyl hexadecanoic acid ester | 110-34-9 | + | ||||
| 2-methylpropyl octadecanoic acid ester | 646-13-9 | + | + | |||
| Octadecyl oleate | 17673-49-3 | + | ||||
| 13-Docosenamide | 112-84-5 | + | ||||
| Naugard 524 /Irgafos 168 | 31570-04-4 | + | + | + | + | + |
| Unknown phthalate with large alkyl groups | N/A | + | ||||
| Oxidated Irgafos 168 (phosphite to phosphate) | N/A | + | + | + | + | + |
| Irganox 1076 | 2082-79-3 | + | + | + | + | + |
+: Detected in the product N/A: Not available
The results of the GC/MS analyses are presented below, grouped by the part of the diaper that was analysed. Results are given in units of µg/g. The results are semi-quantitative as the substances were calculated using internal standards for hydrocarbons C10-C24.
Tabel 6.70 Results for the GC/MS-analysis, inner waist lining, µg/g
| Name | CAS no. | Product no. | ||||
| 9-1 | 9-2 | 9-3 | 9-4 | 9-5 | ||
| Limonene | 138-86-3 | - | - | - | - | 33 |
| 3.6-Dimethyl-1.4-dioxan-2.5-dion | 95-96-5 | - | - | - | - | 220 |
| Butylhydroxytoluene (BHT) | 128-37-0 | 18 | 7 | 8 | - | 10 |
| Naugard 524 /Irgafos 168 | 31570-04-4 | 430 | 890 | 550 | 380 | 220 |
| Unknown phthalate with large alkyl groups | N/A | - | - | - | - | 100 |
| Oxidated Irgafos 168 (phosphite to phosphate) | N/A | 98 | 61 | 67 | 180 | 41 |
| Irganox 1076 | 2082-79-3 | 92 | - | 55 | 50 | - |
-: Below the detection threshold N/A: Not available
Table 6.71 Results for the GC/MS-analysis, elastic rim*, µg/g
| Name | CAS no. | Product no. | ||||
| 9-1 | 9-2 | 9-3 | 9-4 | 9-5 | ||
| Limonene | 138-86-3 | - | - | - | - | 140 |
| 3.6-dimethyl-1.4-dioxane-2.5-dione | 95-96-5 | - | - | - | - | 160 |
| 2.4-bis (1,1-dimethylethyl)-phenol | 96-76-4 | 14 | 14 | 8 | 7 | 6 |
| Butylhydroxytoluene (BHT) | 128-37-0 | 100 | 9 | 11 | 8 | 8 |
| 1-Octadecanol | 112-92-5 | - | - | 4800 | - | - |
| Naugard 524 /Irgafos 168 | 31570-04-4 | 480 | 1200 | 550 | 560 | 260 |
| Unknown phthalate with large alkyl groups | N/A | - | - | - | - | 170 |
| Oxidated Irgafos 168 (phosphite to phosphate) | N/A | 200 | 180 | 240 | 150 | 130 |
| Irganox 1076 | 2082-79-3 | 180 | - | 280 | 76 | - |
-: Below the detection threshold N/A: Not available
*: The sample was extracted near the legs in products 9-1, 9-3, 9-4 and 9-5. The sample from product no. 9-2 was extracted at the inner lining, since it is a trouser diaper with elastic bands both around the waist and legs.
Table 6.72 Results for the GC/MS-analysis, stretch closures*, µg/g
| Name | CAS no. | Product no. | |||
| 9-1 | 9-3 | 9-4 | 9-5 | ||
| Limonene | 138-86-3 | - | 42 | 60 | 210 |
| 2.4-bis (1,1-dimethylethyl)-phenol | 96-76-4 | 19 | 11 | 10 | 25 |
| Butylhydroxytoluene (BHT) | 128-37-0 | 29 | 9 | 10 | 41 |
| 13-Docosenamide | 112-84-5 | - | - | 82 | - |
| Naugard 524 /Irgafos 168 | 31570-04-4 | 1000 | 300 | 210 | 830 |
| Oxidated Irgafos 168 (phosphite to phosphate) | N/A | 180 | - | 89 | 100 |
| Irganox 1076 | 2082-79-3 | - | 500 | 480 | 62 |
-: Below the detection threshold N/A: Not available Product 9-2 is a trouser diaper which means that there are no stretch closures to analyse.
Table 6.73 Results for the GC/MS-analysis, frontal print, µg/g
| Name | CAS no. | Product no. | ||||
| 9-1 | 9-2 | 9-3 | 9-4 | 9-5 | ||
| Limonene | 138-86-3 | - | - | - | 41 | 92 |
| Caprolactam | 105-60-2 | - | - | - | 610 | 240 |
| 2.4-bis (1,1-dimethylethyl)-phenol | 96-76-4 | - | 8 | 8 | 7 | - |
| Butylhydroxytoluene (BHT) | 128-37-0 | 25 | 7 | 10 | 6 | - |
| Unknown ester | N/A | - | - | - | 1200 | |
| 2-methylpropyl hexadecanoic acid ester | 110-34-9 | - | - | - | 210 | - |
| 2-methylpropyl octadecanoic acid ester | 646-13-9 | - | - | - | 560 | 1200 |
| Octadecyl oleate | 17673-49-3 | - | - | - | 210 | - |
| Naugard 524 /Irgafos 168 | 31570-04-4 | 130 | 960 | 430 | - | 390 |
| Oxidated Irgafos 168 (phosphite to phosphate) | N/A | 81 | 160 | 140 | - | - |
| Irganox 1076 | 2082-79-3 | 110 | 150 | - | - | |
-: Below the detection threshold N/A: Not available
Five of the organic substances such as Irgafos 168 and BHT are present in all products. These substances are additives (antioxidants) which may have been used in the production of the polymers that are used in the diapers.
In three of the products the fragrance limonene was detected, although not in the filling material used for most of the diaper.
6.9.5.2 Results of analyses for rosin
An analysis was performed for rosin, which is sometimes used as an adhesive in paper products. No rosin was detected above the 2 µg/g detection threshold in the filling material of the diaper or in the waistband.
6.9.5.3 Results of analyses for formaldehyde
Table 6.74 presents the results of the spectrophotometric analysis for formaldehyde. Results are given in units of µg/g. The results are quantitative (single analysis) and state the content of free formaldehyde in the product. It was not possible to finish the analysis for the filling material in the diapers.
Tabel 6.74 Results for spectrophotometric analyses, formaldehyde, µg/g
| Product no. | |||||
| 9-1 | 9-2 | 9-3 | 9-4 | 9-5 | |
| Outer lining with print and inner lining | 4 | - | - | 4 | 2 |
| Top rim, tape, flaps and elastic waistband | - | n/r. | - | - | - |
| Top rim by stomach and elastic rim by legs (inside) | - | n/r. | - | - | - |
| Elastic rim by stomach and legs | n/r. | - | n/r. | n/r. | n/r. |
-: Below the detection threshold < 2 µg/g. n/r: Not relevant. Depending on whether it is a trouser diaper.
The diaper analyses showed that three diapers contained low levels of formaldehyde. However, these levels were so low they were close to the detection threshold of this method.
6.9.5.4 Results of analyses for organotin compounds
The diapers were analysed for organotin compunds by screening for tin. No tin was detected above the detection threshold (0.02-0.03 µg/g) in the diaper’s filling material, nor in the elastic bands near the legs.
6.9.6 Quantitative analyses and migration studies
In collaboration with the Danish Environmental Protection Agency, it was decided not to select any more products and fabrics for further analysis in this product category.
6.10 Bed linen
Bed linen comes under the arena Good Night: The bed
6.10.1 Summary of results
A large number of organic compounds have been detected in the examined bed linens; some will disappear after washing while others will remain detectable.
A number of substances suspected to be a health risk were detected in products no. 12-3 and 12-4, and which are subject to the requirements in the Eco-Tex Standard 100, such as dichlorobenzene, o-toluidine, aniline and dichloroanilines. The highest concentrations of organic substances were found in product no. 12-4.
At analysis of the bed linen, formaldehyde was detected in 3 types of bed linen. Contents decrease after washing. Product no. 12-4 has the highest detected levels both before and after washing.
6.10.2 Description of product type
One set of bed linen consists of a main pillowcase and a duvet cover. In this product, the sole focus has been on the duvet cover. All of the selected products are patterned, and the analyses have attempted to sample from as many of the colours as possible.
6.10.3 Selected products
Table 6.75 presents those products selected for analysis. The reason for choosing these products is described in the survey.
Table 6.75 Selected products
| Product no. | Description | Information stated on the packaging or product (direct transcript) |
| 12-1 | Printed teal stripes, floral vine and picture of a prince on a white fabric | - 2 piece bed linen - Duvet case: 70x100 cm - Pillow case: 40x45 cm - Material. 100% cotton Washed at 60 °C |
| 12-2 | Lots of colours, dominant ones being red and black | - 100% cotton - 100x140 cm duvet case, 40x45 cm pillow case Washed at 60 °C |
| 12-3 | Large and small numbers of various colours printed on white material | Bed sheet: 140x240 cm Duvet case: 150x200 cm Pillow case: 50x60 cm Material: 100% cotton Shrinkage 4% Washed at 60 °C |
| 12-4 | Red print on orange fabric | Style: 82-007 Colour: 05 Size: Junior |
| 12-5 | Bright gray-ish green and red/orange brown symmetrical pattern printed on white fabric | Material: 100% organic cotton, certified according to international SKAL-standards. GOTS-certified. Eco-sustainable licensed textiles. Eco-tex colour standards. PVC and phthalate free packaging Washed at 60 °C |
6.10.4 Washing procedure
All bed linens were analysed both before and after washing. Each set of bed linen was washed separately according to the instructions provided on the packing material or on the product, 60°C or 30°C, respectively. A standard washing procedure was performed in a washing machine of the brand Wascator, using a standard ECE-detergent without added perborate. No bulking agent was used and thus no standard wash fabric filling. “Blind-sample” washing was performed at 60°C, in which a 1 m cotton standardized fabric of full width (zig-zag cut at the ends) was washed by itself with ECE detergent. Both the blinded sample and the bed linen were then hung-dried.
6.10.5 Analysis methods
The following sections explain the screening methods and quantitative analysis methods used. The migration analyses have been carried out as described in Chapter 6.2 and have subsequently been analysed as quantitative analyses. The procedures are described below.
6.10.5.1 GC/MS screening, extractable organic substances
A GC/MS analysis is used to test for the presence of extractable volatile and semi-volatile organic components. Sampling of the bed linen was conducted in such a way that as many colours as possible were represented in the samples.
The analysis method is described in Table 6.76.
Table 6.76 GC/MS-screening
| Sampling | Between 1.0 – 1.3 grams extracted before and after washing |
| Extraction method | ASE with acetone Dichloromethane was added to selected samples due to unsolved substances |
| Internal standards | Pyrene-d10 |
| GC/MS instrument | Agilent GC/MS |
| GC parameters | Column Phenomenex ZB-5 MS, 30 m x 0.5 mm id., 0.25 µm phase film Carrier gas: Helium, constant flow at 1.9 ml/min. Oven settings: 40 ºC for 0.5 min., 20 ºC/min. to 320 ºC for 15 mins. Injection: 280 ºC, splitless |
| MS parameters | Scan mode: 29-550 m/z Solvent delay: 3 min. |
| Detection threshold | 10 µg/g |
6.10.5.2 Spectrophotometric analysis of formaldehyde
Spectrophotometric analysis was used to identify formaldehyde. The analysis was performed according to Japanese law no. 112 (1973) – this is an accredited method. This determines the content of formaldehyde, which is not fixed. The result is quantitative and dual analyses were performed. The analysis method is described in Table 6.77.
Table 6.77 Spectrophotometer analysis
| Sampling | 2.5 g |
| Extraction | Japanese law no. 112 (1973) Extracted at 40 °C using 100 ml water in 1 hour. Filter, add acetyl acetone reagent and 30 minutes in a water bath at 40 °C. |
| Spectrophotometer | Absorption maximum 412-415 nm |
| Detection threshold | 2 µg/g |
6.10.6 Results
The results of the screening analyses are given in the sections below.
6.10.6.1 Results of GC/MS analyses
Table 6.78 presents the results of the GC/MS analysis. The results are given in µg/g and are semi-quantitative since the substances are estimated according to internal standards.
Table 6.78 Results for the GC/MS-analyse, µg/g – before and after washing
A large number of organic compounds have been detected in the surveyed bed linens; some disappear on washing. A few substances appear in larger quantities after washing. The reason for this is that interfering substances made it impossible to identify those substances before washing. Some of these interfering substances are removed in the wash, resulting in better identification and quantification of other substances (semi quantitatively).
A number of substances were found in products no 12-3 and 12-4, including arylamines such as aniline, o-toluidine, dichloroanilines and dichlorobenzenes, which are regulated through the Eco-Tex Standard 100 (Eko-Tex Standard 100, 2009). The arylamines may be the decomposed products from an azo colouring agent and the dichlorobenzenes may result from chemicals used to aid fabric colouring. The highest concentrations of organic substances were found in product no. 12-4.
6.10.6.2 Results of analyses for formaldehyde
Tabel 6.79 presents the results of the spectrophotometric analysis for formaldehyde. Results are given in units of µg/g. The results are quantitative (average of dual analyses) and state the content of free formaldehyde in the product.
Tabel 6.79 Results for spectrophotometric analyses, formaldehyde, µg/g
| Product number | 12-1 | 12-2 | 12-3 | 12-4 | 12-5 |
| Before washing | - | 16 | 7 | 182 | - |
| After washing | - | 4 | 3 | 34 | - |
“-“ : Below the detection threshold < 2 µg/g.
Formaldehyde has been detected in 3 of the products both before and after washing.
6.10.7 Quantitative analyses and migration studies
6.10.7.1 Selection of products and substances
A series of products and substances have been selected to undergo further examinations based on screening tests.
Table 6.80 Overview of selected products and substances
| Product no. | Description | Components analysed for | Analyses | Reason |
| 12-4 | Bed linen, before washing | Formaldehyde | Sweat migration: 16 hours | A quantitative result is found by extraction in water, 1 hour, 40 degrees. The child sleeps during the day and night. |
| 12-4 | Bed linen, after washing | Formaldehyde | Sweat migration: 10 hours | In order to calculate exposure with and without washing |
The set of bed linen containing the highest levels of formaldehyde during screening studies was selected for further analysis.
6.10.7.2 Results of quantitative and migration analyses
Results of the investigations are shown in the table below.
Table 6.81. Results of quantitative analyses and migration analyses for formaldehyde.
| Product type + no. | Quantitative analysis | Migration analysis | Migration period | Migration fluid |
| Bed linen no. 12-4 before washing | 182 ug/g | 307 ug/g | 10 hours | Sweat |
| Bed linen no. 12-4 after washing | 34 ug/g | 121 ug/g | 10 hours | Sweat |
A larger content of formaldehyde has been found following the migration analysis compared to the quantitative analysis using a standardized method for the detection of formaldehyde in fabric. The quantitative analysis is performed followed by 1 hour extraction with water, whereas the migration analysis is performed for 10 hours with artificial sweat, which is a watery fluid containing salts. It would therefore appear that the applied standardized method does not determine the total amount of formaldehyde present in a given product. The standardized method determines the amount of free formaldehyde, and it is possible that the artificial sweat releases more formaldehyde due to its composition, or due to the prolonged liquid exposure.
6.11 Overview of quantitative analyses and migration analyses
The results of the quantitative analyses and the migration studies are found in the chapters pertaining to the specific products. The most important results are summarized in Table 6.82.
Table 6.82. Analytical results of quantitative analyses and migration analyses
| Substance (CAS-no.) | Product type + no. | Screening analysis, ug/g | Quantitative analysis, ug/g | Migration analysis, ug/g | Migration period, hours | Migration fluid |
| Formaldehyde | Mitten no. 2-3 | n.s. | 11 | 5 | 3 | Sweat |
| Bed linen no. 12-3 before washing | n.s. | 16 | n.a. | n.a. | n.a. | |
| Bed linen no. 12-3 after washing | n.s. | 4 | n.a. | n.a. | n.a. | |
| Bed linen no. 12-4 before washing | n.s. | 7 | n.a. | n.a. | n.a. | |
| Bed linen no. 12-4 after washing | n.s. | 3 | n.a. | n.a. | n.a. | |
| Bed linen no. 12-4 before washing | n.s. | 182 | 307 | 10 | Sweat | |
| Bed linen no. 12-4 after washing | n.s. | 34 | 121 | 10 | Sweat | |
| Jacket no. 1-1 | n.s. | 5 | n.a. | n.a. | n.a. | |
| Jacket no. 1-2 | n.s. | 6 | n.a. | n.a. | n.a. | |
| Jacket no. 1-3 | n.s. | 5 | n.a. | n.a. | n.a. | |
| Jacket no. 1-4 | n.s. | 5 | n.a. | n.a. | n.a. | |
| Jacket no. 1-5 | n.s. | 5 | n.a. | n.a. | n.a. | |
| Mitten no. 2-1 | n.s. | 6 | n.a. | n.a. | n.a. | |
| Mitten no. 2-2 | n.s. | 7 | n.a. | n.a. | n.a. | |
| Mitten no. 2-3 | n.s. | 11 | 5 | 3 | Sweat | |
| Mitten no. 2-4 | n.s. | 8 | n.a. | n.a. | n.a. | |
| Mitten no. 2-5 | n.s. | 9 | n.a. | n.a. | n.a. | |
| DIBP (84-69-5) | jacket no. 1-2, outer material | 18 | n.a. | 0,04 | 3 | Saliva |
| Clog no. 3-1 | 3000 | 670 | 84 | 6 | Sweat | |
| DBP (84-74-2) | Jacket no. 1-4, zipper strap | 43 | n.a. | 0,51 | 3 | Saliva |
| Jacket no. 1-5, loose reflector piece | n.s. | 120 | n.a. | n.a. | n.a. | |
| Clog no. 3-3 | 51000 | 25603 | 249 | 6 | Sweat | |
| DEHP (117-81-7) | Jacket no. 1-4, zipper strap | 74 | n.a. | <0.1 | 3 | Saliva |
| Jacket no. 1-5, loose reflector piece | n.s. | 213000 | n.a. | n.a. | n.a. | |
| Mittens no. 2-3, label* | n.s. | 124000 | 0.56 | 3 | Saliva | |
| Mittens no. 2-4, label* | n.s. | 147000 | 0.68 | 3 | Saliva | |
| mitten no. 2-4, outer material | n.s. | 417 | < 0,01 | 3 | Saliva | |
| Mitten no. 2-2, outer material | 320 | n.a. | 0.27 | 3 | Saliva | |
| Clog no. 3-1 | 50000 | 15658 | n.d. | 6 | Sweat | |
| Clog no. 3-3 | n.d. | 137 | n.d. | 6 | Sweat | |
| Pacifier (coverage) nr. 5-3 | 300 | 275 | n.d. | 7.75 | Sweat | |
| n.d. | 7.75 | Saliva | ||||
| Soap packaging no. 6-1 | n.d. | 133 | n.d. | 0.5 | Sweat | |
| Soap packaging no. 6-2 | n.d. | 206 | n.d. | 0.5 | Sweat | |
| n.d. | 0.5 | Saliva | ||||
| Soap packaging no. 6-5 | 200000 | 80130 | 2 | 0.5 | Sweat | |
| n.d. | 0.5 | Saliva | ||||
| Shower mat no. 7-1 | 220000 | 128625 | 25 | 0.5 | Sweat | |
| DINP (28553-12-0) | Mittens no. 2-3, label* | n.s. | 86000 | n.d. | 3 | Saliva |
| Mittens no. 2-4, label* | n.s. | 78000 | n.d. | 3 | Saliva | |
| Pacifier no. 5-3 (coverage) | 1600 | 1047 | n.d. | 7.75 | Sweat | |
| n.d. | 7.75 | Saliva | ||||
| Soap packaging no. 6-5 | 200000 | 87692 | n.d. | 0.5 | Sweat | |
| n.d. | 0.5 | Saliva | ||||
| Shower mat no. 7-4 | 800000 | 146330 | n.d. | 0.5 | Sweat | |
| DNOP (117-84-0) | Soap packaging no. 6-1 | 120000 | 57740 | n.d. | 0.5 | Sweat |
| Soap packaging no. 6-2 | 150000 | 64595 | n.d. | 0.5 | Sweat | |
| n.d. | 0.5 | Saliva | ||||
| DEP (84-66-2) | Soap packaging no. 6-2 | 6000 | 11357 | 34 | 0.5 | Sweat |
| 34 | 0.5 | Saliva | ||||
| Soap packaging no. 6-5 | 300 | 1092 | 5 | 0.5 | Sweat | |
| 7 | 0.5 | Saliva | ||||
| 2.4-TDI (584-84-9) | Jacket no. 1-2 | 190 | n.a. | 0,24 | 3 | Saliva |
| Mitten no. 2-2 | 870 | n.a. | 0,20 | 3 | Saliva | |
| MDI (101-68-8) | Jacket no. 1-2 | 130 | n.a. | n.d. | 3 | Saliva |
| Mitten no. 2-2 | 2900 | n.a. | n.d. | 3 | Saliva | |
| Mitten no. 2-3 | 1600 | n.a. | 3,4 | 3 | Saliva | |
| Bisphenol A (80-05-7). | Pacifier (coverage) nr. 5-1 | 1900 | 106 | n.d. | 7.75 | Sweat |
| n.d. | 7.75 | Saliva | ||||
| Pacifier (coverage) nr. 5-3 | 1600 | 280 | 7 | 7.75 | Sweat | |
| n.d. | 7.75 | Saliva | ||||
| Tert. Butylphenol (98-54-4) | Pacifier (coverage) nr. 5-1 | 1600 | 1264 | n.d. | 7.75 | Sweat |
| n.d. | 7.75 | Saliva | ||||
| Pacifier (coverage) nr. 5-3 | 1900 | 1003 | n.d. | 7.75 | Sweat | |
| n.d. | 7.75 | Saliva | ||||
| Triphenylphosphate (115-86-6) | Mitten no. 2-2 | 66 | n.a. | 1.1 | 3 | Saliva |
| Mitten no. 2-3 | 23 | n.a. | 1.1 | 3 | Saliva | |
| Diglycidylbisphenol A (1675-54-3) | Mitten no. 2-3 | 150 | n.a. | 3.2 | 3 | Saliva |
| o-toluidine (95-53-4) | Mitten no. 2-3 | 64 | n.a. | 4,5 | 3 | Saliva |
| 6:2 FTOH (647-42-7) | Jacket 1-1 | 0.41 % by weight F | 0.02 | n.p. | 3 | Saliva |
| Jacket 1-2 | 1.4 % by weight F | 0.02 | n.p. | 3 | Saliva | |
| Jacket 1-3 | 0.68 % by weight F | 0.01 | n.p. | 3 | Saliva | |
| Mitten 2-1 | 2 % by weight F | 0.09 | n.p. | 3 | Saliva | |
| Mitten 2-3 | 1,3 % by weight F | 0.14 | n.p. | 3 | Saliva | |
| 8:2 FTOH (678-39-7) | Jacket 1-2 | 1.4 % by weight F | 0.48 | n.p. | 3 | Saliva |
| Jacket 1-3 | 0.68 % by weight F | 1.09 | n.p. | 3 | Saliva | |
| Mitten 2-1 | 2 % by weight F | 2.82 | n.p. | 3 | Saliva | |
| Mitten 2-3 | 1,3 % by weight F | 1.54 | n.p. | 3 | Saliva | |
| 10:2 FTOH (865-86-1) | Jacket 1-1 | 0.41 % by weight F | 0.02 | n.p. | 3 | Saliva |
| Jacket 1-2 | 1.4 % by weight F | 0.34 | n.p. | 3 | Saliva | |
| Jacket 1-3 | 0.68 % by weight F | 0.57 | n.p. | 3 | Saliva | |
| Mitten 2-1 | 2 % by weight F | 1.47 | n.p. | 3 | Saliva | |
| Mitten 2-3 | 1,3 % by weight F | 0.97 | n.p. | 3 | Saliva | |
| N-Me-FOSA | Jacket 1-1 | 0.41 % by weight F | 0.002 | n.p. | 3 | Saliva |
| Jacket 1-3 | 0.68 % by weight F | 0.002 | n.p. | 3 | Saliva | |
| Mitten 2-1 | 2 % by weight F | 0.002 | n.p. | 3 | Saliva | |
| Mitten 2-3 | 1,3 % by weight F | 0.002 | n.p. | 3 | Saliva | |
| Me-FOSE | Jacket 1-3 | 0.68 % by weight F | 0.004 | n.p. | 3 | Saliva |
| Mitten 2-1 | 2 % by weight F | 0.008 | n.p. | 3 | Saliva | |
| Mitten 2-3 | 1,3 % by weight F | 0.006 | n.p. | 3 | Saliva | |
| Et-FOSE (1691-99-2) | Mitten 2-1 | 2 % by weight F | 0.007 | n.p. | 3 | Saliva |
n.a.: Product or fabric was not selected for analysis
n.s.: A screening result was not calculated
n.d.: The substance was not detected above the detection threshold, as indicated earlier in this report
n.p.: The analysis was not possible due to problems retrieving the frabrics
Substances and product groups have been selected based on these results, and subjected to risk assessment.
6.11.1 Conclusions from migration studies
The results from the migration studies are highly dependant on the substance in question:
- A higher level of formaldehyde was detected in bed linen following migration over 10 hours compared to the quantitative analysis based on an extraction period of 1 hour.
- Several products have high levels of phthalates, e.g. soap packaging, but only a fraction was found in the migration analysis. The high molecular weight phthalates (DINP and DNOP) were not detected by the migration analysis.
- Bisphenol A was found in the coverage/button on pacifiers made of polycarbonate, but this was not detected by the migration analysis.
- Perfluoro compounds were found in impregnated jackets and mittens, but migration analysis was not possible due to interference in the analysis method and thus poor detection. For this reason it cannot be determined - and thus not excluded - that perfluorate compounds migrate from the product.
- Isocyanates (2,4-TDI and MDI), triphenylphosphate, Diglycidylbisphenol and o-toluidine, which were detected in jackets and bed linen, were all shown to migrate.
Risk assessment of selected substances is described in Chapter 7.
7 Risk Assessment
- 7.1 Selection of dose factors (NOAELs and LOAELs)
- 7.2 Use of assessment factors
- 7.3 Exposure scenarios - Method
- 7.4 Calculation of risk - method
- 7.5 Significant sources of exposure
- 7.5.1 Indoor climate
- Gunnersen et al. (2009) state that the greatest exposure to PCB used in building joints occurs due to realease to the indoor air. Gunnersen et al. (2009) conclude that although primarily non-dioxin-like PCBs are released to the indoor air, there will also be exposure to dioxin-like PCBs. The relevance of this finding should be considered in view of the fact that there is always more or less concomitant exposure to non-dioxin-like PCBs and dioxin-like PCBs.
- The present report focusses on the dioxin-like PCBs because there is documented evidence of their endocrine disrupting effects.
- 7.5.2 Other sources of exposure
- 7.5.1 Indoor climate
- 7.6 Calculation of exposure
- 7.7 Risk assessment of the individual substances
- 7.7.1 DIBP, di-isobutyl phthalate, 84-69-5
- 7.7.2 DBP, dibutyl phthalate, 84-74-2
- 7.7.3 BBP, benzyl butyl phthalate, 85-68-7
- 7.7.4 DEHP, diethylhexyl phthalate, 117-81-7
- 7.7.5 DINP, di-isononyl phthalate, 28553-12-0
- 7.7.6 Prochloraz, 67747-09-5
- 7.7.7 Tebuconazole, 107534-96-3
- 7.7.8 Linuron, 330-55-2
- 7.7.9 Vinclozolin
- 7.7.10 Procymidone
- 7.7.11 Dioxins and dioxin-like PCBs
- 7.7.12 Non-dioxin-like PCBs
- 7.7.13 DDT
- 7.7.14 Propyl-, butyl-, and isobutylparaben
- 7.7.15 Bisphenol A, 80-05-7
- 7.8 Cumulative risk assessment of potential endocrine-like substances
7.1 Selection of dose factors (NOAELs and LOAELs)
The emphasis of the cumulative risk assessment in this project is on substances with endocrine disrupting effects. Thus the choice was made to base the assessment on NOAELs (No Observed Adverse Effect Levels) and LOAELs (Lowest Observed Adverse Effect Levels) from animal experiments that have shown endocrine disrupting effects. The used NOAELs/LOAELs do not come from the critical effect of the substances, which would normally be used in the surveying reports of the Danish Environmental Protection Agency. The aim has been to select NOAELs/LOAELs that are used for endocrine disrupting effects in EU risk assessments, EFSA opinions, or other official risk assessments. In many cases the employed results come from studies where the effects have been observed after the animals have been exposed to the substances during the foetal stage. One can question the assumption of whether 2-year-old children can be expected to be equally sensitive towards endocrine disrupting effects as in the foetal stage. There is insufficient knowledge about this relationship at the present time. As long as there are no counterarguments to this, use of NOAELs/LOAELs from experiments on exposure in foetuses to formulate the risk assessment of the exposure of 2-year-old children is deemed a reasonable (although careful) approach to the problem.
7.2 Use of assessment factors
In the previous surveying projects (among others the surveying projects from 2008 and prior to that), calculation of the Margin of Safety (MoS) was employed in the risk assessment of the measured exposure concentration/dose in the individual experiment.
Instead, REACH uses a Derived No Effect Level (DNEL) value calculated on the basis of NOAEL (or similar) and relevant assessment factors.
The DNEL value can be determined on the basis of dose factors (dose descriptors) such as NOAELs or LOAELs, corrected using several assessment factors (AF). The assessment factors to be used will depend on which study the dose factor is based. The endpoint-specific DNEL value is then calculated from this (ECHA, May 2008 – R8).
The endpoint-specific DNEL value is determined on the basis of the formula:
Endpoint-specific DNEL ![]()
NOAELcorr is the corrected NOAEL value, i.e. the carefully selected NOAEL value on the basis of which the DNEL value is calculated (NOAEL corrected, R8). An LOAEL value is used instead of an NOAEL value in certain cases where an NOAEL value has not been determined.
The employed assessment factors and DNEL values are evidenced by the substance review in chapter 7.7. The assessment factors are determined based on the principles outlined in the REACH guidelines. They are adjusted to the scenario with 2-year-old children as the target group. The assessment factors employed in the calculations are given in the table below.
Table 7.1.The assessment factors (AF) employed in the calculation of DNEL.
| Parameters | Value | Employed assessment factor |
| Interspecies | Allometric scaling Correction for differences in the metabolic rate per kg bodyweight. |
AS: 4 for rats 7 for mice |
| Interspecies | Remaining inter-species differences | 2.5 |
| Intraspecies | Differences between individuals | 10 |
| Dose response | LOAEL to NOAEL, if LOAEL is employed this is because NOAEL has not been determined | 3 |
7.3 Exposure scenarios - Method
The focus of the project is 2-year-old children's total exposure for chemical substances from consumer products, foods and the indoor climate. Exposure calculations for the selected substances have been made on the basis of the analyses that have been made for products relevant to 2-year-olds in this project, analyses of relevant products made in prior surveying projects as well as estimates of the exposure from cosmetic products, foods and the indoor climate.
Realistic worst-case exposure scenarios have been devised for the consumer products based on the EU REACH Guidance Document for risk assessments (REACH “Guidance on information requirements and chemical safety assessment” (ECHA, May 2008)) as well as “Children's toys fact sheet:[16] to assess the risks for the consumer” from RIVM (Bremmer & Veen, 2002)[17]. The scenarios are based on calculations of the use and predictable other uses of the products. The exposure assessment is (depending on the product type and chemical substance) based on sucking on/ingestion of the product, dermal contact and/or inhalation of volatile substances from the product or from chemical substances in the indoor climate. The exposure from the indoor climate is based on data from the literature.
For foods the starting point is 2-year-olds average food ingestion.
7.3.1 Route of exposure
7.3.1.1 Inhalation
In the risk assessment, calculations have been made for exposure to chemical substances via the indoor climate. The basis has been literature studies on chemical substances in dust and the indoor climate. In addition, 2-year-olds can be affected by inhalation of substances from several products, e.g. linens, clothing, etc.
7.3.1.2 Dermal uptake
Skin exposure (dermal exposure) must be considered relevant for all the selected product groups, as children have direct skin contact with all these products. The case considered is exposure via skin on varying places of the body, as clarified in the exposure calculations.
7.3.1.3 Daily ingestion
Ingestion via the mouth (oral exposure) is assumed to be the potentially largest problem for 2-year-olds. This age group is known for putting things in their mouths. Furthermore, they suck on their fingers. Thereby they can transfers any possible depositing from the fingers to the mouth, after they have been in contact with the products. Ingestion by these means is considered to be relevant for all product groups.
7.3.2 Previous relevant product surveys
The first phase of the project will review prior surveys/analyses of products that are relevant for 2-year-olds. The product types that the substances occur in are listed below:
The relevant, selected substances are found in:
- Baby/children duvets
- Swimming pool
- Beach ball
- Shower curtain
- Car tires for sandbox
- Books (of foam plastic)
- Indoor climate in the children's room
- Indoor climate – carpets, impregnating agents, dust, vinyl wallpaper
- Indoor climate day-care institution – laminating materials
- Scented toys
- Floor jigsaw
- Wrapping paper
- Play bags
- Toys - miscellaneous
- Lunch boxes
- Make up
- Masks
- Plasticine
- Baby changing mats/cushions
- Shoe care products
- Bottle feeder
- Swimming board
- Clothes
- Toilet paper.
The exposure for the relevant substances in these product types is thus combined with the exposure from the analysed products in this project.
For some of the products only content analyses and no migration analyses exist. Only data from migration analyses have been used in order to aovid overestimating the exposure, as this gives a more accurate assessment of the oral ingestion. Due to this lack of migration data, relevant contributions, have not been included in the total calculations,
7.3.3 Exposure scenarios
7.3.3.1 Exposure times used
Below, data has been collected for relevant exposure times (Table 7.2) for the product groups analysed in this project, as well as for the product types previously analysed.
On the basis of the available studies, realistic worst case-values have been determined for the later exposure calculations. Suitable exposure periods have been found in particular in Bremmer & Veen (2002) and DTI (2002).
Because the studies are structured differently, for the stated time intervals the best suitable category from the reference has been used, e.g. Bremmer & Veen (2002) have only one category for "pacifier”, "teething ring", “plastic toy” and “other objects”. This means that for soft toys the same time is used as for "other objects" because most soft toys that children sleep with do not belong to the category "plastic toys".
The statements in "Ingestion, 15 minutes per day (Bremmer & Veen, 2002)” of, for example, junior bedding (saliva) are average values for children (19-39 months) that suck on “other objects”. This means that the value does not represent the worst case in the group, but an average of the time that children - who put things in their mouth – have other objects in their mouth.
The corresponding values from the other study (DTI, 2002) have also been entered in the table. A total statement shows that 2-year-olds (24-36 months) sit with objects in the mouth at the most 7:42 hours/day in the daily hours, excluding eating periods and including periods with a pacifier (DTI, 2002). The corresponding average time for 2-year-olds is 1:39 hours/day, which attests to the fact that there are large individual differences.
For migration from articles, REACH R 17 (R17.3) refers to Van Engelen et al (2006). Due to the limited number of surveys and the large variations in the data, it is generally recommended to use an exposure time (sucking time) of 3 hours for toys (and other objects) that children of 0-3 years put in their mouth.
Based on the above principle and recommendations, the existence of identical categories has been taken into account in the exposure calculations, in such a way that the total oral exposure of toys and other objects together gives at most 3 hours/day, i.e. excluding pacifiers, since these are also used when sleeping. Similalry, a correction has been made for the overlap between the groups “packaging for bath soap” and “non-slip figures and mats for the bath” so that the exposure for these two groups is in total 30 min. for the bath period.
Table 7.2 Reproduces the migration analyses of the analysis programme.
Table 7.2 Overview of the relevant migration analyses compared with the exposure period
| Product groups | Migration analysis | Remarks on the exposure period (intervals) | Used exposure period (worst case) |
| Product types analysed in this project | |||
| Outdoor clothes Impregnated jackets and mittens |
Saliva (sleeve edge or collar, exterior surface of mitt, strap) Sweat (inner side of jacket sleeve and mitt) | Intake: 15 min. per day (Bremmer & Veen, 2002) Intake: 178 min. (2:58 hours) per day, max. for 2-year-olds, other objects (DTI, 2002) Dermal uptake 195 min. (3:16 hours) outdoors stay for 1-4-year-olds. Max. 715 min. (11:55 hours) (US EPA, 2002) Possible inhalation 195 min. (3:16 hours) average outdoors stay for 1-4-year-olds. Max. 715 min. (11:55 hours) (US EPA, 2002) |
Intake: 178 min. (2:58 hours) per day, max. for 2-year-olds, other objects (DTI, 2002) Dermal uptake: 3 hours is used as a realistic value for 2-year-olds (estimate by the Danish Ministry of the Environment). |
| Footwear Rubber clogs Rubber boots |
Sweat | Dermal uptake: 10 hours per day (DHI estimate). (Possible ingestion: 178 min. (2:58 hours) per day, max. for 2-year-olds, other objects (DTI, 2002) Possible inhalation 10 hours per day (DHI estimate). |
Dermal uptake: 10 hours per day for both indoor + outdoor footwear is used as a realistic worst case for 2-year-olds. . Additionally, 4 hours is used as an alternative scenario (estimate by the Danish Danish Environmental Protection Agency). |
| Pacifiers Teat Coverage |
Saliva and sweat (while playing) | Ingestion: 462 min. (7:42 hours) per day including night (Bremmer & Veen, 2002) Ingestion: 217 min. (3:37 hours) per day excluding night, max. for 2-year-olds (DTI, 2002) Dermal uptake: 462 min. (7:42 hours) per day (Bremmer & Veen, 2002) Possible inhalation 462 min. (7:42 hours) per day, based on the same contact time as for dermal uptake (DHI estimate) |
Ingestion: 462 min. (7:42 hours) per day including night (Bremmer & Veen, 2002) Dermal uptake: 462 min. (7:42 hours) per day including night (Bremmer & Veen, 2002) |
| Soap packaging for bath soap | Saliva (by playing) and sweat (by dermal contact) | Ingestion: 11 min. per day, plastic toys (Bremmer & Veen, 2002) Ingestion: 126 min. (2:06 hours) per day, max. for 2-year-olds (DTI, 2002) Dermal uptake: 10-30 min. per day (reference to Chapter 1, Tier 1 parameters) Possible inhalation 10-30 min. per day (reference to Chapter 1, Tier 1 parameters) |
Ingestion: 30 min. per day, as estimated average bathing duration (DHI estimate). Dermal uptake: 30 min. per day, as estimated average bathing duration (DHI estimate). |
| Non-slip figures and mats for baths | Saliva (by playing) and sweat (by dermal contact) | Ingestion: 11 min. per day, plastic toys (Bremmer & Veen, 2002) Ingestion: 126 min. (2:06 hours) per day, max. for 2-year-olds, toys (DTI, 2002) Dermal uptake: 10 to 45 min. per day average bathing during per day for 1-17-year-olds (US EPA, 2002). |
IngestionIngestion: 30 min. per day, as estimated maximum average bathing duration (DHI estimate). Dermal uptake: 30 min. per day, as estimated average bathing duration (DHI estimate). |
| Soft toys | Sweat, saliva and inhalation (in scented soft toys and for heating) | Ingestion: 15 min. per day, other objects (Bremmer & Veen, 2002) Ingestion: 126 min. (2:06 hours) per day, max. for 2-year-olds, toys (DTI, 2002) Dermal uptake: 10:34 hours per day, average sleep/ 24 hours for 3-5-year-olds (US EPA, 2002). Dermal uptake: 10-12 hours of sleep/24 hours for 1-3-year-olds (Netdoktor, 2008a). Inhalation 12 hours per day generally for soft toys at room temperature. And release from microwave heated-soft toys 1 hour per day (based on personal experience in the project group) |
Ingestion: 126 min. (2:06 hours) per day, max. for 2-year-olds, toys (DTI, 2002) Dermal uptake: 12 hours per day based on a 12 hour sleep period for 2-year-olds (DHI estimate) Inhalation 1 hour per day, as release from microwave-heated soft toy + 12 hours per day based on release at room temperature (DHI estimate) |
| Diapers | Sweat[18] (urine3) |
Dermal uptake: 23:30 hours per day (DHI estimate). (Possible ingestioningestion: 178 min. (2:58 hours) per day, max. for 2-year-olds, other objects (DTI, 2002) |
Dermal uptake: 23:30 hours per day based on 24 hours per day subtracted 30 min. bathing time (DHI estimate) |
| Junior linen | Sweat, saliva | Ingestion: 15 min. per day (Bremmer & Veen, 2002) Ingestion: 178 min. (2:58 hours) per day, max. for 2-year-olds, other objects (DTI, 2002) Dermal uptake: 10:34 hours per day, average sleep/ 24 hours for 3-5-year-olds (US EPA, 2002). Dermal uptake: 10-12 hours of sleep/24 hours for 1-3-year-olds (Netdoktor, 2008a). Possible inhalation 10-12 hours of sleep/24 hours for 1-3-year-olds (Netdoktor, 2008a). |
Ingestion: 178 min. (2:58 hours) per day, max. for 2-year-olds, other objects (DTI, 2002) Dermal uptake: 12 hours sleep/24 hours for 2-year-olds (DHI estimate) |
| Toys | Sweat, saliva | Ingestion: 15 min. per day, other objects (Bremmer & Veen, 2002) Ingestion: 126 min. (2:06 hours) per day, max. for 2-year-olds, toys (DTI, 2002) Dermal uptake: No data found, but according to Bremmer & Veen (2002) 2-3-year-old children suck on miscellaneous items approx. 11 hours per day, which also indicates the active time period of dermal contact. |
Ingestion: 178 min. (2:58 hours) per day, max. for 2-year-olds, other objects (DTI, 2002) Dermal uptake: 9 hours for 2-year-olds Estimate based on 11 hours of being active minus approx. 2 hours for eating and dressing (DHI estimate). |
In summary, the overall times considered for a 2-year-old child's day:
- It is assumed that 2-year-old children sleep approx. 12 hours per day.
- It is assumed that 2-year-old children suck on things 11 hours per day (including pacifiers). According to Bremmer & Veen (2002), 2-3-year-old children suck on miscellaneous items at most about 11 hours per day.
- It is assumed that of the 11 hours, the 2-year-old uses about 2 hours to eat and dress.
- It is assumed that 2-year-old children bathe approx. ½ hour per day.
- There is no available information on the remaining last half hour of the day, but it is assumed that the 2-year-old is busy with another activity other than eating, bathing, playing, getting dressed and sleeping, which is included in the scenarios.
According to the CASA report (Hagendorn-Rasmussen, 2008) only a few cases have been observed in which 2-year-old children play with one item for more than half an hour per day. For the calculations, the toy with the highest exposure (migration value) has been used. This is because the data constitutes a basis of random samples and not a representative market analysis. The data basis thus gives no knowledge about the highest concentrations of the substance in the products on the market; therefore the highest migration value is used to ensure a realistic worst case. The highest migration value is therefore used as the worst-case representative for all toys throughout the day.
The majority of the previous surveys on phthalates in toys originate from before 2007, when the statutory order on phthalates came into force. In this investigation, the decision to use results from the previous surveys of toys is a conscious choice. This is despite the fact that some of the toys would be banned today because the phthalate concentrations exceed the allowed threshold limit. This decision was taken because it is realistic to believe that toys purchased prior to 2007 will still be in use in Danish homes. Toy products purchased today do not give the same exposure, becasue new toys must comply with the statutory order on phthalates. However, dermal exposure from phthalates other than DEHP, DBP and BBP can still occur if the 2-year-old plays with toys suitable for children above the age of 3, since these three phthalates are the only ones banned in all toys. The regulation on the phthalates DINP, DIDP and DNOP apply exclusively to toys that children are able to put into the mouth (i.e. the toy is smaller than a certain size).
Two-year-olds can be exposed even if they are not holding the toys in their hands. For example, this could be via inhalation, if the toy releases substances to the immediate inhalation zone, or the indoor air. Inhalation of evaporated phthalates (i.e. that contained in the indoor climate) is not generally considered to be the main exposure source. The ingestion of phthalates via dust is considered to contribute to the oral uptake. These factors in addition to the general lack of data on the evaporation of substances from toys means that only dermal uptake and oral ingestion have been included in the calculations.
If the 2-year-old holds the toy in their hand, exposure occurs not only via dermal uptake but also when the 2-year-old sucks on their fingers, which is something they do a lot. This means that we assume that the entire quantity of substance that is transferred to the fingers will either be taken up via the skin or will be sucked off the fingers. To avoid overestimating the amount ingested, it is assumed in the calculations that dermal contact with toys is at most 9 hours (the time that a 2-year-old is in contact with toys during the day) and oral ingestion occurs over 3 hours per day (the maximum time that a 2-year-old sucks on toys). A 2-year-old does not normally suck on as many things as an infant. This is accounted for in the calculations by assuming that they suck on an area that is smaller than that of the dermal contact. It is assumed and included in the calculations that the 2-year-old sucks on 50% of the area that they have dermal contact with.
7.3.3.2 Use of summer and winter scenarios
As there is a difference in the behavioural patterns of 2-year-olds in the summer half-year and in the winter half-year, a summer scenario and a winter scenario have been considered in order to include the most realistic exposure during both seasons.
It has been decided that the scenarios encompass the following:
The summer scenario encompasses:
- Contact with sunscreens
- Contact with rubber clogs (no socks are worn)
- Dermal contact with toys for 9 hours in the summer
- Ingestion of 50 mg dust (US EPA states this value for the summer scenario).
The winter scenario encompasses:
- Dermal contact with toys for 6 hours in the winter
- Contact with jackets/mittens for 3 hours.
- Ingestion of 100 mg dust (US EPA states this value for the winter scenario, when one is more indoors).
In addition both the summer and winter scenarios contain the same remaining elements, i.e.:
- Ingestion of foods
- Contact with objects other than toys, i.e. moisturising cream, bath articles and other textiles aside from winter clothing (jackets/mittens).
7.3.3.3 Anatomic data
For the exposure scenario for the risk assessment, a series of data on frequency of use, body surfaces exposed, etc. have been collected. These are given in Table 7.3. Anthropometric data (body weight, skin areas, etc.) have been used for the calculations of the exposure per kg bodyweight per day, as assumed in Bremmer & Veen, 2002. Average data for the anatomic data have been used for exposure calculations as agreed with the Danish Environmental Protection Agency. These are given in the column “used”.
Table 7.3 Overview of other data for use in the exposure scenarios for 2-year-olds
| Parameters | Value (possible min./max. and remarks) | Applied (average): |
| Weight | 13.0 kg (average for boys and girls that have recently turned 2 years, Netdoktor, 2008b). 11.0-16.3 kg for boys and 10.3-15.5 kg for girls (minimum and maximum weight for girls and boys that recently turned 2 years, Netdoktor, 2008b). 15.2 kg (average for boys and girls that have recently turned 3 years, Netdoktor, 2008b). 12.7-19.0 kg for boys and 12.0-18.2 kg for girls (minimum and maximum weight for girls and boys that recently turned 3 years, Netdoktor, 2008b). Since the project focuses on 2-year-olds, i.e. from 2 years to almost 3, the average value for 3-year-olds is used. |
15.2 kg |
| Height (body length) | 15.2 kg (average for boys and girls that have recently turned 2 years, Netdoktor, 2008). 97 cm (average for boys and girls that have just turned 3 years, Netdoktor, 2008). 81-94 cm for girls and 82-95 kg for boys (minimum- and maximum length for girls and boys that recently turned 2 years, Netdoktor, 2008b). 3-year-old boys are max. 105 cm, i.e. 2-year-old children (that are soon to turn 3 years) can measure up to 105 cm in height. |
97 cm |
| Body surface | The body surface of 2-year-olds (2<3-year-olds) is on average 0.591 m2 (based on the 50th percentile, which is 0.603 m2 for boys and 0.579 m2 for girls, respectively) and the corresponding 0.657 m2 for the 3-year-olds (3<4-year-olds), which is.0.664 m2 for boys and 0.649 m2 for girls, respectively (US EPA, 2002). Corresponding values are given in the REACH Guidance R.15 Consumer exposure estimation (ECHA, May 2008 – R.15 p. 43), so that the body surface for 2-3-year-olds is 6,030 cm2 which is equivalent to 0.6 m2. |
0.6 m2 (in order to have an adequate value of the soon to turn 3-year-old boys). |
| Head | In the REACH Guidance R.15 Consumer exposure estimation (ECHA, May 2008 – R.15 p. 43), the relationship between the area of the head (face) of adult men and women to the body surface area is given. Both men and women's heads constitute 6.1% of the body. Children have a somewhat larger head in proportion to their body size, therefore 10% is used in the calculations for 2-3-year-olds. The values are accurate for the face, but are assumed to also be valid for the head covered with hair. |
10%, i.e. 0.06 m2 |
| Arms | In the REACH Guidance R.15 Consumer exposure estimation (ECHA, May 2008 – R.15 p. 43), the relationship between the area of the arms of adult men and women to the body surface area is given. Both men and women's arms constitute 11.7% and 11.8% of the body, respectively. It is assumed that the same conditions are valid for the arms of 2-year-olds, i.e. the arms constitute 0.07 m2 of the body. | 11.8% of the entire body, i.e. 0.07 m2. |
| Legs | In the REACH Guidance R.15 Consumer exposure estimation (ECHA, May 2008 – R.15 p. 43), the relationship between the area of the legs of adult men and women in proportion to the body surface area is given. Both men and women's legs constitute 26.1% and 26.0% of the body, respectively. It is assumed that the same conditions are valid for the legs of 2-year-olds, i.e. the legs constitute 0.16 m2 of the body. | 26.1% of the entire body, i.e. 0.16 m2. |
| Feet, as % of body | The feet constitute 7% of the body in 2<3 -year-olds. 7% of the body is in contact with shoes (US EPA, 2002 Table 8-3). Children have relatively large feet in comparison to the rest of the body (when compared to adults). | 7% of the entire body (i.e. 0.042 m2) |
| % body part in contact with diaper[19] | Body/torso3 of 2<3-year-olds constitutes 38.5% (US EPA, 2002, Table 8-3). It is assumed that the lower part, i.e. from the navel and downwards constitutes approx. 1/3, i.e. in total 12.8% of the body. | 12.8% of the entire body (i.e. 0.077 m2) |
| % buttocks | It is assumed that the buttocks constitute approx. half of the body part that is in contact with the diaper, i.e. in total 6.4% of the body. | 6.4% of the body (i.e. 0.038 m2) |
The exposure scenarios that are to be calculated are chosen on the basis of the existing results as well as the results from the analyses in this project.
7.3.4 Methods for the calculation of exposure
For the substances from the screening analyses a “Tier 1 exposure assessment” has been performed as explained in the REACH guidelines for risk assessment. This Tier 1 exposure assessment has only been performed on the substances where a value was measured from the screening analyses. A direct value cannot be measured for all the substances identified via the screening analyses, because the measurement requires that the substance be found as a reference substance in the analysis laboratory's database. This requirement was not fulfilled for all of the substances. The Tier 1 exposure gives a very rough estimate of the children's exposure, since it assumes 100% migration and 100% uptake of all substances. More detailed exposure calculations are performed for the selected substances listed in chapter 3.1.
The following chapters describe how the exposure via inhalation, dermal contact and oral contact was calculated.
7.3.4.1 Calculation of exposure
Exposure at inhalation
The exposure of 2-year-olds via the respiratory passages occurs primarily indirectly via the indoor climate or via toys that release volatile substances.
For assessment of the exposure, the general equations described in the REACH document “Guidance on information requirements and chemical safety assessment” (ECHA, May 2008) have been employed.
The exposure is calculated according to the formula “Equation 15-2” from the REACH Guidance document, Chapter R.15 “Consumer exposure estimation” (ECHA, May 2008):
![]()
where
| Dinh | Inhaled daily dose | mg/kg BW/day |
| Fresp | Inhaled substance, i.e. the respirable fraction (decimal fraction between 0-1) | |
| Cinh | Concentration of the substance in the air of the room | mg/m5 |
| Tcontact | Duration of exposure per event | hours |
| IHair | Ventilation rate of person | m3/day |
| n | Number of exposures (events) | per day |
| BW | Body weight (BW) | Kg |
The parameters used for the calculation of the exposure via inhalation for 2-year-old are described in Table 7.2 and Table 7.3.
Dermal exposure
The exposure of the skin occurs by direct contact with the products, e.g. when the toy is held in the hand, when the clothes are worn on the body, when not wearing socks, when the child falls asleep with its cheek on its soft toy, etc. The chemical substances can come in contact with the skin via sweat. The results from the migration analyses (to artificial sweat) are used in the calculations.
The possible uptake via skin is calculated according to the formula “Equation 15-8” from the REACH Guidance document, Chapter R.15 “Consumer exposure estimation” (ECHA, May 2008). We have added a factor Fabs,, which is the fraction of substances that can be taken up via the skin. Thus, the calculated Dder value constitutes the actual amount of substances that can be taken up per kg BW per day.
![]()
The product Fcprod • Fcmigr corresponds directly to the results from the migration analyses.
where
| Dder | Daily dermal dose (amount of chemical substance taken up) | µg/kg BW/day |
| Qprod | Amount of product used | g |
| Fcprod | Weight fraction of the substance in the product (decimal fraction between 0 and 1) | |
| Fcmigr | Fraction of substance that migrates out of the product per unit time | µg/g per hour |
| Fabs | Fraction of the applied substance that is absorbed through the skin (decimal fraction between 0 and 1) | |
| Fcontact | Fraction of the contact area (to account for the fact that the product is only in partial contact with the skin) | m2/m2 |
| Tcontact | Duration of exposure per event | Hours |
| n | Number of exposures (events) | per day |
| BW | Body weight (BW) | kg |
The parameters used for the calculation of the exposure via inhalation for 2-year-old are described in Table 7.2 and Table 7.3.
If there is no knowledge of the dermal uptake of a substance, then a worst case-scenario is used: The entire amount of substance that is given off to the artificial sweat in the exposure experiments will be dermally absorbed. Where data for the dermal uptake of a substance exists, this will be used.
Oral exposure
Oral exposure occurs when the 2-year-olds suck on their clothes, toys, pacifiers, etc. By oral exposure is understood the uptake in the body occurring after release (migration) of the substances from products and mixing in saliva. Uptake can occur via mucous membranes in the oral cavity or in the gastrointestinal tract.
The possible uptake via the mouth is calculated according to the formula “Equation 15-11” from the REACH Guidance document, Chapter R.15 “Consumer exposure estimation” (ECHA, May 2008). This formula however covers the direct ingestion of substances/products, which is why the equation has been adjusted to the present scenario with migration to the saliva simulant, i.e. where the 2-year-olds suck the products (and does not swallow them directly). Doral below thus denotes the ingestion of the substance when the child sucks on the product.
![]()
The product Fcprod • Fcmigr corresponds directly to the results from the migration analyses, where the following is used:
| Doral | Oral exposure daily dose | µg/kg BW/day |
| Qprod | Weight of product one is exposed to | g |
| Fcprod | Weight fraction of the substance in the product (decimal fraction between 0 and 1) | |
| Fcmigr | Fraction of substance that migrates per unit time | µg/g per hour |
| Foral contact | Fraction of the contact area (to account for the fact that the product is only inside the mouth) | m2/m2 |
| Tcontact | Duration of exposure per event | hours |
| n | Number of exposures (events) | per day |
| BW | Body weight (BW) | kg |
In REACH R 17 (R17.3) on the subject of migration from articles there is a reference to Van Engelen et al (2006). In the reference, a formula for the uptake of a substance from "sucking” (on p. 47) is given, whereby it is possible to calculate a factor for the migration of a substance from the item in the given case where no migration data exists for the release of a metal from the item. The reference focuses on the release of metals from items. This formula is not relevant in the present context, since there are no metals on the substance list and no migration of substances has been measured.
7.4 Calculation of risk - method
As explained above, the 2-year-olds can be exposed to the same substance via different routes of exposure – inhalation, dermal and oral exposure. According to the REACH Guidance document on consumer exposure (ECHA, May 2008 – R.15 p. 29), the exposure dose for the three different routes of exposure is summated to obtain the total exposure:
![]()
According to the REACH guidance document for risk assessment (ECHA, May 2008 – Part E p. 14), each case is assessed for health risks using the following formula, which calculates the Risk Characterisation Ratio (RCR) by using the Derived No Effect Level (DNEL):
![]()
If the RCR > 1 (i.e. the exposure is greater than the DNEL) then there is a risk. If the RCR < 1 then the exposure is considered to not pose any risk.
The basis for foods is normally the EFSA assessments of oral ingestion and the respective threshold values dictated in the legislation. However, in this report the above model has been used for the calculations.
7.4.1 Combination effects
Combination effects or cocktail effects denote the exposure to different substances that all have the same effects from many different sources. The Danish Working Environment Authority recommends that calculations consider a total (additive) effect if no specific information on the concurrent effects is availabsummated (the Danish Working Environment Authority, 2005). The simultaneous occurrence of several substances can have a strengthening (synergic) or weakening (antagonistic) effect. Demonstrating the existence of these effects requires rigorous studies with the appropriate detailed combinations of substances. In this project only the additive effects are included and considered.
New investigations show that combination effects of phthalates and other antiadrogenic substances can be calculated using the dose addition-concept (NAP, 2008; Benson 2009). This concept is also used here.
The total, i.e. additive risk is thus calculated by adding the individual substance RCR values together:
![]()
RCR total is thus an expression for the increased (cumulative) risk that the child is exposed to, for example, the effects from the entire group of potential endocrine disruptors with antiandrogenic effects.
It should be noted that the RCR value for the individual substance in toys is only included once. The largest RCR value for the substance in toys is selected and used in the calculation for a maximum of 9 hours. Overall this ensures that the contact with toys and individual substance is not included when the period of contact exceeds 9 hours per day .
RCR total is calculated:
- In an isolated fashion for the antiandrogenic substances (RCR totalantiandrogenic)
- In an isolated fashion for the oestrogen-like substances (RCR totaloestrogen).
7.5 Significant sources of exposure
In the following section the significant sources of exposure for some of the prioritised substances from selected literature are discussed.
7.5.1 Indoor climate
According to Rudel et al, 2003, indoor air has been identified as one of the most significant sources of exposure to chemical substances. Indoor air appears to contain significantly higher concentrations of chemical substances than outdoor air. For young children the most important exposure pathway appears to be house dust.
A series of the selected substances are found in the indoor air as they are released by miscellaneous furniture and consumer products in the home, and can thus be measured in both the dust as well as the indoor air. Several more recent investigations on the content of potential endocrine disruptors in the indoor climate are reviewed, and the tables below give an overview of the data presented in the sources. There are most references in the open literature for the measurement of the content of phthalates in dust. Europe has for a number of years had legislation prohibiting the use of certain phthalates in toys (first a ban in toys for children aged 0-3 years, now a ban in all toys) but this is not reflected in the investigations, since phthalates in dust in the indoor climate in the US and European countries are at the same level (shown in Hwang et al, 2008, among other sources). For instance, the highest measured concentrations of DEHP have been made in Sweden (Bornehag et al, 2005).
Only one American investigation was found in which several potential endocrine disruptors were measured in both the dust indoors and the indoor air, and a few surveys on PCB in dust and indoor air. A Danish survey on PCB in Danish buildings was recently published in March 2009 (Gunnarsen et al, 2009).
Gunnersen et al. (2009) state that the greatest exposure to PCB used in building joints occurs due to realease to the indoor air. Gunnersen et al. (2009) conclude that although primarily non-dioxin-like PCBs are released to the indoor air, there will also be exposure to dioxin-like PCBs. The relevance of this finding should be considered in view of the fact that there is always more or less concomitant exposure to non-dioxin-like PCBs and dioxin-like PCBs.
The present report focusses on the dioxin-like PCBs because there is documented evidence of their endocrine disrupting effects.
Several PCB concentration measurements have been made in the indoor climate (dust and air), but most have focussed on measurements in buildings (e.g. schools) where there is awareness that the building is contaminated with PCB. The levels in these buildings can be extremely high, even above 40 µg/m3 in air and 980 µg/g in dust (Weis et al, 2003). For the exposure calculations in this project, we have chosen to use values found in common households, (Rudel et al, 2003; Gunnarsen et al, 2009). There are no investigations showing whether PCB found in day-care institutions resembles the data for common households or public buildings (which normally have a significantly higher content of PCB in dust and indoor air).
Danish values are used in the exposure calculations where possible, but these are only available for PCB and DEHP (in dust). For DEHP, the Danish value was used for the 95th and 50th percentile but not for the maximum value, which was not given. The maximum value of DEHP in dust (> 40,000 µg/g) comes from an investigation of household dust in Swedish homes (Bornehag et al, 2004). The same Swedish survey has lower values for both the 95th and 50th percentile when compared to the Danish survey (4069 and 770 µg/g in dust, respectively, (Sweden) versus 7063 and 858 µg/g, respectively, (Denmark)). The Swedish survey (346 measurements) is significantly larger than the Danish survey (23 measurements). The figures from studies on household dust in Swedish homes are used for the DBP phthtalate (Bornehag et al, 2005), as no figures are available for Danish homes.
As is apparent from the data in Table 7.4, there is a very large difference between the 50th and 95th percentile, and the maximum values of phthalates measured in in dust. This illustrates the large differences in the levels that exist and, thus also the levels that will occur in Danish households. Thus, exposure calculations have been made for the 50th and 95th percentiles, as well as for the maximum value, in order to illustrate the large range and its significance for the risk.
Table 7.4 Overview of the amounts of various potential endocrine disruptors in dust in the indoor climate.
| Source | Concentration measured in indoor climate dust | Comment |
| Hwang et al, 2008 | DEHP: ND – 40459 µg/g (95th percentile: 854 – 7980 µg/g) (Avg.: 192 – 3214 µg/g) (median* = 195 - 996 µg/g) |
For phthalates the source has only investigated DEHP. American investigation, but data has also been given from various other sources – including European (1997-2008). Between 5 and 376 number of samples in the various surveys. The largest value is measured in the investigation involving 376 samples. |
| Becker et al, 2004 | DEHP: 22 – 5330 µg/g) (95th percentile: 1840 µg/g) (50th*percentile: 515 µg/g) (Avg. (geometric): 508 µg/g) |
Only DEHP was measured in household dust from vacuum cleaner bags in Germany. Otherwise measurements of phthalate metabolites were made in children's urine. 252 vacuum samples have been analysed. |
| Clausen et al, 2003 | DEHP Schools: Avg.: 3214 µg/g (95th percentile: 7063 µg/g) (50th*percentile: 858 µg/g) Household dust: Avg.: 640 – 858 µg/g) (95th percentile: 2000 – 2600 µg/g) |
Also reproduces results from prior Danish (1991/23 samples), German (1997/272 samples, 2001/286 samples) and Norwegian (1997/38 samples) surveys on household dust (vacuum cleaner dust). The most recent surveys (2003) are solely from schools and not private homes. Bornehag et al, 2005 that has cited the 50th percentile from this Danish investigation by Clausen et al, 2003. |
| Bornehag et al, 2004 and Bornehag et al, 2005 | DEHP: 0 – 40459 µg/g) (Avg.: 1310 µg/g, median: 770 µg/g) (95th percentile: 4069 µg/g) DEP: 0 – 2425 µg/g) (Avg.: 31 µg/g, median: 0.000 µg/g) (95th percentile: 115 µg/g) DIBP: 0 – 3810 µg/g) (Avg.: 97 µg/g, median: 0.045 µg/g) (95th percentile: 311 µg/g) BBP: 0 – 45549 µg/g) (Avg.: 319 µg/g, median: 0.135 µg/g) (95th percentile: 599 µg/g) DINP: 0 – 40667 µg/g) (Avg.: 639 µg/g, median: 0.041 µg/g) (95th percentile: 1930 µg/g) |
346 measurements of surface dust from children’s rooms in Sweden were performed. Data from the same survey is presented in the two sources, but in Bornehag (2005) results from six German surveys are also given (1997/272 samples, 2001/286 samples, 2002/199 samples, 2003/65 samples, 2004/30 samples, 2004/252 samples), as well as a Norwegian survey (1997/38 samples) and a Danish (2003/23 samples – only DEHP) |
| Kolarik et al, 2008 | DEHP: 95th percentile: 1190 – 7980 µg/g) (50th percentile = 340 - 990 µg/g BBP: 95th percentile: ND – 1560 µg/g (50th percentile = ND 340 µg/g DBP: 95th percentile: ND – 30.800 µg/g (50th percentile = ND - 9850 µg/g |
Dust analyses were performed in 177 households in Bulgaria. In addition the results of nine other European investigations were reproduced (including Becker et al, 2004; Clausen et al, 2003; and Bornehag et al, 2004). Results from Sweden (2004/346 samples), Germany (1997/272 samples, 2001/286 samples, 2002/199 samples, 2002/65 samples, 2004/30 samples, 2004/252 samples), Norway (1997/38 samples) and Denmark (2003/23 samples). Other phthalates have also been measured. Kolarik et al, 2008 refers to the same investigations as other sources, but only gives the 95th percentile and not the max. values, which is the reason why the high value of > 40.000 µg/g does not appear in the source. |
| Rudel et al, 2003 | DEHP: 16,7 – 7700 µg/g) (median = 340 µg/g) DBP: < 24 – 352 µg/g) (median = 20,1 µg/g) BBP: 3,87 – 1310 µg/g) (median = 45,4 µg/g) DIBP: < 1 – 39,1 µg/g) (median = 1,91 µg/g) DEP: < 4 – 111 µg/g) (median = 4,98 µg/g) Butylparaben: < 0,2 – 3,92 µg/g) (median = < 0.2 µg/g) PCB 52: < 0,2 – 15,7 µg/g) (median = < 0.2 µg/g) PCB 105: < 0,2 – 16,3 µg/g) (median = < 0.2 µg/g) PCB 153: < 0,2 – 35,3 µg/g) (median = < 0.2 µg/g) Bisphenol A: < 0,2 – 17,6 µg/g) (median = 0,821 µg/g) |
Measurements were done in 120 American households. The dust sample is collected via a vacuum cleaner from 4-5 of the most used rooms in the household. Of the 120 households, PCB was found in the air in 32% of the cases and in the dust in 18% of the cases. (Rudel et al, 2008) |
| Rudel et al, 2008 | Sum of PCB 105 and 153:. Max.: 0.6 - 10 µg/g |
The source follows up 2 of the 120 American households that had the highest measured PCB concentrations. The cause is discovered (wooden floor finish). High PCB concentrations are still measured 5 years later. The result that other American surveys do not show the same high PCB concentrations is reproduced (a survey of 1000 vacuum cleaner bag samples). The distribution thus indicates the levels from "normal" to the few high concentrations given in Rudel et al, 2008. |
| Sullivan, 2008 | Total PCB: Max. 36 µg/g Avg.: 6,7 µg/g |
19 random samples taken at a school. PCB was found in 18 out of 19 samples from the school. |
| Gunnaesen et al, 2009 | PCB 7: < 0,015 – 0,0899 µg/g) PCB n: < 0,015 – 0,171 µg/g) |
In the study, buildings containing PCB in the building materials were chosen consciously. The values stated are for single family houses (4) and single story houses (1), but measurements were also made in a warehouse, an office, a high school and a university that contained between 1 and 100 times higher concentrations of PCB in the dust. PCB 7 = sum of 7 congeners. PCB n = sum of n of the 22 congeners that were above the detection threshold. Note that no 95th percentile has been given for the few measured data. |
ND = Not detected (below the detection threshold)
*) Note that some surveys provide a median value and others a 50th percentile. This is an expression of the same value, since the 50th percentile is also called the median, a measure of centrality, i.e. the value where half of the values lie below and the other half of the values lie above. The median is thus not (necessarily) the same value as the average.
The majority of the surveys focus on the content of phthalates in the dust of the indoor climate. Two American surveys were found that measured the concentration of phthalates in the indoor air; one study that also measured other potential endocrine disruptors in the indoor air; two American surveys measuring PCB in the indoor air; and a new Danish survey that measures PCB in the indoor air. It should be noted that the measurement of the indoor air can include the airborne particles (e.g. swirled up) and gases/steam. The results are reproduced in the table below.
Table7.5 Overview of the amounts of various potential endocrine disruptors in the indoor air.
| Source | Concentration measured in the indoor air | Comment |
| Adibi et al, 2008 | DEHP: 95th percentile: 0.49 µg/m3 (50th percentile = 0.19 µg/m3) DBP: 95th percentile: 1.04 µg/m3 (50th percentile = 0.48 µg/m3) BBP: 95th percentile: 0.27 µg/m3 (50th percentile = 0.04 µg/m3) DIBP: 95th percentile: 1.43 µg/m3 (50th percentile = 0.50 µg/m3) DEP: 95th percentile: 5.06 µg/m3 (50th percentile = 2.33 µg/m3) |
Measurements were made in 96 American homes over a period of 48 hours. The persons wore a device that assured the measurements from the air were made around the person (personal air). |
| Schettler, 2006 | DEP: median 0.10 µg/m3 DBP: median 0.39 µg/m3 BBP: median 0.01 µg/m3 Dicyclohexyl phthalate: median 0.07 µg/m3 DEHP: median 0.11 µg/m3 |
Phthalate concentrations were measured in the indoor air in 27 houses in Tokyo. |
| Rudel et al, 2003 | DEHP: < 59 – 1000 ng/m3 (median = 77 ng/m3) DBP: 52 – 1100 ng/m3 (median = 220 ng/m3) BBP: < 31 – 480 ng/m3 (median = < 31 ng/m3) DIBP: 11 – 990 ng/m3 (median = 61 ng/m3) DEP: 130 – 4300 ng/m3 (median = 590 ng/m3) Butylparaben: Max.: 3.2 ng/m3 (median = < 4 ng/m3) PCB 52: < 1 – 25 ng/m3 (median = < 1 ng/m3) PCB 105: < 1 – 3.6 ng/m3 (median = < 1 ng/m3) PCB 153: < 1 – 6.7 ng/m3 (median = < 1 ng/m3) |
Measurements were made in 120 American homes over a period of 24 hours. Measurements were made in a room that is used frequently, i.e. the living room or the family room. Air was suctioned at a height of 1.2 m above the floor (4 ft). Of the 120 households, PCB was found in the air in 32% of the cases and in the dust in 18% of the cases. (Rudel et al, 2008) |
| Rudel et al, 2008 | Sum of the three PCBs: Max.: 7.3 ng/m3 | The source follows up 2 of the 120 American households that had the highest measured PCB concentrations. The cause is discovered (wooden floor finish). High PCB concentrations are still measured 5 years later. The result that other American surveys do not show the same high PCB concentrations is reproduced. The distribution thus indicates the levels from "normal" to the few high concentrations given in Rudel et al, 2008. |
| Sullivan, 2008 | Total PCB: 2.4 – 310 ng/m3 | Samples taken at a school. |
| Gunnaesen et al, 2009 | PCB 7: < 1 – 5.6 ng/m3 PCB n: < 1 – 11.9 ng/m3 |
In the study, buildings containing PCB in the building materials were chosen consciously. The values stated are for single family houses (4) and single story houses (1), but measurements were also done in a warehouse, an office, a high schools and a university that contained between 1 and 100 times higher concentrations of PCB in the indoor air. PCB 7 = sum of 7 congeners. PCB n = sum of n of the 22 congeners that were above the detection threshold. |
Small children have a particularly high ingestion of dust, since they crawl around on the floor, put dirty fingers in their mouth, as well as suck on toys and other objects. But this depends entirely on behaviour, hygiene and actual conditions. According to Survey Report no. 75, babies that crawl around the floor can in certain cases have a daily ingestion of dust and earth of up to 10 grams.
Normally it is estimated that children consume 200 mg earth/day when establishing earth quality-criteria (corresponding to the 95th percentile) and 100 mg earth/day as a daily average (Note by the Kriteriegruppen, 2004; Danish Environmental Protection Agency, 2006). US EPA uses the same value of 200 mg earth/day for children as a conservative estimate, 100 mg earth/day as an average value and up to 400 mg earth/day if 95% of children are to be taken into account (95th percentile) (Nielsen et al, 2008).
Gunnarsen et al 2009, states without referring to the sources that the different sources state that household dust exposure makes up approx. 55% in relation to ingestion of earth. US EPA has assessed that a 2½-year-old child has a daily ingestion of 100 mg household dust in the winter and 50 mg in the summer, when the child spends more time out of doors (US EPA, 1997). In Germany the estimate used is a daily ingestion of dust of 20-100 mg for 1-6-year-old children (Seifert et al in Jensen and Knudsen, 2006).
The CSTEE (Scientific Committee on Toxicity, Ecotoxicity and the Environment) has expressed in an opinion for an assessment report that it is reasonable to use a daily ingestion of earth and/or dust of 200 mg/day (CSTEE, 2003).
On the basis of using between 100 and 200 mg earth when establishing earth quality-criteria, coupled with the fact that several sources state similar values for the ingestion of household dust, it has been decided to use a daily ingestion value of 100 mg dust (for the winter scenario). A value of 50 mg household dust/day (for the summer scenario) is used in order to account for a possible lower ingestion during the summer.
7.5.2 Other sources of exposure
7.5.2.1 Phthalates, generally
The human exposure to phthalates from foods is estimated via the EFSA assessment and the report from Müller et al (2003). This estimate is aimed at Danish conditions and encompasses the group of 1-6-year-olds, to which the target group of 2-year-olds belongs.
Data on exposure have been searched for in the literature from 2003 until the present day. It should be noted that phthalates can have been replaced with other substances in the meantime, e.g. in household plastic film and screw caps, and that from 2008 lower threshold limits have been set for set-off from food contact materials and articles.
One of the references found, Schettler (2006), highlights medicinal devices as a source of phthalates due to the use of phthalate-softeners (Schettler, 2006). However, these sources must be considered as sporadic, and do not occur commonly in the 2-year-old population in general, therefore these sources have not been taken into account in this report.
Schettler (2006) also points at oven baking of plasticine as a source of inhalation of phthalates, which can be relevant for 2-year-olds. The release of phthalates from baking Sculpey and Fimo-plasticine with 3.5 and 14% phthalates, respectively, resulted in indoor air concentrations of 32-2667 µg/m3 for BBP; not detected to 6670 µg/m3 for DNOP; and 6.05-4993 µg/m3 for DEHP. At inhalation of 1 m3 in an hour, which according to the US EPA is realistic for children under 18 years (for short-term exposure), the maximum inhalation exposure to be used is 2667 µg BBP, 6670 µg DNOP and 4993 µg DEHP (Schettler, 2006).
With regard to dust, reference is made to a survey from 2004 in which the concentration of DEHP in household dust was investigated together with the content of DEHP metabolites in children's urine. No correlation was found between the amount in urine and the amount in household dust, which according to the survey indicates that household dust does not constitute a significant source of the total DEHP exposure. The age of the children examined is not stated in the survey. It makes a significant difference if one is dealing with young children, because it must be assumed that their ingestion of dust is larger than that of older children.
A second survey from 2003 found a significant correlation between exposure via air, measured with person-borne measuring devices, and release of DEP, DBP and BBP in women's urine (Schettler, 2006). This indicates that inhalation can be a significant exposure pathway for the low-molecular-weight phthalates in women, but provides no information on 2-year-olds.
A recent Norwegian survey by Rakkestad et al. (2007) has found phthalates in household dust on university premises, in schools, in day-care institutions and households related to the particle size. The most dominating phthalate is DBP, both on the PM25 and the PM1019-fraction. The highest levels of total-phthalates were found in a children's room, a day-care institution, two schools as well as a computer room. The relative share of total-phthalates was approx. 1.1% for both particle-size fractions. Despite the fact that DBP can be found in car tires, Rakkested et al. (2007) performed an analysis on DBP in household dust and have concluded that it does not originate from car tires, but that the sources are to be found in indoor materials.
7.5.2.2 Parabens in general 99-96-7
In foods
The use of methyl-, ethyl- and propylparabens as additives in certain foods was permitted until 15 February 2008. Propylparaben has since been banned as an additive, but only methyl- and ethylparabens are still allowed, although only in the following foods:
- Jelly coat of meat products and pâté: 1000 mg/kg.
- Surface treatment of dried meat products: as much as is necessary (q.s.).
- Grain- or potato-based snacks, nuts and comfiture (except chocolate): 300 mg/kg
- Liquid supplements: 2000 mg/kg.
Parabens are not, and were not, permitted in beverages.
Parabens have the following E numbers:
- Methylparaben: E218 and E219 (Na salt).
- Ethylparaben: E214 and E215 (Na salt).
- Propylparaben: E216 and E217 (Na salt).
A rough estimate of the ingestion in the EU for adults and children has shown that an ADI of 10 mg/kg BW/day is not exceeded (NNT, 2000). In 2004 the EFSA reviewed the ADI of parabens and found that propylparaben could no longer be included in the ADI of 10 mg/kg BW/day (EFSA, 2004). The EFSA could at that time not establish an ADI for propylparaben (EFSA 1-26). The use of propylparaben in foods was thus banned after the 15 February 2008.
Parabens (4-Hydroxybenzoic acid, its salts and esters) may be used in products regulated by the statutory order on cosmetics in amounts up to 0.4% by product weight for one ester and up to 0.8% for mixtures of esters (calculated as the acid) (BEK 422, 2006).
It is very difficult to estimate the exposure via skin, since there is disagreement on how much can be absorbed via the skin. In the most recent statement on parabens by the SCCP from 2008, the industry assesses that the absorption of unreacted butylparaben is approx. 1% of the content in the formulations that come into contact with the skin (SCCP, 2008). It is thought that the skin is capable of converting parabens to conjugated metabolites, and that the metabolites can subsequently be found in the urine, but so far, no safe methods exist to correlate the amount of metabolite in the urine with oral exposure and exposure via skin (Ye, 2006).
Darbre and Harvey (2008) points to the fact that certain surveys suggest that after multiple applications on the skin, parabens may accumulate in the skin and later be absorbed therefrom, either in the unreacted form or as miscellaneous metabolites. The SCCP have in their statement chosen to disregard the survey (El Hussein et al., 2007) which the claim is based on, because the survey is thought to be vitiated by errors and omissions.
Darbre and Harvey (2008) further suggest that there are significant variations in the conversion of parabens (esterase activity) in the liver amongst individuals, which is probably reflected in the skin. Ethanol in formulations for application on skin has been shown to increase the absorption of parabens through the skin, inhibit the hydrolysis of methylparaben to p-hydroxybenzoic acid (the common metabolite of all parabens) as well as promote transformation (transesterification) of methylparaben to butylparaben.
Studies have also been performed on moisturising creams containing 2% butylparaben, where skin absorption has been shown to occur. According to current legislation, only 0.4% butylparaben is permitted as an affitive to creams which complicates the interpretation of the results (Darbre P and Harvey PW 561-78). Given the data currently available it is not possible to give accurate and meaningful quantitative estimates for exposure to parabens via the skin.
The SCCP is awaiting new data from the industry on the dermal uptake of parabens.
In consumer products
Propylparaben, butylparaben and isobutylparaben, which have been selected for exposure calculations in this project due to their oestrogen-like effects in animal experiments, are included in common cosmetic products but, from previous studies, have also been identified in makeup kits for children sold in toy stores. Parabens are thus expected to be found in products like Shrovetide/Halloween makeup, etc.
In Survey Project no. 88 on cosmetic products for children, parabens were identified in a large numbers of the 208 different cosmetic products for children, where the content labelling was reviewed (Poulsen & Schmidt, 2007):
- Methylparaben (in 79 products) – is not surveyed further here
- Propylparaben (in 70 products)
- Butylparaben (in 48 products)
- Ethylparaben (in 46 products) – is not surveyed further here
- Isobutylparaben (in 39 products).
7.6 Calculation of exposure
As described in the chapter on exposure calculations, these have been performed for a summer scenario and a winter scenario because it is assumed that there is a difference between the duration of the dermal contact with toys in the summer and winter periods, as well as a difference in the contact with other products like sunscreens and rubber clogs.
In the calculations it is assumed that there is both dermal and oral contact with the products. For toys it is assumed that there are 9 hours of dermal contact and 3 hours of oral contact (in the summer scenario). This is only valid for toys and similar items that the child alternately holds and sucks. For footwear, for example, the calculation encompasses dermal exposure but not oral intake.
For each substance, the assumptions in the calculations on pre-existing data are described. No mention was made of the weight of the products in the existing data, hence it was necessary to use an estimate of this weight in the calculations. Likewise, the percentage of the products that the 2-year-old is in contact with was estimated. It was estimated that the 2-year-old sucks an area smaller than the area of dermal contact, i.e. in the calculation it is assumed that the child sucks 50% of the area with which it has dermal contact.
Another problem is that most of the data that exists from earlier studies are quantitative analyses of the contents of the material, but not of the substances released (migration). Therefore, migration analyses have only been performed in very few cases. The migration data that is available has been used in the calculations, where applicable.
When using migration data measured over a short period (often a few hours) it is assumed that the migration from the product occurs at a constant rate. For some products this means an overestimate of the daily ingestion of the substance that migrates from the product. This will be valid for erasers and bath mats, for example, products with which there is contact for a longer period of time. The measured migration does not continue indefinitely since more substance than that contained in the product cannot migrate. For products such as toys, rubber clogs, pacifiers, jackets and mitts, the calculation results more closely reflect the actual situation, because these are product groups from which new products are used constantly, thus exhibiting new migration. Children constantly get new toys, new clothes and shoes because they outgrow the old.
There is a difference between the calculation results and the numbers that the individual surveys stated for exposure contribution from air, dust, toys and foods, for example. These numbers vary quite naturally, as a consequence of the variations in the data employed in the surveys, the measurement methods used, biological variations, and the differences in the methods used to calculate the results. For example, in the EU risk assessments (RAR) values are given for indoor air (aerosol + gas phase) that do not include indoor climate dust, whereas other sources have included the contribution from dust. In addition, there are differences in how the sources have included respirable dust (i.e. swirled up in air) and the dust that is ingested in by finger sucking.
7.6.1 Exposure calculations for the selected substances via the indoor climate
In the following chapter the exposure to the selected substances via the indoor climate is calculated. In order to calculate the risk of exposure to chemical substances from the indoor climate, the NOAEL and DNEL are used. These values are given in the chapters on the individual substances. For PCBs, only exposure has been calculated, because it is not known whether these are dioxin-like PCBs or non-dioxin-like PCBs, and the NOAEL and effects for the two substance groups are different.
7.6.1.1 Dust
For the calculations of the exposure of the 2-year-old children to the selected substances via indoor climate dust, an oral ingestion of 50 or100 mg household dust is used for the summer and winter scenario, respectively. The daily exposure per kg body weight is obtained by multiplying the 50 or 100 mg household dust by the maximum measured concentration of the substances in the household dust and dividing it by 15.2 kg, which is the average weight for a child of age 2 years. The calculations assume 100% ingestion, since it is assumed that the 2-year-old ingests the dust by finger sucking. Furthermore, when these values were discussed in chapter 7.5.1, the values were given in terms of daily oral ingestion of dust.
Not many data have been obtained concerning the question of whether all the dust is absorbed or whether some dust is excreted in an unreacted fashion. Wormuth et al (2006) refers to an older source (Hawley, 1985) in which it is stated that a matrix of earth reduces the uptake of a specific chemical to about 15% [20]. If this source (Hawley, 1985) is further examined, the 15% originate from dermal contact (uptake). The same source states that a matrix of earth reduces the uptake of a chemical by 50%. In the source it is stated that this factor will be different for every substance. In a more recent article on brominated flame retardants (PBDEs) and experiments on rats, it was discovered that PBDE is easily taken up from dust and distributed in rats. On that basis, the survey concludes that household dust is a source of human PBDE exposure, which it is necessary to take into account (Huwe et al, 2008). DEHP is easily taken up, and experiments on rats appear to indicate that the method of application does not matter, which implies the uptake should be the same regardles of whether ingestion is via sucking on toys or via ingestion of dust. These numbers are substantiated by Björklund et al. (2009) that used intake of between 100 and 200 mg dust/day for young children (toddlers), and 100% absorption of PFOS/PFOA from the dust that is ingested. Based on this the possibility of all the substance in the dust being taken up cannot be excluded.
Tabel 7.6 Daily ingestion of selected substances via household dust based on maximum measured values for the indoor climate.
| Substance | Ingestion of household dust per day | Max. measured value in household dust[22] (µg/g) | Comment | Average weight, 2-year-old child | Daily ingestion (µg/kg BW/day) |
Calculated DNEL (mg/kg BW/day) |
RCR |
| DEHP | 100 mg | 4[21]0459 | Max. value | 15.2 kg | 266.2 | 0.05 | 5.32 |
| 50 mg | 40459 | Max. value | 15.2 kg | 133.1 | 0.05 | 2.66 | |
| DINP | 100 mg | 40667 | Max. value | 15.2 kg | 267.5 | 1.6 | 0.17 |
| 50 mg | 40667 | Max. value | 15.2 kg | 133.8 | 1.6 | 0.08 | |
| DBP | 100 mg | 5446 | Max. value | 15.2 kg | 35,8 | 0.0067 | 5,35 |
| 50 mg | 5446 | Max. value | 15.2 kg | 17,9 | 0.0067 | 2,67 | |
| DIBP | 100 mg | 3810 | Max. value | 15.2 kg | 25.1 | 1.25 | 0.02 |
| 50 mg | 3810 | Max. value | 15.2 kg | 12.5 | 1.25 | 0.01 | |
| BBP | 100 mg | 45549 | Max. value | 15.2 kg | 299.7 | 0.5 | 0.60 |
| 50 mg | 45549 | Max. value | 15.2 kg | 149.8 | 0.5 | 0.30 | |
| PCBs (US data) | 100 mg | 67.3 | Max. value | 15.2 kg | 0.44 | ||
| 50 mg | 67.3 | Max. value | 15.2 kg | 0.22 | |||
| PCBs (Danish data) |
100 mg | 0.171 | Max. value | 15.2 kg | 0.0011 | ||
| 50 mg | 0.171 | Max. value | 15.2 kg | 0.0006 | |||
| Butylparaben | 100 mg | 3.92 | Max. value | 15.2 kg | 0.03 | 0.03 | 0.0009 |
| 50 mg | 3.92 | Max. value | 15.2 kg | 0.01 | 0.03 | 0.0004 | |
| Bisphenol A | 100 mg | 17.6 | Max. value | 15.2 kg | 0.12 | 0.5 | 0.0002 |
| 50 mg | 17.6 | Max. value | 15.2 kg | 0.06 | 0.5 | 0.0001 |
Example calculation for DEHP:
Daily ingestion of
![]()
= 266.2 µg/kg BW/day
![]()
The RCR value exceeds 1 for DEHP, DBP and PCBs when using the maximum values (and the 95th percentile for DBP), irregardless of whether an ingestion value of 50 or 100 mg dust/day is used.
It should be noted that the stated max. concentration of PCB in dust comes from American surveys. In addition, it appears that the stated maximum values for PCBs are not normal. In the American study, measurements were made in 120 households, and the median value is stated to be below the detection threshold of 0.2 µg/g. The median is the middle value in the survey; this means that in at least half of the households the measured levels of PCB were under the detection threshold. A 95th percentile was not given in the study.
The use of PCB has been banned for some years. A single Danish survey was found that also covers normal households. The measurements from 5 different Danish households with PCB in the building materials yielded results that are approx. 1000 times below the maximum measured American value. It should be noted, however, that the Danish study does not cover a representative sample of Danish households (it only uses measurements from 5 households), whereas the American survey, with its 120 measurements, gives a more reasonable representation of the possible differences.
For the calculations of PCB taken in via dust from Danish homes, only 5 measurements from private households were made, and no measurements were made in public buildings. In public buildings, the measured concentrations of PCB in dust have been up to 10 times higher.
The 95th percentile:
A number of studies do not state the maximum measured concentration, but only the 95th percentile. However, there can be significant differences between the 95th percentile and the maximum values (Rudel et al, 2003), which can be discerned from the table, in which, according to Bornehag et al. 2004, the difference between the maximum measured value of DEHP and the 95th percentile is a factor of 10.
The same calculation (where applicable) has thus also been performed for the 95th percentile, provided the value is available (which is not the case for PCB, DBP, butylparaben and Bisphenol A).
Table 7.7 Daily ingestion of selected substances via household dust on the basis of measured values for the indoor climate (95th percentile values).
| Substance | Ingestion of household dust per day | 95th percentile in household dust (µg/g) | Comments | Average weight, 2-year-old child | Daily ingestion (µg/kg BW/day) |
Calculated DNEL (mg/kg BW/day) |
RCR |
| DEHP | 100 mg | 7063 | 95th percentile | 15.2 | 46.5 | 0.05 | 0.93 |
| 50 mg | 7063 | 95th percentile | 15.2 | 23.2 | 0.05 | 0.46 | |
| DINP | 100 mg | 1930 | 95th percentile | 15.2 | 12.7 | 1.6 | 0.008 |
| 50 mg | 1930 | 95th percentile | 15.2 | 6.3 | 1.6 | 0.004 | |
| DBP | 100 mg | 568 | 95th percentile | 15.2 | 3.7 | 0.0067 | 0.56 |
| 50 mg | 568 | 95th percentile | 15.2 | 1.9 | 0.0067 | 0.28 | |
| DIBP | 100 mg | 311 | 95th percentile | 15.2 | 2.05 | 1.25 | 0.002 |
| 50 mg | 311 | 95th percentile | 15.2 | 1.02 | 1.25 | 0.001 | |
| BBP | 100 mg | 1560 | 95th percentile | 15.2 | 10.3 | 0.5 | 0.02 |
| 50 mg | 1560 | 95th percentile | 15.2 | 5.1 | 0.5 | 0.01 | |
| PCBs (US) | 100 mg | 67.3 | Max. value | 15.2 | 0.44 | ||
| 50 mg | 67.3 | Max. value | 15.2 | 0.22 | |||
| PCBs (Danish data) |
100 mg | 0.171 | Max. value | 15.2 kg | 0.0011 | ||
| 50 mg | 0.171 | Max. value | 15.2 kg | 0.0006 | |||
| Butylparaben | 100 mg | 3.92 | Max. value | 15.2 | 0.03 | 0.03 | 0.0009 |
| 50 mg | 3.92 | Max. value | 15.2 | 0.01 | 0.03 | 0.0004 | |
| Bisphenol A | 100 mg | 17.6 | Max. value | 15.2 | 0.12 | 0.5 | 0.0002 |
| 50 mg | 17.6 | Max. value | 15.2 | 0.06 | 0.5 | 0.0001 |
When the 95th percentile for the few Danish and Swedish studies is used for DEHP and DBP, respectively, the exposure calculations show that the RCR value is less than 1.
The 50th percentile
The corresponding calculation has been performed using the 50th percentile value, giving the corresponding picture:
Tabel 7.8 Daily ingestion of selected substances via household dust based on measured values for the indoor climate (50th percentile values).
| Substance | Ingestion of household dust per day | 50th percentile in household dust (µg/g) | Comments | Average weight, 2-year-old child | Daily ingestion (µg/kg BW/day) |
Calculated DNEL (mg/kg BW/day) |
RCR |
| DEHP | 100 mg | 858 | 50th percentile | 15.2 | 5.6 | 0.05 | 0.113 |
| 50 mg | 858 | 50th percentile | 15.2 | 2.8 | 0.05 | 0.056 | |
| DINP | 100 mg | 0,041 | 50th percentile | 15.2 | 0.0003 | 1.6 | 0.0000002 |
| 50 mg | 0.041 | 50th percentile | 15.2 | 0.0001 | 1.6 | 0.00000008 | |
| DBP | 100 mg | 150 | 50th percentile | 15.2 | 0.99 | 0.0067 | 0.15 |
| 50 mg | 150 | 50th percentile | 15.2 | 0.49 | 0.0067 | 0.07 | |
| DIBP | 100 mg | 1.91 | 50th percentile | 15.2 | 0.0126 | 1.25 | 0.00001 |
| 50 mg | 1.91 | 50th percentile | 15.2 | 0.0063 | 1.25 | 0.000005 | |
| BBP | 100 mg | 330 | 50th percentile | 15.2 | 2.2 | 0.5 | 0.004 |
| 50 mg | 330 | 50th percentile | 15.2 | 1.1 | 0.5 | 0.002 | |
| PCBs | 100 mg | < 0.6 | 50th percentile | 15.2 | 0.004 | ||
| 50 mg | < 0.6 | 50th percentile | 15.2 | 0.002 | |||
| PCBs (Danish data) |
100 mg | 0.111 | 50th percentile | 15.2 kg | 0.0007 | ||
| 50 mg | 0.111 | 50th percentile | 15.2 kg | 0.0004 | |||
| Butyl paraben |
100 mg | < 0.2 | 50th percentile | 15.2 | 0.001 | 0.03 | 0.00004 |
| 50 mg | < 0.2 | 50th percentile | 15.2 | 0.0007 | 0.03 | 0.00002 | |
| Bisphenol A | 100 mg | 0.821 | 50th percentile | 15.2 | 0.005 | 0.5 | 0.00001 |
| 50 mg | 0.821 | 50th percentile | 15.2 | 0.0027 | 0.5 | 0.000005 |
*) Note that some surveys provide a median value or a 50th percentile. This is an expression for the same value, i.e. the value where one half of the values lie below and the other half of the values lies above.
It should be noted that the value of the 50th percentile for PCB that was used is greater than the maximum value by a factor of 5 in the Danish study on households, but approximately 2½ times smaller than the maximum measured in a Danish public building (Gannarsen et al, 2009) that could represent some of the institution buildings which 2-year-olds stay in. In the new Danish survey only 10 random samples were performed (5 from Danish households and 5 from public buildings), which is why the measured results must be viewed with considerable reservations.
7.6.1.2 Air
According to the REACH Guidance document, Chapter R.15 “Consumer exposure estimation” (ECHA, May 2008), 2-3-year-old children inhale 7 m3 air per day.
A normal Dane spends on average 80 to 90% of the time inside (Luk luften ind, 2007). This corresponds to between 19.2 and 21.6 hours per day. 2-year-old children will often spend more time outdoors than an average Dane (some even take a nap outside). In the calculations it is assumed that 2-year-old children on average spend 19 hours inside per day and that the respirable fraction for all substances is 1 (100%). Hereafter it is possible to calculate the daily ingestion via inhalation using the formula given in Chapter 1 “Exposure Scenarious – methods”, which is reproduced below.
![]()
where
| Dinh | Inhaled daily dose | mg/kg BW/day |
| Fresp | Inhaled substance, i.e. the respirable fraction (decimal fraction between 0-1) | |
| Cinh | Concentration of the substance in the air of the room | mg/m5 |
| Tcontact | Duration of exposure per event | hours |
| IHair | Ventilation rate of person | m3/day |
| n | Number of exposures (events) | per day |
| BW | Body weight (BW) | Kg |
The values used in the calculations, as well as the results of the calculations are presented in Table 7.8. It can be seen that none of the substances exceed the RCR value of 1. However, the contribution from the indoor air needs to be added to the contribution via the dust in order to obtain the total exposure via the indoor climate.
Tabel 7.9 Daily ingestion of selected substances via the indoor air based on maximum measured values for the indoor climate
| Substance | Fresp | Max measured concentration in air (µg/m3) | Comments | IH air (m3/day) |
Tcontact (hours) | Average weight, 2-year-old child | Daily inhalation (µg/kg BW/day) |
RCR |
| DEHP | 1 | 1 | Max. value | 7 | 19 | 15.2 kg | 0.36 | 0.0073 |
| DINP | 1 | - | Max. value | 7 | 19 | 15.2 kg | - | |
| DBP | 1 | 1.1 | Max. value | 7 | 19 | 15.2 kg | 0.40 | 0.0599 |
| DIBP | 1 | 1.43 | 95th percentile | 7 | 19 | 15.2 kg | 0.52 | 0.0004 |
| BBP | 1 | 0.48 | Max. value | 7 | 19 | 15.2 kg | 0.18 | 0.0004 |
| PCBs (US) | 1 | 0.0353 | Max. value | 7 | 19 | 15.2 kg | ||
| PCBs (DK) | 1 | 0.0119 | Max. value | 7 | 19 | 15.2 kg | ||
| Butyl paraben |
1 | 0.0032 | Max. value | 7 | 19 | 15.2 kg | 0.001 | 0.00004 |
| Bisphenol A | 1 | - | - | - | - |
Example calculation for DEHP:
Daily ingestion of DEHP ![]()
= 0.36 µg/kg BW/day
The corresponding values for the 95th and 50th percentiles / median values are given in the table below.
Tablel 7.10 Daily ingestion of selected substances via the indoor air based on the 95th percentile values for the indoor climate.
| Substance | Fresp | Max measured concentration in air (µg/m3) | Comments | IH air (m3/day) |
Tcontact (hours) | Average weight, 2-year-old child | Daily ingestion (µg/kg BW/day) |
RCR |
| DEHP | 1 | 0.49 | 95th percentile | 7 | 19 | 15.2 kg | 0.18 | 0.0036 |
| DINP | 1 | - | - | 7 | 19 | 15.2 kg | - | - |
| DBP | 1 | 1.04 | 95th percentile | 7 | 19 | 15.2 kg | 0.38 | 0.0566 |
| DIBP | 1 | 1.43 | 95th percentile | 7 | 19 | 15.2 kg | 0.52 | 0.0004 |
| BBP | 1 | 0.27 | 95th percentile | 7 | 19 | 15.2 kg | 0.10 | 0.0002 |
| PCBs (US) | 1 | 0.0353 | Max. value | 7 | 19 | 15.2 kg | 0.01 | |
| PCBs (DK) | 1 | 0.0119 | Max. value | 7 | 19 | 15.2 kg | 0.004 | |
| Butyl paraben |
1 | 0.0032 | Max. value | 7 | 19 | 15.2 kg | 0.001 | 0.00004 |
| Bisphenol A | 1 | - | - | - | - |
Table 7.11 Table . Daily intakeingestion of selected substances via the indoor air on the basis of the 50th percentile values for the indoor climate.
| Substance | Fresp | Max measured concentration in air (µg/m3) | Comments | IH air (m3/day) |
Tcontact (hours) | Average weight, 2-year-old child | Daily ingestion (µg/kg BW/day) |
RCR |
| DEHP | 1 | 0.19 | 50th percentile | 7 | 19 | 15.2 kg | 0.07 | 0.0014 |
| DINP | 1 | - | - | 7 | 19 | 15.2 kg | - | |
| DBP | 1 | 0.48 | 50th percentile | 7 | 19 | 15.2 kg | 0.18 | 0.0261 |
| DIBP | 1 | 0.5 | 50th percentile | 7 | 19 | 15.2 kg | 0.18 | 0.0001 |
| BBP | 1 | 0.27 | 50th percentile | 7 | 19 | 15.2 kg | 0.10 | 0.0002 |
| PCBs (US) | 1 | < 0.003 | 50th percentile | 7 | 19 | 15.2 kg | 0.001 | |
| PCBs (DK) | 1 | 0.0042 | 50th percentile | 7 | 19 | 15.2 kg | 0.002 | |
| Butyl paraben |
1 | < 0.004 | 50th percentile | 7 | 19 | 15.2 kg | 0.001 | 0.00005 |
| Bisphenol A | 1 | - | - | - | - |
Once again it should be noted that the used maximum value for PCB is greater than the maximum value measured in the Danish survey by a factor of 3, whereas the used 50th percentile for PCB is approximately equal to the maximum value measured in the Danish survey based on private households (Gunnarsen et al, 2009). On the other hand, the maximum measurement from the Danish survey on public buildings is approx. 1.5 times greater than the values used from the American households.
7.6.1.3 Comparison of dust and air
If the daily exposure concentrations from deposited dust are compared with the daily exposure concentration from the indoor air, it can be seen that the contribution from the deposited dust constitutes the largest part of the daily exposure. For phthalates the exposure occurs mostly via the deposited dust, whereas for PCBs and butylparaben the indoor air contributes a few percent, which may also include the air-borne dust particles.
Table 7.12 Daily exposure concentration from air as percent of daily exposure concentration from dust (for the max. conc. At 100 mg dust ingestion)
| Substance | Percent of dust ingestion |
| DEHP | 0.1% |
| DINP | Not measured in air |
| DBP | 1.1% |
| DIBP | 2.1% |
| BBP | 0.1% |
| PCBs | 2.9% |
| Butylparaben | 4.5% |
7.6.1.4 Total contribution from the indoor climate
The total contribution from the indoor climate is the sum of the contribution from the dust and from the air. The total contribution from the indoor climate is given in the table below for both the 50th percentile and the 95th percentile.
Table 7.13 Daily contribution of selected substances via the indoor climate (dust and air) based on the 95th percentile (or the max. value if no 95th percentile is available) and 50 or 100 mg dust, respectively.
| Substance | Daily ingestion at 100 mg dust (µg/kg BW/day) |
RCR (at 100 mg dust) |
Daily ingestion at 50 mg dust (µg/kg BW/day) |
RCR (at 50 mg dust) |
| DEHP | 46.65 | 0.93 | 23.41 | 0.47 |
| DINP | 12.70 | 0.008 | 6.35 | 0.004 |
| DBP | 4.08 | 0.62 | 2.28 | 0.34 |
| DIBP | 2.57 | 0.002 | 1.54 | 0.001 |
| BBP | 10.36 | 0.02 | 5.23 | |
| PCBs (total), US | 0.46 | 0.23 | ||
| PCBs (total), DK (max) | 0.0055 | 0.0049 | ||
| Butylparaben (max) | 0.03 | 0.001 | 0.01 | 0.0005 |
| Bisphenol A (max) | 0.12 | 0.0002 | 0.06 | 0.0001 |
Table 7.14 Daily ingestion of selected materials through the indoor climate (dust and air) based on the 50th percentile and 50 or 100 mg dust, respectively
| Substance | Daily ingestion at 100 mg dust (µg/kg BW/day) |
RCR (at 100 mg dust) |
Daily ingestion at 50 mg dust (µg/kg BW/day) |
RCR (at 50 mg dust) |
| DEHP | 5.71 | 0.11 | 2.89 | 0.06 |
| DINP | 0.0003 | 0.0000002 | 0.00013 | 0.00000008 |
| DBP | 1.17 | 0.18 | 0.67 | 0.10 |
| DIBP | 0.19 | 0.0002 | 0.19 | 0.0002 |
| BBP | 2.27 | 0.005 | 1.18 | 0.002 |
| PCBs (total), US | 0.01 | 0.003 | ||
| PCBs (total), DK | 0.002 | 0.002 | ||
| Butylparaben | 0.003 | 0.0001 | 0.002 | 0.07 |
| Bisphenol A | 0.01 | 0.00001 | 0.003 | 0.000005 |
A common factor for all the studies is the extremely large variation between the different measurements – e.g. from just detectable and up to > 40,000 µg/g DEHP in Swedish house dust. There are some households in which the concentration of phthalates is relatively high and will contribute more to the total exposure to endocrine disruptors.
7.7 Risk assessment of the individual substances
The risk assessment of the selected substances is based on the NOAEL/LOAEL values and the assessment factor (AF), that the Danish Environmental Protection Agency has chosen in conjunction with the Food Institute DTU. The NOAEL/LOAEL values are based on endocrine disrupting effects, but not on the critical effects that the Danish Environmental Protection Agency traditionally uses to make risk assessments.
The aim has been to select NOAEL/LOAEL values that are used for endocrine disrupting effects in the EU risk assessments, EFSA opinions or other official risk assessments. In many cases, the employed results come from studies where the effects have been observed after the animals have been exposed to the substances during the foetal stage. One can question the assumption of whether 2-year-old children can be expected to be equally sensitive towards endocrine disrupting effects as in the foetal stage. There is insufficient knowledge about this relationship at the current stage. As long as there is no counter-evidence for this, then the use of NOAELs/LOAELs from experiments with exposure of foetuses to formulate the risk assessment of the exposure of 2-year-old children is deemed a reasonable (although careful) approach to the problem.
The group of antiandrogenic substances comprises:
- DIBP, di-isobutyl phthalate, 84-69-5
- DBP, dibutyl phthalate, 84-74-2
- BBP, benzyl butyl phthalate, 85-68-7
- DEHP, diethylhexyl phthalate, 117-81-7
- DINP, di-isononyl phthalate, 28553-12-0
- Prochloraz, 67747-09-5
- Tebuconazole, 107534-96-3
- Linuron, 330-55-2
- Vinclozolin, 50471-44-8
- Procymidone, 32809-16-8
- PCBs
- Dioxins
- DDT.
The group of oestrogen-like substances comprises:
- Propylparaben, 94-13-3
- Butylparaben, 94-26-8
- Isobutylparaben, 4247-02-3
- Bisphenol A, 80-05-7.
The calculations and risk assessment are performed for each substance in the following section.
7.7.1 DIBP, di-isobutyl phthalate, 84-69-5
Table 7.15 Identification of DIBP
| Chemical name | di-isobutyl phthalate |
| CAS no. | 84-69-5 |
| EINECS no. | 201-553-2 |
| Molecular formula (gross) | C16-H22-O4 |
| Molecular structure |  |
| Molecular weight | 278.3435 |
| Synonyms | Diisobutyl phthalate, 1,2-Benzenedicarboxylic acid, bis(2-methylpropyl) ester, DIBP |
| Classification | Repr. Cat. 2; R61 - Repr. Cat. 3; R62 (EU, ESIS, 2009) |
7.7.1.1 NOAEL, AF and DNEL
For DIBP a NOAEL of 125 mg/kg BW/day (LOAEL 250 mg/kg/d) for anti-androgenicity is chosen, based on reduced anogenital distance (AGD) and increased retention of nipples in offspring of rats exposed during pregnancy (Sallenfait et al., 2008).
The combined assessment factor is set to 100 based on a factor 2.5 for general interspecies differences, 4 for allometric scaling between rats and humans, and 10 for intraspecies differences.
Thus, DNEL for DINP becomes 1.25 mg/kg BW/day (NOAEL/AF).
7.7.1.2 General exposure
Wormuth et al. (2006) estimates a daily internal exposure of approx. 0.08-4 µg/kg BW with a median of approx. 0.8 µg/kg BW/day for 1-3-year-olds. Approx. 60% of the exposure comes from foods, 30% from sucking on things like toys and 10% from inhalation of air. Note that the data basis for assessment of the exposure from foods is very limited.
7.7.1.3 Exposure to DINP from foods
DIBP in foods can stem from the environment as well as from use in materials in contact with food.
The exposure estimate of Wormuth et al. (2006) is 60% exposure via food of an internally totalled exposure of approx. 0.08 – 4 µg/kg BW with a median of approx. 0.8 µg/kg BW/day for 1-3-year-olds. This gives a 50th percentile of 0.48 µg/kg BW/day and a maximum exposure of 2.4 µg/kg BW/day.
Neither EFSA, Müller et al. (2003) nor the EU RAR gives data for the exposure to DIBP via foods, and therefore the Wormuth et al. estimate is used in the total calculations for this report.
7.7.1.4 Exposure from consumer products
DIBP has been found through earlier surveys and in two of the examined product groups in this project. The table below presents the products in which DIBP has been found in this project, and previously.
Table 7.16 occurrence of DIBP in consumer products
| Occurrence of DIBP in earlier surveys | Occurrence of DIBP in product groups tested in this project |
| Toys (wooden toys) Toys (sword of foam plastic) Toys (floor jigsaw made of foam plastic) Toys (mask made of foam plastic) Toys (book made of foam plastic) Toys (Winnie the Pooh picnic table) Play bags Rubber pacifiers Baby changing mats/cushions Swimming board |
Jacket (outer material) Rubber clogs |
As the table shows, DIBP was found in toys that were examined from 2004 onwards, (i.e. published in the year 2004 or later, so the surveys themselves are probably from 2003 and later). The study on rubber pacifiers is from 1999.
DIBP was not included in the previous statutory order on Phthalates (BEK 786, 2006), which came into force on 16 April 2007 (BEK 1074, 2006).
Measured values and migration values
The two tables below present the measured values of DIBP in the various products previously examined, and the products studied in this project.
As the first table illustrates, migration of DIBP is only measured in rare cases in the products tested in earlier surveys.
Table 7.17 Overview of surveys analysing for content of DIBP
Table 7.18 Overview of findings of DIBP in the products analysed in this project
| Product type + no. | Screening analysis, ug/g | Quantitative analysis, ug/g | Migration analysis, ug/g | Migration period | Migration fluid |
| jacket no. 1-2, outer material | 18 | n.a. | 0.04 | 3 | Saliva |
| Rubber clog no. 3-1 | 3000 | 670 | 84 | 6 | Sweat |
n.a.: Product or material not selected for analysis.
The earlier surveys have supplied information on the contents of DIBP in eight different consumer products. The measured concentrations vary between 2.9 (sword of foam plastic) and 314 mg/kg (floor jigsaw).
In baby changing mats/cushions up to 70 mg/kg of DIBP has been found (However, this value includes both DIBP and DBP, indicating that a conclusive identification had not been made). DIBP has also been found in rubber pacifiers at a level of 1 µg per pacifier.
In the earlier surveys, migration analyses were only conducted for wooden toys, an eraser and a play bag. The highest migration values were identified in wooden toys (jigsaws) and a play bag at 14 and 15 mg/kg respectively.
In this project DIBP has been identified in the outer material of a jacket at a concentration of 18 mg/kg and in a rubber clog at a concentration of 670 mg/kg. Migration analyses have been conducted for both products and the values amount to 0.04 mg/kg (outer material, jacket) and 84 mg/kg (rubber clog), respectively.
In this project five different types of rubber clogs have been analysed for phthalate contents. Phthalate content has been identified in three of the five clogs:
- DEHP
- DBP and DEHP and finally
- DIBP and DEHP
Migration analyses have been conducted on two of these rubber clogs (those with the highest contents). Here the results showed that migration of DBP and DIBP occurs (in two different rubber clogs). No migration of DEHP has been demonstrated.
Calculation of exposure - toys
For toys the highest migration value is measured at 15 mg/kg for a play bag.
As noted in the chapter “Exposure scenarios - method”, the calculations assume that dermal contact occurs with the toy for 6 hours in the winter and 9 hours in the summer and that oral ingestion occurs for 3 hours in both scenarios. The maximum level measured in toys is used as a standard value for calculations in all toys, meaning that this worst-case scenario toy is assumed to be used by the 2-year-old during the assumed contact period. Since data for dermal absorption of DIBP is lacking, data concerning DBP is used. DBP and DIBP are similar in several respects, namely in molecular structure, molecule weight and log Kow (estimate from the Danish Environmental Protection Agency), which suggest that the dermal absorptions are alike. Therefore a value of 10% absorption through the skin has been assumed.
It is furthermore assumed that the weight of the play bag is 50 g (a guess, since the value was not stated in the report), and that the 2-year-old is in contact with 10% of the surface area of the play bag and sucks on half of this area. The measured migration of 15 mg/kg is measured over a period of 4 hours and therefore the result has been corrected by a factor 4.
Hence, the value of the exposure from toys on 2-year-olds is:
Daily ingestion of DIBP from toys = dermal absorption (9 hrs) + oral absorption (3 hrs)
![]()
= 2.96 µg/kg BW/day
Similarly, a corresponding RCR value of 0.0024 (i.e. a daily ingestion less than the DNEL value of 1250 µg/kg BW/day) can be obtained.
Calculation of exposure - other objects
Exposure from other products containing DIBP may occur (in addition to the exposure from toys and the indoor climate). For instance, this could be from erasers (mainly if there are older siblings in the household), baby changing mats/cushions, pacifiers and rubber clogs. However, no migration data has been found for DIBP in either pacifiers or baby changing mats/cushions.
Eraser
In the calculations it has been assumed that there is contact with the eraser for 1 minute a day (only if any possible older siblings are doing their homework). In Survey Report no. 84 it is stated that a migration of 1.5 mg/g (per 4 hours) occurs and that the eraser weighs 21.1 g. It is assumed that there is contact with 50% of the eraser.
Baby changing mats/cushions
In Survey Report no. 90 concerning baby products, a migration analysis is conducted for baby changing mats/cushions and data is only stated for DINP, so it is assumed that there has been no migration of DIBP.
Rubber clogs
In this project, migration analyses have been conducted on rubber clogs. A migration of 84 mg/kg for DIBP is found over a period of 6 hours, which is the period of time the rubber clogs are assumed to be worn each day. The weight of the pair of rubber clogs is 64.8 g. Contact with 20-40% of the clog is assumed, as well as the worst case scenario that the child wears no socks with the clogs. Since data for DIBP is lacking, data concerning DBP is applied instead. Therefore a value of 10% absorption through the skin has been assumed. It has furthermore been assumed that the rubber clogs are used for 4-10 hours a day (both indoors as slippers and outdoors).
For the remaining objects, the exposure values are the following:
Table 7.19 Daily ingestion of DIBP from other objects based on measured migration values
7.7.1.5 Exposure from indoor climate
The exposure calculation for DIBP through the indoor climate is presented and calculated in the section concerning indoor climate and is reproduced in the table below.
Table 7.20 Daily ingestion of DIBP through the indoor climate (dust and air) based on 95th percentile
| Material | Daily ingestion at 100 mg dust (µg/kg BW/day) |
RCR (at 100 mg dust) |
Daily ingstioningestion at 50 mg dust (µg/kg BW/day) |
RCR (at 50 mg dust) |
| DIBP | 2.57 | 0.002 | 1.54 | 0.001 |
Table 7.21 Daily exposure to DIBP through the indoor climate (dust and air) based on 50th percentile
| Material | Daily ingestion at 100 mg dust (µg/kg BW/day) |
RCR (at 100 mg dust) |
Daily ingestion at 50 mg dust (µg/kg BW/day) |
RCR (at 50 mg dust) |
| DIBP | 0.19 | 0.0002 | 0.19 | 0.0002 |
The result shows that the RCR value is less than 1, which indicates that there will be no risk of endocrine distrupting effects caused by exposure to DIBP through the indoor climate, whether the dust ingestion contributes 50 or 100 mg dust.
In the table below the various contributions to DIBP are summarised.
7.7.1.6 Combined exposure and risk
Table 7.22 Daily ingestion of DIBP from various sources
| Summer scenario | Winter scenario | |||
| Source | Daily ingestion (µg/kg BW/day) |
RCR | Daily ingestion (µg/kg BW/day) |
RCR |
| Foods combined 50th percentile | 0.48 | 0.0004 | 0.48 | 0.0004 |
| Foods combined max | 2.40 | 0.0019 | 2.40 | 0.0019 |
| Indoor climate combined 50th percentile | 0.19 | 0.0002 | 0.19 | 0.0002 |
| Indoor climate combined 95th percentile | 1.54 | 0.001 | 2.57 | 0.002 |
| Toys | 2.96 | 0.002 | 2.59 | 0.002 |
| Eraser | 0.004 | 0.000003 | 0.004 | 0.000003 |
| Rubber clogs (low) | 23.9 | 0.02** | ||
| Rubber clogs (max) | 47.8 | 0.04 | ||
| Total (50th percentile), low | 27.51 | 0.02** | 3.27 | 0.003 |
| Total (95th percentile), max | 54.66 | 0.04 | 7.56 | 0.006* |
*) Due to a larger number of decimals in the calculations in the complete tables in section 7.88, this 0.006 is rounded up to 0.01 in Table 7.879
**) The number is not found in section 7.88, because only the max values for shoes are applied in the totalled tables in the relevant places.
The combined result for DIBP shows that the RCR value is far less than 1 and therefore, under the assumptions applied in the report, no risk has been identified in either summer or winter time as a result of the combined exposure to DIBP through foods, indoor climate, shoes and other objects included in the present survey.
7.7.2 DBP, dibutyl phthalate, 84-74-2
Table 7.23 Identification of DBP
| Chemical name | Dibutyl phthalate |
| CAS no. | 84-74-2 |
| EINECS no. | 201-557-4 |
| Molecular formula (gross) | C16-H22-O4 |
| Molecular structure |  |
| Molecule weight | 278.3435 |
| Synonyms | Dibutyl phthalate, 1,2-Benzenedicarboxylic acid, dibutyl ester, DBP, Elaol |
| Classification | REP2;R61 REP3;R62 N;R50 (List of hazardous materials) |
7.7.2.1 NOAEL, AF and DNEL
For DBP an LOAEL of 2 mg/kg BW/day (no NOAEL identified) has been chosen for its antiandrogenic effects, based on effects on gamete development and development of mammary tissue in a development study in rats (Lee et al., 2004 in EFSA opinion: EFSA (2005)).
The combined assessment factor is set to 300 based on a factor of 2.5 for general interspecies differences, 4 for allometric scaling between rats and humans, 10 for intraspecies differences, and 3 for LOAEL to NOAEL.
Thus, DNEL for DBP becomes 0.0067 mg/kg BW/day (LOAEL/AF).
7.7.2.2 General exposure
Müller et al (2003) estimates a total exposure of approx. 400 µg/kg BW/day for 1-6-year-olds. Practically all of the exposure is oral, as only approx. 0.4 µg/kg BW/day can be attributed to inhalation.
Wormuth et al. (2006) estimates a daily internal exposure of approx. 0.4-40 µg/kg BW with a median of approx. 4 µg/kg BW /day for 1-3-year-olds. Approx. 55% of the exposure stems from foods, approx. 10% from ingestion of dust, approx. 2% from textiles and approx. 33% from inhalation of air. Note that the data basis for assessment of the exposure from foods is very limited.
The large difference between the two estimates could be caused by two factors:
- The Wormuth estimate is internal, meaning that only the absorbed amounts are considered.
- The Müller estimate is based on the maximal estimated exposure through the environment.
Absorption through the various exposure paths are, according to EU risk assessments and quoted by Müller et al.(2003):
- Dermal: 100%
- Oral: 100%
- Inhalation: 75%.
The RAR (risk assessment report) from the EU for DBP (European Chemicals Bureau, 2004)) which Müller quotes, states no set dermal absorption percentage, but on page 65 refers to an experiment of dermal exposure in rats, which after 24 hours results in 10-12% excretion in the urine, and 1% in the faeces. After 7 days, there is 60% excretion in the urine and 12% in the faeces, giving a total excretion of 72%. This means that absorption must range from 10 to 100%. However, on page 103, the EU RAR considers 10% dermal absorption as the worst case scenario. On the other hand, the RAR applies 100% absorption through inhalation as the default value due to lacking data. It is not known how Müller et al (2003) reaches 75%.
Therefore, in accordance with the EU RAR, the following absorptions are applied in this report:
- Dermal: 10%
- Oral: 100%
- Inhalation: 100%.
7.7.2.3 Exposure to DBP from foods
The presence of DBP in foods can originate from the environment as well as use in materials in contact with food.
Müller et al (2003) estimates a total exposure of approx. 400 µg/kg BW/day for 1 to 6-year-olds. Practically all of the exposure is oral, as only approx. 0.4 µg/kg BW/day can be attributed to inhalation. It does not show, however, how much of the oral exposure is attributed to foods. EFSA (2005) points out that over 90% of these maximal exposure values stem from the highest estimated value of exposure through the local environment, which refers to printing inks, and is thus not related to the diet itself.
Wormuth et al. (2006) estimates a daily internal exposure of approx. 0.4-40 µg/kg BW with a median of approx. 4 µg/kg BW/day for the 1-3-year-olds. Approx. 55% of the exposure stems from foods, approx. 10% from ingestion of dust, approx. 2% from textiles and approx. 33% from inhalation of air. This means that the exposure from foods can be estimated to a median of 2.2 µg/kg BW/day and a maximum of 22 µg/kg BW/day. Note that the data basis for assessment of the exposure from foods is very limited.
EFSA (2005) refers to an estimate based on “the total diet study” in the UK of an exposure through foods for adults of 60 kg at an average of 13 µg/day and the 97.5th percentile at 31 mg/day, equivalent to 0.2 and 0.5 µg/kg BW/day for adults.
Since 2-year-olds according to the NNA(2004) (Nordic nutrient recommendations) have an energy need per body weight at approx. double that of adults, the 0.2 and 0.5 µg/kg BW/day correspond to 0.4 and 1.0 µg/kg BW/day for 2-year-olds.
EFSA (2005) also refers to another estimate based on measurements of Danish meals, in which the average and high exposures for adults were calculated at 4.1 and 10.2 µg/kg BW/day, respectively.
For the 2-year-olds this corresponds to 8.2 and 20.4 µg/kg BW/day, respectively.
Based on a principle of choosing realistic worst case results for the further calculations, an average exposure has been chosen of 8.2 µg/kg BW/day from the Danish meal survey and, as the maximal exposure from foods, 22 µg/kg BW/day from Wormuth et al. (2006).
7.7.2.4 Exposure from consumer products
DBP has been found both through earlier surveys and in some of the examined product groups in this project. The table below presents those products in which DBP has been found in this project and inearlier studies.
Table 7.24 occurrence of DBP in consumer products
| Occurrence of DBP in earlier surveys | Occurrence of DBP in product groups tested in this project |
| Vinyl floors Plasticine Scented toys Toys of foam plastic (sword, floor jigsaw, swimming board, mask, book) Toy (inflatable feeding bottle) Toy (bath dolls) Baby changing mats/cushions Clothes (printing on clothes) |
Jacket (zipper strap) Jacket (loose reflector piece) Rubber clogs |
As the table shows, DBP was found in toys that were examined in 2004 and onwards (meaning published in the year 2004 or later, so the surveys themselves are probably from 2003 and later). The study on plasticine is from 2002.
REACH annex XVII, entry 51 and 52 continued the prohibition of toys containing DEHP, DBP and BBP. In accordance with REACH, the concentration of DBP in a toy must not surpass 0.1% (w/w). This means that those toys examined previously could no longer be sold today due to their high concentrations of DBP. In the earlier surveys, the scented toys exceeded 0.1% DBP.
Analysis values
The two tables below display the measured values of DBP in the various products examined earlier and the products studied in this project.
As illustrated in Table 7.25, migration of DBP from the products was only measured in rare cases in the earlier surveys.
Table 7.25. Overview of earlier surveys analysing for content of DBP
Table 7.26 Overview of findings of DBP in the products analysed in this project
| Product type + no. | Screening analysis, ug/g | Quantitative analysis, ug/g | Migration analysis, ug/g | Migration period, hours | Migration fluid |
| Jacket 1-4, zipper strap | 43 | n.a. | 0.51 | 3 | Saliva |
| Jacket no. 1-5, loose reflector piece | n.s. | 120 | n.a. | n.a. | n.a. |
| Rubber clog 3-3 | 51000 | 25603 | 249 | 6 | Sweat |
n.a.: Product or material not selected for analysis
n.s.: No screening result calculated
The earlier surveys have provided information on the contents of DBP in nine different consumer products. The concentrations measured were between 8 and 780 mg/kg (floor jigsaw), and up to 3500 mg/kg in an eraser (scented toy).
In print on clothes, levels up to 770 mg/kg were found. Additionally, up to 70 mg/kg (measured as DBP + DIBP) was found in baby changing mats/cushions and a higher content of DBP up to 16,000 mg/kg (i.e. 1.6%) was determined in vinyl floors.
In the earlier surveys, migration analyses for plasticine were performed solely by measuring release to the indoor climate (when “baking” plasticine in an oven). Here, release of up to 6 mg/kg was measured. The maximum concentration of DBP was measured at 200 mg/kg.
In this project, DBP has been identified in a zipper strap and a loose reflector piece from two different jackets. On the zipper strap, migration analysis showed that 0.51 mg DBP migrates per kg. In addition to this, DBP has been found in a pair of rubber clogs - at approx. 25,000 mg/kg, and a migration of 249 mg/kg during a migration period of 6 hours.
In this project five different types of rubber clogs have been analysed for phthalate contents. In three of the five rubber clogs, phthalates were identified:
- DEHP
- DBP and DEHP, and finally
- DIBP and DEHP
Migration analyses have been conducted on two of these rubber clogs (those with the highest contents). Here the results showed that migration of DBP and DIBP occurs (in two different rubber clogs). No migration of DEHP has been demonstrated.
Calculation of exposure - toys
With regard to toys no migration has been measured on any of the products, and therefore no calculations of exposure have been performed.
Calculation of exposure - other objects
Exposure from other products containing DBP can occur (in addition to the exposure from toys and the indoor climate). This could, for example, be from erasers (mainly if there are older siblings in the household), baby changing mats/cushions, clothes and rubber clogs. Exposure from a vinyl floor is assumed to be included in indoor climate data.
Eraser
In Survey no. 68 on scented toys, no measurement was made of migration of DBP from the eraser, and therefore no calculations of exposure have been performed.
Baby changing mats/cushions
In survey no. 90 on baby products, a migration analysis was conducted on baby changing mats/cushions. Only data concerning DINP were stated, so it is assumed that there was no migration of DBP.
Clothes
DBP was found in print on clothes in a survey by TÆNK (THINK, magazine), a survey by Greenpeace, and a recent Swedish survey. However, none of the surveys measured migration of DBP, and therefore no calculations of exposure have been performed.
In this project, a migration analysis has been conducted on a zipper strap from a jacket. Here, 0.51 mg DBP migrates per kg over a period of 3 hours. The calculations assume that the strap weighs 5 g, that approx. half of the strap is sucked and that, as described for “other objects”, it is sucked for 3 hours a day.
Rubber clogs
In this project, migration analyses have been conducted on rubber clogs. A migration of 249 mg/kg has been found for DBP over a period of 6 hours. The weight of the pair of rubber clogs is 69.0 g. Contact with 20-40% of the shoe is assumed, as is the idea that the child in the worst case scenario wears no socks with the shoes. It has been assumed that the rubber clogs are used for 4-10 hours a day (both indoors as slippers and outdoors). If the rubber clogs are only used as outdoor shoes, 4 hours is a realistic estimate of the exposure, but if the rubber clogs are used as slippers, an exposure period of 10 hours is not unrealistic. As stated earlier, it is assumed that 10% DBP is absorbed through the skin.
For the remaining objects, the exposure values are the following:
Table 7.27 Daily ingestion of DBP from other objects based on measured migration values
7.7.2.5 Exposure from indoor climate
The exposure calculation for DBP through the indoor climate is presented and calculated in the section relating to indoor climate, but is reproduced in the table below.
Table 7.28 Daily ingestion of DBP through the indoor climate (dust and air) based on 95th percentile
| Material | Daily ingestion at 100 mg dust (µg/kg BW/day) |
RCR (at 100 mg dust) |
Daily ingestion at 50 mg dust (µg/kg BW/day) |
RCR (at 50 mg dust) |
| DBP | 4.08 | 0.62 | 2.28 | 0.34 |
Table 7.29 Daily ingestion of selected materials through the indoor climate (dust and air) based on 50th percentile / median value
| Material | Daily ingestion at 100 mg dust (µg/kg BW/day) |
RCR (at 100 mg dust) |
Daily ingestion at 50 mg dust (µg/kg BW/day) |
RCR (at 50 mg dust) |
| DBP | 1.17 | 0.18 | 0.67 | 0.10 |
Based on the assumptions used in the calculation of the risk, there will be a relatively large exposure from DBP via the indoor climate. The calculations have, however, been based on studies of households in Sweden, as no Danish studies on concentrations of DBP in the indoor climate are available.
7.7.2.6 Combined exposure and risk
The table below summarises the various contributions to DBP.
Table 7.30 Daily ingestion of DBP from various sources
| Summer scenario | Winter scenario | |||
| Source | Daily ingestion (µg/kg BW/day) |
RCR | Daily ingestion (µg/kg BW/day) |
RCR |
| Foods combined 50th percentile | 8.2 | 1.22 | 8.2 | 1.22 |
| Foods combined max | 22 | 3.28 | 22 | 3.28 |
| Indoor climate combined 50th percentile | 0.67 | 0.10 | 1.17 | 0.18 |
| Indoor climate combined 95th percentile | 2.28 | 0.34 | 4.08 | 0.62 |
| Zipper strap, jacket | 0.08 | 0.01 | ||
| Rubber clogs (low = 20% and 4 hours) | 15.07 | 2.25** | ||
| Rubber clogs (max = 40% and 10 hours) | 75.36 | 11.25 | ||
| Total (50th percentile), low | 23.9 | 3.57** | 9.45* | 1.41* |
| Total (95th percentile), max | 99.64* | 14.87* | 26.16 | 3.0* |
*) Due to a larger number of decimals in the calculations in the complete tables in section 7.88, these have smaller round-off deviations
**) The number is not found in section 7.88, because only the max values of shoes are applied in the totalled tables in the relevant places.
The combined result for DBP reveals that the RCR value is far above 1 in both the summer and winter scenarios. This is due to exposure to DBP from foods; shoes in themselves can constitue a risk using the assumptions made in the reports.
7.7.3 BBP, benzyl butyl phthalate, 85-68-7
Table 7.31 Identification of BBP.
| Chemical name | Benzyl butyl phthalate |
| CAS no. | 85-68-7 |
| EINECS no. | 201-622-7 |
| Molecular formula (gross) | C19-H20-O4 |
| Molecular structure |  |
| Molecule weight | 312.3597 |
| Synonyms | benzyl butyl phthalate, 1,2-Benzenedicarboxylic acid, butyl phenylmethyl ester, BBP, Palatinol BB |
| Classification | REP2;R61 REP3;R62 N;R50/53 (List of hazardous materials) |
7.7.3.1 NOAEL, AF and DNEL
For BBP an NOAEL of 50 mg/kg BW/day (LOAEL 250 mg/kg/d) is chosen for its antiandrogenic effects, based on reduced anogenital distance (AGD) in offspring of rats exposed during pregnancy (Tyl et al., 2004 in an EU risk assessment: European Chemicals Bureau (2007)).
The combined assessment factor is set to 100 based on a factor 2.5 for general interspecies differences, 4 for allometric scaling between rats and humans and 10 for intraspecies differences.
Thus, DNEL for BBP becomes 0.5 mg/kg BW/day (LOAEL/AF).
7.7.3.2 General exposure
Müller et al. (2003) estimates an oral exposure of 5.9 µg/kg BW/day and an inhalation exposure of 0.12 µg/kg BW/day for 1-6-year-olds. The estimate for oral exposure is based on measured values in the environment (including foods).
Wormuth et al. (2006) estimates a daily internal exposure of approx. 0.02-6 µg/kg BW with a median of approx. 0.4 µg/kg BW/day. Approx. 18% of the exposure stems from foods, approx. 2% from sucking on things such as toys, approx. 75% from ingestion of dust and approx. 5% from inhalation of air. Note that the data basis for assessment of the exposure from foods is very limited.
Absorption through the various exposure paths are, according to EU risk assessments (European Chemicals Bureau, 2007) and quoted by Müller et al.(2003):
- Dermal: 5%
- Oral: 100%
- Inhalation: 100%.
7.7.3.3 Exposure to BBP from foods, etc.
BBP can be found in foods both as a result of dispersion in the environment and as a consequence of migration from materials in contact with food, in which it is used as a softener.
Müller et al. (2003) estimates an oral exposure of 5.9 µg/kg BW/day and an inhalation exposure of 0.12 µg/kg BW/day for the 1-6-year-olds. The estimate for oral exposure is based on measured values in the environment (including foods). It does not state, however, how much of the oral ingestion that can be attributed to foods.
Wormuth et al. (2006) estimates a daily internal exposure of approx. 0.02-6 µg/kg BW with a median of approx. 0.4 µg/kg BW/day for 1-3-year-olds. Approx. 18% of this exposure stems from foods, approx. 2% from sucking on things such as toys, approx. 75% from ingestion of dust and approx. 5% from inhalation of air. This means that the exposure from foods should to contribute with 0.07 µg/kg BW/day as a median and 1.1 µg/kg BW/day as the highest value.
EFSA (2005a) refers to an estimate based on data on diet and foods from the UK and Denmark, in which the exposure to BBP through foods is estimated at an average of 8 µg/day and 97.5-percentile 20 µg /kg BW/day, which for an adult corresponds to 0.1 and 0.3 µg/kg BW/day, respectively.
Since 2-year-olds according to the NNA(2004) (Nordic nutrient recommendations) have an energy ingestion per kg body weight at approx. the double of that of adults, this corresponds to 0.2 and 0.6 µg/kg BW/day respectively for the 2-year-olds.
EFSA also refers to a Danish survey that estimates an average and a high exposure for adults of 0.4 and 4.5 µg/kg BW/day, respectively.
For 2-year-olds this corresponds to 0.8 and 9 µg/kg BW/day, respectively.
Based on a principle of choosing the most realistic worst case exposures, in the further calculations the EFSA exposure numbers have been included as contributions from foods with the average 0.8 and the highest value 9 µg/kg BW/day.
7.7.3.4 Exposure from consumer products
BBP was only found in earlier surveys and has not been identified in products examined in this project. The table below states the products in which BBP has been found earlier.
Table 7.32 Occurrence of BBP in consumer products
| Occurrence of BBP in earlier surveys | Occurrence of BBP in product groups tested in this project |
| Vinyl floors Plasticine Wooden toy (wooden fishing boat with small components on strings) Clothes (printing on clothes) |
None |
As the table shows, BBP was found in toys that were examined in 2004 onwards (meaning published in the year 2004 or later, so the surveys themselves are probably from 2003 and later). The study on vinyl floors is from 2002.
REACH annex XVII, entry 51 and 52 continued the prohibition of sale of these toys because the concentration of BBP is too high. Plasticine had concentrations of BBP that exceeded 0.1% and according REACH, the concentration of BBP in a toy must not exceed 0.1% (w/w).
Analysis values
The two tables below display the values of BBP that were measured in the various products examined earlier.
As the table illustrates, migration of BBP is only measured in rare cases in the products tested in earlier surveys.
Table 7.33 Overview of earlier surveys analysing for content of BBP
Calculation of exposure
The earlier surveys have supplied information on the contents of BBP in two different kinds of toys - plasticine and wooden toys. The measured concentrations in plasticine are 37,000 mg/kg BBP corresponding to 3.7%. The concentration of BBP was not measured in the wooden toys.
In clothes (print on clothes) up to 22,000 mg/kg BBP has been measured and in vinyl floors up to 20,000 mg/kg BBP.
Migration analyses were performed for the earlier surveys on wooden toys and plasticine. The migration for the wooden toys was measured at 1.3 mg/kg and a migration of BBP to the indoor climate was measured of up to 1,000 mg/kg when “baking” the plasticine in the oven.
As mentioned earlier, BBP has not been identified in the products that have been examined in this project.
Calculation of exposure - toys
For toys the highest migration is measured at 1.3 mg/kg for wooden toys. The values for plasticine are not used in this context since they show release to the indoor climate and not to sweat.
As noted in the chapter “Exposure scenarios - methods”, the calculations assume that dermal contact occurs with the toy for 6 and 9 hours respectively and oral ingeston occurs for 3 hours. Furthermore, the maximum value measured in a toy is used as the standard for all toys, meaning that this worst case toy is assumed to be used during all the hours in which a 2-year-old is assumed to have contact with toys.
It is furthermore assumed that the weight of the wooden toy is 50 g (a guess, since the value is not stated in the report) and that the 2-year-old is in dermal contact with 50% of the wooden toy area and sucks on half of this area. The migration of 1.3 mg/kg has been measured over a period of 1 hour. 5% absorption through the skin is used for BBP.
The exposure from toys for 2-year-olds is thus found to be the following:
Daily ingestion of BBP from toys = oral ingestion (3 hrs) + dermal absorption (9 hrs) (summer scenario):
![]()
= 4.17 µg/kg BW/day
A corresponding RCR value of 0.008 (i.e. a daily ingestion less than the DNEL value) can be obtained.
Calculation of exposure - other objects
Exposure from other products containing BBP may occur (in addition to the exposure from toys and the indoor climate). An example could be clothes. However, no migration has been measured from clothes and therefore no calculation of exposure is performed.
7.7.3.5 Exposure from indoor climate
The exposure calculation for BBP via the indoor climate is presented and calculated in the section on indoor climate, but is reproduced in the table below.
Table 7.34 Daily ingestion of BBP through the indoor climate (dust and air) Based on 95th percentile
| Material | Daily ingestion at 100 mg dust (µg/kg BW/day) |
RCR (at 100 mg dust) |
Daily ingestion at 50 mg dust (µg/kg BW/day) |
RCR (at 50 mg dust) |
| BBP | 10.36 | 0.02 | 5.23 | 0.01 |
Table 7.35 Daily ingestion of BBP through the indoor climate (dust and air) Based on 50th percentile
| Material | Daily ingestion at 100 mg dust (µg/kg BW/day) |
RCR (at 100 mg dust) |
Daily ingestion at 50 mg dust (µg/kg BW/day) |
RCR (at 50 mg dust) |
| BBP | 2.27 | 0.005 | 1.18 | 0.002 |
The calculation shows that the RCR value is less than 1, which indicates that there is no risk of endocrine distrupting effects as a consequence of exposure to BBP via the indoor climate.
7.7.3.6 Combined exposure and risk
The table below summarises the various contributions to BBP.
Table 7.36 Daily ingestion of BBP from various sources
| Summer scenario | Winter scenario | |||
| Source | Daily ingestion (µg/kg BW/day) |
RCR | Daily ingestion (µg/kg BW/day) |
RCR |
| Foods combined 50th percentile | 0.8 | 0.002 | 0.8 | 0.002 |
| Foods combined max | 9.0 | 0.018 | 9.0 | 0.018 |
| Indoor climate combined 50th percentile | 1.18 | 0.002 | 2.27 | 0.005 |
| Indoor climate combined 95th percentile | 5.23 | 0.01 | 10.36 | 0.02 |
| Toys | 4.17 | 0.008 | 3.85 | 0.008 |
| Total (50th percentile) | 6.15 | 0.012 | 6.92 | 0.015* |
| Total (95th percentile) | 18.4 | 0.036 | 23.21 | 0.046 |
*) Due to a larger number of decimals in the calculations in the complete tables in section 7.88, these have smaller round-off deviations.
The combined result for BBP shows that the RCR value is less than 1. Based on the assumptions made, no risk exists as a result of the combined exposure to BBP through foods, indoor climate, toys and other objects included in the present survey.
7.7.4 DEHP, diethylhexyl phthalate, 117-81-7
Table 7.37 Identification of DEHP.
| Chemical name | diethylhexyl phthalate |
| CAS no. | 117-81-7 |
| EINECS no. | 204-211-0 |
| Molecular formula (gross) | C24-H38-O4 |
| Molecular structure |  |
| Molecular weight | 390.5561 |
| Synonyms | Bis(2-ethylhexyl) phthalate, Di(2-ethylhexyl) phthalate, DEHP, Octyl phthalate |
| Classification | REP2;R60-61 (List of hazardous materials) |
7.7.4.1 NOAEL, AF and DNEL
For DEHP, an NOAEL of 5 mg/kg BW/day is chosen for its antiandrogenic effects, based on effects on gametes and reduced testicular weight in rats (Wolfe & Leyton, 2003 in an EU risk assessment : European Chemicals Bureau (2008)).
The combined assessment factor is set to 100 based on a factor of 2.5 for general interspecies differences, 4 for allometric scaling between rats and humans, and 10 for intraspecies differences.
Thus, DNEL for DEHP becomes 0.05 mg/kg BW/day (NOAEL/AF).
7.7.4.2 General exposure
Müller et al. (2003) estimates an oral exposure of 133.4 µg/kg BW/day, an inhalation exposure of 1.9 µg/kg BW/day and a dermal exposure of 15.9 µg/kg BW/day for 1-6-year-olds.
The oral exposure of 133.4 µg/kg BW/day is distributed between various sources in the following way:
| Toys | 33.4 µg/kg BW/day |
| Environment, max estimate | (incl. foods) 100 µg/kg BW/day |
Alternative estimates of exposure through the environment are 3.4 µg/kg BW/day, based on the measured values in the environment, and 26 µg/kg BW/day based on measured values in foods.
The estimated 100 µg/kg BW/day from the environment can be compared with the EU Risk Assessment Report (RAR), which estimates the corresponding exposure at 85 µg/kg BW/day.
Data from the EU RAR has later been used in a probability risk assessment (Bosgra et al, 2005) which has estimated the total exposure of children to 7.58-23.05 µg/kg BW/day (5-95th percentiles) with a geometric mean of 13.19 µg/kg BW/day. The contributions to the mean of 13.19 µg/kg BW/day is distributed in the following way:
| Foods | 12.84 µg/kg BW/day |
| Air inside | 0.29 µg/kg BW/day |
| Toys | 0.053 µg/kg BW/day |
Wormuth et al. (2006) estimates a daily internal exposure of approx. 0.3-80 µg/kg BW with a median of approx. 8 µg/kg BW/day. Approx. 55% stems from foods, approx. 5% from sucking on things such as toys, approx. 37% from ingestion of dust and approx. 3% from inhalation of air. Note that the data basis for assessment of the exposure from foods is very limited.
A more recent and more precise estimate based on measurements of metabolites in the urine of 31 German 2-4-year-olds is 0.4-409 µg/kg BW/day with a median of 5.7-10.7 µg/kg BW/day and a 95th percentile of 23.4-45 µg/kg BW/day, depending on the calculation in relation to the creatinine exretion or urine volume (Wittassek et al., 2007). Boys in this age group are more exposed than girls. 1 out of 17 boys, but no girls, exceeded the TDI set by EFSA at 50 µg/kg BW/day. In total 239 2-14-year-olds were examined. The exposure is highest among the 2 to 4-year-olds and drops as they get older, though not that much within the age group of below 8 years. A few children in the age group 9 to 11-year-olds still demonstrate high exposure.
Absorption through the various exposure paths are, according to EU risk assessments (European Chemicals Bureau, 2008), and quoted by Müller et al. (2003):
- Dermal: 5%
- Oral: 100%
- Inhalation: 100%.
7.7.4.3 Exposure from foods
DEHP can be found in foods both as a result of dispersion in the environment and as a consequence of migration from materials in contact with food, in which it is used as a softener.
Müller et al. (2003) estimates an oral exposure for the 1-6-year-olds of 133.4 µg/kg BW/day out of which the 100 µg/kg BW/day are assessed to stem from foods. They also present an alternative estimate of 26 µg/kg BW/day, based on measured values in foods.
The estimated 100 µg/kg BW/day from the environment can be compared with the EU Risk Assessment Report (RAR), which estimates the corresponding exposure at 85 µg/kg BW/day.
Data from the EU RAR has later been used in a probabilistic risk assessment (Bosgra et al, 2005) which has estimated the contribution from foods to be
12.84 µg/kg BW/day (50th percentile).
Wormuth et al. (2006) estimates a daily internal exposure of approx. 0.3-80 µg/kg BW with a median of approx. 8 µg/kg BW/day for the 1 to 3-year-olds. Approx. 55% are thought to stem from foods, giving a median of 4.4 µg/kg BW/day and a high exposure of 44 µg/kg BW/day.
EFSA (2005b) refers to an estimate based on a “total diet” survey from the UK, in which the exposure to DEHP from foods is estimated at an average of 2.5 µg/day BW/day and a high exposure of 5 µg /kg BW/day for adults.
Since 2-year-olds according to the NNA(2004) (Nordic nutrient recommendations) have an energy consumption per kg body weight at approx. the double of that of adults, the 2.5 and 5 µg/kg BW/day for adults correspond to 5 and 10 µg/kg BW/day, respectively, for the 2-year-olds.
EFSA also refers to an estimate based on analyses of Danish meals, in which the exposure for adults was found to be 4.3 and 15.7 µg/kg BW/day for the uppermost average interval and the high percentile respectively.
For the 2-year-olds this corresponds to 8.6 and 31.4 µg/kg BW/day, respectively.
Based on a principle of choosing realistic worst case values to be used in the further calculations, the 8.6 µg/kg BW/day from the Danish meal survey is used as the median and the 44 µg/kg BW/day from Wormuth et al. is used as the high exposure via foods.
7.7.4.4 Exposure from consumer products
DEHP has been found in earlier surveys, and in a few of the examined product groups in this project. The table below states the products in which DEHP has been found in earlier surveys, and in this project.
Table 7.38 occurrence of DEHP in consumer products
| Occurrence of DEHP in earlier surveys | Occurrence of DEHP in product groups tested in this project |
| Shower curtain Packaging of body shampoo/ bath gel for children Printing on body stocking Book made of foam plastic Ball made of foam plastic Scented eraser Floor jigsaw made of foam plastic Wrapping paper (Christmas paper) Lamination materials Play bags Toy (doctor play set) Toy (Action Man) Toy (bath doll) Toy (Winnie the Pooh ball) Toy (Bratz doll) Toy (Dinosaur figure) Toy (dragon figure Disney) Toy (Fashion Teen doll) Toy (kaleidoscope) Toy (Manchester United football) Toy (My Little Pony) Toy (inflatable feeding bottle) Toy (Felix plastic /textile ball) Toy (stickers for bath tub) Toy (textile/ plastic doll) Lunch boxes Mask made of foam plastic Plasticine Mucous toys Dust (indoor climate) Sword Swimming board Textiles Wooden toys Carpet squares Clothes Vinyl floors Wallpaper |
Jacket (reflector piece) Mitten (label) Rubber clogs Pacifier Soap packaging for children Shower mat |
As the table shows, DEHP was found in quite a few toys that were examined in 2004 and onwards (meaning published in the year 2004 or later, so the surveys themselves are probably from 2003 and later). Plasticine, shower curtains, floorings with vinyl and vinyl wallpaper were examined in 2002 (2001).
A new statutory order on Phthalates (BEK 855, 2009) came into effect in September 2009, which continued the prohibition of sale of those toys examined previously due to their high concentrations of DEHP. In accordance with the current statutory order on phthalates, the concentration of DEHP must not exceed 0.1% (w/) in toys.
In this project we have chosen to include the results from the earlier surveys of toys in spite of changes in the legislation. The reason for this is partly that families with several children may have bought toys years ago that their 2-year-olds are playing with today, and partly that the concentrations found in the earlier surveys of toys do not in all instances exceed the value 0.1%. That means that in several instances the levels in question would also be legal today. However, six out of 25 toy items in the earlier surveys do exceed the today set limit of 0.1% DEHP.
Analysis values
The two tables below display the measured values of DEHP in both the various products previously examined and the products from this project.
As the first table illustrates, migration of DEHP is only measured in rare cases in the products tested in earlier surveys.
Table 7.39 Overview of earlier surveys analysing for content of DEHP
Table 7.40 Overview of findings of DEHP in the products analysed in this project
| Product type + no. | Screening analysis, ug/g | Quantitative analysis, ug/g | Migration analysis, ug/g | Migration period, hours | Migration fluid |
| Jacket 1-4, zipper strap | 74 | n.a. | <0.1 | 3 | Saliva |
| Jacket no. 1-5, loose reflector piece | n.s. | 213000 | n.a. | n.a. | n.a. |
| Mittens 2-3, label | n.s. | 124000 | 0.56 | 3 | Saliva |
| Mittens 2-4, label | n.s. | 147000 | 0.68 | 3 | Saliva |
| Mitten 2-4, outer material | n.s. | 417 | < 0.01 | 3 | Saliva |
| Mitten 2-2, outer material | 320 | n.a. | 0.27 | 3 | Saliva |
| 3-1, Rubber clogs | 50000 | 15658 | n.d. | 6 | Sweat |
| 3-3, Rubber clogs | n.d. | 137 | n.d. | 6 | Sweat |
| 5-3, Pacifier (coverage) | 300 | 275 | n.d. | 7.75 | Sweat |
| n.d. | 7.75 | Saliva | |||
| 6-1, Soap packaging | n.d. | 133 | n.d. | 0.5 | Sweat |
| 6-2, Soap packaging | n.d. | 206 | n.d. | 0.5 | Sweat |
| n.d. | 0.5 | Saliva | |||
| 6-5, Soap packaging | 200000 | 80130 | 2 | 0.5 | Sweat |
| n.d. | 0.5 | Saliva | |||
| 7-1, Shower mat | 220000 | 128625 | 25 | 0.5 | Sweat |
n.a.: Product or material not selected for analysis.
n.s.: No screening result calculated
n.d.: Material not demonstrated above the detection threshold
Calculation of exposure
The earlier surveys provide information on the content of DEHP in 25 different types of consumer products. The measured concentrations vary from 1.9 mg/kg (mask of foam plastic) to as high as 191,000 mg/kg DEHP in a football.
In print on clothes, levels are found up to 170,000 mg/kg corresponding to 17%. Furthermore, levels have been found between 6100 and 440,000 mg/kg (corresponding to 44%) in erasers and levels of DEHP in indoor climate dust have been found at approx. 7-8000 mg/kg (see section on indoor climate for additional details). Carpet tiles, vinyl floorings and vinyl wallpaper contain large quantities of DEHP, the exact percentages being 9%, 16% and 10%, respectively. Small quantities of DEHP have also been identified in a lunch box. Finally, DEHP content has been identified in bath soap packaging.
Migration analyses were only performed in the earlier surveys on lamination materials, play bags, erasers, toys (Bratz doll), plasticine, wooden toys and bath soap packaging. Here the migration falls between 2.4 (play bags) and 5.1 (wooden toys) mg/kg. The migration of the 5.1 mg/kg was measured in a hammer bench with 6 “nails”, executed in beech, but it is not stated from where precisely in the hammer bench DEHP migrates. For example, it might stem from a rubber band on the plate, where the wooden nails are placed or some other place the child will not suck at frequently. For that reason this value is ignored in the basis for the calculations. The highest value, of 23 mg/kg, is found for plasticine but describes release to the indoor climate. The migration of the 2.4 mg/kg from a play bag has therefore been applied as the highest migration measured in the earlier surveys.
In the analyses in this project DEHP has been identified in labels on mittens with concentrations of up to 14.7%, in loose reflector pieces on jackets up to 21.3%, in rubber clogs up to 1.6%, in the coverage of pacifiers in small concentrations (275 mg/kg), in soap packagings up to 8% and in shower mats up to 12.9% DEHP. On most of these products migration analyses were also performed, showing that in rubber clogs and pacifiers no migration occurs beyond the detection threshold (detection threshold 2 mg/kg). The migration is highest for shower mats, in which it is 25 mg/kg.
Calculation of exposure – toys
For toys, the highest migration value has been measured at 2.4 mg/kg for play bags. A higher migration was measured from plasticine (into the indoor air, but this value is assumed to be included in the values from the indoor climate (see section on indoor climate). The value from the play bag stems from an earlier survey. It is applied in spite of the fact that the total concentration in this play bag exceeds the current limit for DEHP in toys of 0.1%, because it is assumed that the play bag might have been bought before the limit value came into effect and may still be used.
As noted in the chapter “Exposure scenarios - methods”, the calculations assume that dermal contact occurs with the toy for 6 and 9 hours (winter and summer scenarios) and oral ingestion occurs for 3 hours. The maximum level measured in a toy is furthermore used as the calculation value for all toys, meaning that this worst case value for toys is assumed to be used during all the hours that a 2-year-old is assumed to have contact with toys.
It is furthermore assumed that the weight of the play bag is 50 g (a guess, since the value is not stated in the report) and that the 2-year-old is in dermal contact with 10% of the area of the play bag containing migrating DEHP and sucks on half of this area. The measured migration of 2.4 mg/kg is measured over a period of 4 hours and therefore the result needs to be corrected by a factor 4. Absorption of 5% is used for dermal absorption.
Hence, the value of the exposure from toys on 2-year-olds becomes (summer scenario):
Daily ingestion of DEHP from toys = oral ingestion (3 hrs) + dermal absorption (9 hrs)
![]()
= 0.38 µg/kg BW/day
A corresponding RCR value of 0.008 (i.e. a daily ingestion less than the DNEL value) can be obtained.
Calculation of exposure – other objects
Exposure from other products containing DEHP can occur (in addition to the exposure from toys and the indoor climate). This could be, for example, from erasers (mainly if there are older siblings in the household), the shower mat in the bath tub, bath soap packaging and jackets/mittens. DEHP has furthermore been identified in lunch boxes, but this contribution is assumed to be contained in the figures from foods.
Eraser
In these calculations it is assumed that there is contact with the eraser for 1 minute a day (only when possibly older siblings are doing their homework). In survey no. 84 (Svendsen et al, 2007), it is stated that a migration of 1 mg/g (per hour) occurs and that the eraser weighs 14.4 g. It is assumed that there is contact with 50% of the eraser.
Shower mat
Shower mat 7-1 has a migration of 25 µg/g and weighs 202.2 g. The calculations assume that there is contact with 25% of the area of the shower mat. Instead, an area the size of a baby’s bottom might be used, i.e. 0.038 m2, but at some point parts of legs and hands will also touch the shower mat. A contact period of 30 minutes is assumed, meaning the period of time the child sits on the mat in the bath and since everything takes place in water, a retention factor of 0.01 is applied. The retention factor has been introduced by the SCCNFP to account for products that leave behind a residue when used and washed off after use, i.e. for shampoo products, body shampoos and similar rinse-off products (SCCNFP 0690 (2003)). Since this exposure is in the bath tub it is permissible to use the retention factor in this context too. It is only assumed that dermal exposure occurs, i.e. the result is corrected because only 5% of DEHP is absorbed through the skin.
Bath soap packaging
Soap packaging no. 6-5 has a content of DEHP of 80 mg/g corresponding to 8%. The Danish Safety Technology Authority has assessed this soap packaging to be a toy, so the product thus violates the limit of 0.1% set by the statutory order on Phthalates. The migration to sweat has been measured at 2 µg/g (during ½ hour). No migration to saliva has been demonstrated (i.e. the value is below the detection threshold), so only dermal absorption has been assumed. The soap packaging weighs 4 g. A contact period of 30 minutes is assumed. The child is assumed to have contact with 75% of the area of the bath packaging, which is not very large. It might be relevant to apply a dilution factor as well, since the exposure occurs in a bath tub, but because playing often occurs above the water, a worst case calculation has been made without dilution.
The calculation appears in the table below and shows an RCR value for the soap packaging of 0.0002, i.e. far below 1 and therefore not posing a risk. The value furthermore represents the smallest contribution of DEHP from the consumer products. This small contribution has not been included in the complete calculations because the product is now illegal. and is expected to be withdrawn from the market.
Jackets/mittens
The highest migration measured is 0.68 µg/g (during 3 hours) from the label with product name on a mitten. This mitten weighs a total of 8 g. It is assumed, as described in the section “Exposure calculations – method”, that the 2-year-old maximally sucks on mittens for 2 hours and 58 minutes (rounded up to 3 hours) each day. It may not be entirely realistic that the 2-year-olds suck on the label with the product name in the middle of the mitten, but DEHP has also been found (a migration of 0.27 µg/g) in the outer material of a mitten. The child is assumed to suck on approx. 5% of the weight of the mitten.
For the remaining objects, the exposure values are the following:
Table 7.41 Daily ingestion of DEHP from other objects based on measured migration values
| Product | Weight product | Max measured migration value (µg/g) | Fraction of product in dermal contact. | F abs | Average weight, 2-year-old | Exposure (hours) | Daily ingestion (µg/kg BW/day) |
Calculated DNEL (mg/kg BW/day) |
RCR |
| Eraser | 14.4 | 1000/1 hour | 0.5 | 15.2 kg | 1 min. | 7.895 | 0.05 | 0.158 | |
| Shower mat | 202.2 g | 25/0.5 hour | 0.25 x 0.01* | 0.05 | 15.2 kg | 0.5 | 0.042 | 0.05 | 0.0008 |
| Soap packaging | 4 | 2/0.5 hour | 0.75 | 0.05 | 15.2 kg | 0.5 | 0.01 | 0.05 | 0.0002 |
| Jackets/mittens | 88 g | 0.68/3 hours | 0.05 | 15.2 kg | 3 | 0.197 | 0.05 | 0.004 |
* = dilution factor through bath water
Fabs = Relative amount of product taken up via dermal contact. Is used solely for products where the only factor to be considered is dermal contact (such as the shower mat). Oral absorption must be accounted for in all other products and the absorption percentage is thus 100%
7.7.4.5 Exposure from indoor climate
The exposure calculation for DEHP via the indoor climate is presented and calculated in the section on indoor climate, but is reproduced in the table below.
Table 7.42 Daily ingestion of DEHP through the indoor climate (dust and air) based on 95th percentile
| Material | Daily ingestion at 100 mg dust (µg/kg BW/day) |
RCR (at 100 mg dust) |
Daily ingestion at 50 mg dust (µg/kg BW/day) |
RCR (at 50 mg dust) |
| DEHP | 46.65 | 0.93 | 23.41 | 0.47 |
Table 7.43 Daily ingestion of DEHP through the indoor climate (dust and air) based on 50th percentile
| Material | Daily ingestion at 100 mg dust (µg/kg BW/day) |
RCR (at 100 mg dust) |
Daily ingestion at 50 mg dust (µg/kg BW/day) |
RCR (at 50 mg dust) |
| DEHP | 5.71 | 0.11 | 2.89 | 0.06 |
The calculation shows that at least 95% of the 2-year-olds will be exposed to concentrations of DEHP via the indoor climate that,with the assumptions made, will not pose a risk if 100 mg of dust is consumed per day. Note however that in bigger surveys than the Danish (which forms the basis of these calculations) levels of DEHP have been seen in the indoor climate high enough to pose a risk for 2-year-olds with the assumptions made.
7.7.4.6 Combined exposure and risk
In the table below, the various contributions to DEHP are summarised. The tables are distributed according to the summer and winter scenarios as described earlier.
Table 7.44 Daily ingestion of DEHP from various sources
| Summer scenario | Winter scenario | |||
| Source | Daily ingestion (µg/kg BW/day) |
RCR | Daily ingestion (µg/kg BW/day) |
RCR |
| Foods combined 50th percentile | 8.6 | 0.17 | 8.6 | 0.17 |
| Foods combined max | 44 | 0.88 | 44 | 0.88 |
| Indoor climate combined 50th percentile | 2.89 | 0.06 | 5.71 | 0.11 |
| Indoor climate combined 95th percentile | 23.41 | 0.47 | 46.65 | 0.93 |
| Toys | 0.39 | 0.008 | 0.36 | 0.007 |
| Eraser | 7.90 | 0.16 | 7.90 | 0.16 |
| Shower mat | 0.04 | 0.0008 | 0.04 | 0.0008 |
| Jackets/mittens | 0.20 | 0.004 | ||
| Total (50th percentile) | 19.82 | 0.40 | 22.8 | 0.45 |
| Total (95th percentile) | 75.74 | 1.51 | 99.15 | 1.98 |
The combined result for DEHP shows that the RCR value is above 1 in both the summer and winter scenarios when the 95th percentile is considered, but that the RCR is below 1 when the 50th percentile is considered.
7.7.5 DINP, di-isononyl phthalate, 28553-12-0
Table 7.45 Identification of DINP.
| Chemical name | Di-isononyl phthalate |
| CAS no. | 28553-12-0 |
| EINECS no. | 249-079-5 |
| Molecular formula (gross) | C26-H42-O4 |
| Molecular structure | 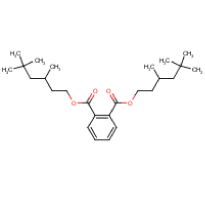 |
| Molecular weight | 418.6093 |
| Synonyms | 1,2-Benzenedicarboxylic acid, diisononyl ester, DINP, Palatinol DN |
| Classification | - |
7.7.5.1 NOAEL, AF and DNEL
For DINP an NOAEL of 276 mg/kg BW/day (LOAEL 742 mg/kg/day) is chosen for its antiandrogenic effects, based on reduced testicular weight in mice (Aristech, 1995 in an EU risk assessment: European Chemicals Bureau (2003)).
The combined assessment factor is set to 175 based on a factor of 2.5 for general interspecies differences, 7 for allometric scaling between mice and humans, and 10 for intraspecies differences.
Thus, DNEL for DINP becomes 1.6 mg/kg BW/day (NOAEL/AF).
7.7.5.2 General exposure
Müller et al. (2003) estimates a total oral exposure of 63.4 µg/kg BW/day, an inhalation exposure of 0.05 µg/kg BW/day, and a dermal exposure of 1.6 µg/kg BW/day.
The oral exposure of 63.4 µg/kg BW/day is distributed in the following way:
| Toys | (1-3-year-olds) 33.8 µg/kg BW/day |
| Environment, max estimate | 30 µg/kg BW/day |
This can be compared with the estimate in the EU Risk Assessment Report, in which the total oral exposure for 3-6-year-olds is 20 µg/kg BW/day. However, in this case the bioaccessibility (the absorption) has been factored in.
Wormuth et al. (2006) estimates a daily internal exposure of approx. 0.02-90 µg/kg BW with a median of approx. 9 µg/kg BW/day. Approx. 95% stems from sucking on things such as toys and 5% from ingestion of dust.
Schettler (2006) refers to surveys in the USA, which have estimated the exposure to DINP through children’s contact with toys to 5.7-44 µg/kg/day depending on assumptions and statistical techniques. The 99th percentile estimate is at 40-173 µg/kg/day (Schettler, 2006). DINP is used primarily in toys in the USA.
Absorption through the various routes of exposure is for young children, according to EU risk assessments (European Chemicals Bureau, 2003) and quoted by Müller et al. (2003):
- Dermal: 0.5%
- Oral: 100%
- Inhalation: 100%.
7.7.5.3 Exposure to DINP from foods
DINP can find its way into foods through dispersion in the environment and absorption into domestic animals, fish and crops, or through migration from usage in materials in contact with food.
The exposure estimates stated above (below 7.7.5.2) demonstrate that the exposure through foods must be assumed to be negligible for 2-year-olds in relation to the exposure that is possible through toys.
EFSA (2005c) estimates that as worst case the exposure through foods is 10 µg/kg BW/day.
Therefore, based on these EFSA estimates the calculations apply 0 µg/kg BW/day as 50th percentile and 10 µg/kg BW/day as contribution from foods.
7.7.5.4 Exposure from consumer products
DINP was found both in the earlier surveys and in some of the examined product groups in this project. The table below states the products in which DINP has been found earlier and in this project.
Table 7.46 occurrence of DINP in consumer products
| Occurrence of DINP in earlier surveys | Occurrence of DINP in product groups tested in this project |
| Plasticine Toys (mucous toys) Toys of foam plastic (sword, book, ball, floor jigsaw) Toy (inflatable feeding bottle) Toy (dragon figure Disney) Toy (Action Man) Toy (My Little Pony) Toy (textile doll bear) Toy (dinosaur figure) Toy (stickers for bath tub) Toy (bath dolls) Toy (kaleidoscope) Toy (doll) Toy (doctor play set) Toy (pig Pinky & Perky) Toy (The Little Mermaid) Toy (Manchester United football) Toy (doll Fashion teen) Toy (dinoworld) Toy (pony) Toy (Sailor Moon) Toy (dolls) Toy (Bratz doll) Bath soap packaging Baby changing mats/cushions Clothes (printing on clothes) |
In the label on two different mittens Coverage on a pacifier Bath soap packaging Shower mat |
DINP was found in toys that were examined in 2004 and onwards (meaning published in the year 2004 or later, so the surveys themselves are probably from 2003 and later). The study on plasticine is from 2002.
REACH annex XVII, entry 51 and 52 continued the prohibition af sale of the toys examined previously because of the high concentrations of DINP. In accordance with REACH, the concentration of DINP must not exceed 0.1% (w/w) in toys children are able to put into their mouths.
Analysis values
The two tables below present the measured values of DINP in the various products previously examined, and the products examined in this project.
As the first table illustrates, migration of DINP is only measured in rare cases in the products tested in earlier surveys.
Table 7.47 Overview of earlier surveys analysing for content of DINP
Table 7.48 Overview of findings of DINP in the products analysed in this project
| Product type + no. | Screening analysis, ug/g | Quantitative analysis, ug/g | Migration analysis, ug/g | Migration period, hours | Migration fluid |
| Mittens 2-3, label | n.s. | 86000 | n.d. | 3 | Saliva |
| Mittens 2-4, label | n.s. | 78000 | n.d. | 3 | Saliva |
| 5-3, Pacifier (coverage) | 1600 | 1047 | n.d. | 7.75 | Sweat |
| n.d. | 7.75 | Saliva | |||
| 6-5, Soap packaging | 200000 | 87692 | n.d. | 0.5 | Sweat |
| n.d. | 0.5 | Saliva | |||
| 7-4, Shower mat | 800000 | 146330 | n.d. | 0.5 | Sweat |
n.s.: No screening result calculated
n.d.: Material not demonstrated above the detection threshold
Calculation of exposure - toys
The earlier surveys provide information on the content of DINP in 27 different consumer products.[25] The measured content concentrations fall between 5.1 mg/kg (polystyrene book) and 334,000 mg/kg corresponding to 33% (in dolls)2.
In printed clothes, the levels were found to be up to 320,000 mg/kg corresponding to 32%. Furthermore, an eraser was found to contain up to 70% DINP, but the typical percentage ranged between 30 and 50% for erasers containing DINP. In Survey Project no. 90 on baby products, contents of DINP of 3900, 144,000 and 220,000 mg/kg were found in baby changing mats (corresponding to 0.38%, 14.4% and 22%, respectively). It should be noted that the maximum value also covers the content of DiDeP.
Migration analyses were performed for the earlier investigations on plasticine, toys (Bratz doll) and baby changing mats. The migration values lie between 0.23 mg/kg (plasticine - released to the indoor climate) and 11 mg/kg (Bratz doll).
In this project DINP has been found in two stickers on mitts with concentrations of up to 86,000 mg/kg corresponding to 8.6%, in the coverage of a pacifier with a concentration of 1047 mg/kg, in a soap packaging with a concentration of 8.8% and in a bath mat with a concentration of 14.6%. Migration analyses were performed on all these products, showing that DINP does not migrate out of the products in concentrations above the detection threshold.
Calculation of exposure - toys
For toys, the highest migration value measured is 11 mg/kg for a Bratz doll.
As noted in the chapter "Exposure scenarios - methods", the calculations assume that dermal contact occurs with the toy for 6 and 9 hours,, and oral contact with the toy for 3 hours. The maximum level measured in a toy is used as the calculation value for all toys, meaning that this worst-case scenario toy is assumed to be used during all the hours that a 2-year-old is assumed to have contact with toys. [26]
It is furthermore assumed that the weight of the Bratz doll is 70 g (an educated guess, since the value was not stated in the report), that the two-year old is in dermal contact with 10% of the surface area of the doll and sucks on half of this area. The measured migration of 11 mg/kg is measured over a period of 2 hours, and therefore the result needs to be corrected by a factor of 2. The value used for the dermal uptake of DINP is 0.5%
Hence, the value of the exposure from toys on two-year-olds is (summer scenario):
Daily ingestion of DINP from toys = oral ingestion (3 t) + dermal uptake (9 t)
![]()
= 3.91 µg/kg body weight/day
A corresponding RCR value of 0.002 (i.e. a daily ingestion smaller than the DNEL value) can be obtained.
Calculation of exposure - other objects
Exposure from other products containing DEHP can occur (in addition to the exposure from toys and the indoor climate). This could be, for instance, from erasers (mainly if there are older siblings in the household), baby changing mats/cushions.
Eraser
Migration analyses were not done on DINP in Survey Report no. 84. The weight of the eraser with a measured content of DINP of 70% is not given. But if it assumed that DINP migrates similarly to DEHP (DINP and DEHP are both phthalates with a high molecular weight), that there was a high concentration of phthalates in both erasers, and that it is assumed that the eraser weighs 20 g (which is the typical weight for the analysed erasers), then we can make the calculation even though the result is somewhat uncertain.
In the calculations it has been assumed that there is contact with the eraser for 1 minute a day (only when any older siblings are doing their homework). It is assumed that there is contact with 50% of the surface area of the eraser.
Baby changing mats/cushions
2-year-old children will still be changed on a baby changing mat/cushion in certain situations, but can also have their diaper changed while standing. It is therefore assumed that there is dermal contact with a baby changing mat at most twice a day each time with duration of 5 minutes, i.e. a total of 10 minutes per day. The migration of DINP from the baby changing mat, measured over a period of 4 hours (which must be taken into account in the calculations), is found to have a maximum value of 6.6 µg/200 cm2
As described in chapter 7.1 it is assumed that the body surface area of a 2-year-old is 0.6 m2, i.e. 6000 cm2 It is assumed that approximately one-third of the body surface area of the 2-year-old will be in contact with the baby changing mat, i.e. migration occurs from 2000 cm2. It is assumed that there is dermal exposure solely from the baby changing mat, i.e. the result is corrected so that only 0.5% of the DINP absorption occurs via skin. For the remaining products where dermal contact is not the only factor to be taken into account, the result is 100% because oral ingestion is also considered.
For the remaining objects the exposure values are the following:
Table 7.49 Daily ingestion of DINP from other objects based on measured migration values
| Product | Weight/size of product | Max measured migration value (µg/g) (µg/200 cm2) |
Fraction of product in dermal contact. | F abs | Average weight, 2-year-old | Exposure (hours) | Daily ingestion (µg/kg BW/day) |
Calculated DNEL (mg/kg BW/day) |
RCR |
| Eraser | 20 g | 1000/1 hour | 0.5 | 1 | 15.2 kg | 1 min | 10.96 | 1.6 | 0.007 |
| Baby changing mats/cushions | 2000 cm2 | 6.6 µg/200 cm2/4 hours | 1 | 0.005 | 15.2 kg | 10 min. | 0.0009 | 1.6 | 6 * 10-7 |
Fabs = Relative amount of product taken up via dermal contact. Is used solely for products where the only factor to be considered is dermal contact (like the baby changing mat). Oral uptake must be accounted for in all other products, and the uptake percentage is thus 100%
7.7.5.5 Exposure from indoor climate
The exposure calculation for DINP via the indoor climate is presented and calculated in the section on indoor climate, but is reproduced in the table below.
Table 7.50 Daily ingestion of DINP through the indoor climate (dust and air) based on the 95th percentile
| Material | Daily ingestion at 100 mg dust (µg/kg BW/day) |
RCR (at 100 mg dust) |
Daily ingestion at 50 mg dust (µg/kg BW/day) |
RCR (at 50 mg dust) |
| DINP | 12.70 | 0.008 | 6.35 | 0.004 |
Table 7.51 Daily ingestion of DINP through the indoor climate (dust and air) based on the 50th percentile
| Material | Daily ingestion at 100 mg dust (µg/kg BW/day) |
RCR (at 100 mg dust) |
Daily ingestion at 50 mg dust (µg/kg BW/day) |
RCR (at 50 mg dust) |
| DINP | 0.0003 | 0.0000002 | 0.0001 | 0.00000008 |
Calculations show that the RCR value is less than 1, indicating that on the basis of the assumptions made there is no risk associated with exposure to DINP via the indoor climate, neither by ingestion of 50 mg or 100 mg of dust per day.
7.7.5.6 Combined exposure and risk
In the table below the various contributions to DINP are summarised. The tables are distributed according to the summer scenario or winter scenario described earlier.
Table 7.52 Daily ingestion of DINP from various sources
| Summer scenario | Winter scenario | |||
| Source | Daily ingestion (µg/kg BW/day) |
RCR | Daily ingestion (µg/kg BW/day) |
RCR |
| Foods combined 50th percentile | 0 | 0 | 0 | 0 |
| Foods combined max | 10 | 0.006 | 10 | 0.006 |
| Indoor climate combined 50th percentile | 0.0001 | 0.00000008 | 0.0003 | 0.0000002 |
| Indoor climate combined 95th percentile | 6.35 | 0.004 | 12.70 | 0.008 |
| Toys | 3.91 | 0.002 | 3.88 | 0.002 |
| Eraser | 10.96 | 0.007 | 10.96 | 0.007 |
| Baby changing mats/cushions | 0.0009 | 0.0000006 | 0.0009 | 0.0000006 |
| Total (50th percentile) | 14.88 | 0.009 | 14.84 | 0.009 |
| Total (95th percentile), max | 31.23 | 0.020 | 37.54 | 0.023 |
The combined result for DINP shows that the RCR value is far above 1 in both the summer and winter scenarios, and therefore, under the assumptions applied in the report, does not constitute a risk.
7.7.6 Prochloraz, 67747-09-5
Table 7.53 Identification of Prochloraz
| Chemical name | Prochloraz |
| CAS no. | 67747-09-5 |
| EINECS no. | 266-994-5 |
| Molecular formula (gross) | C15-H16-Cl3-N3-O2 |
| Molecular structure | 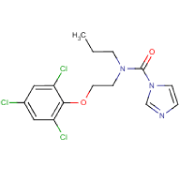 |
| Molecular weight | 376.6647 |
| Synonyms | N-propyl-N-[2-(2,4,6-trichlorophenoxy)ethyl]-1H-imidazole-1-carboxamide, Dibavit, Mirage |
| Classification | XN; R22 - N; R50-53 (EU, ESIS) |
7.7.6.1 NOAEL, AF and DNEL
For prochloraz the NOAEL of 50 mg/kg BW/day (LOAEL 250 mg/kg/d) is chosen for its antiandrogenic effects, based on increased retention of nipples in the offspring of rats exposed during pregnancy (Christiansen et al. 2009).
The combined assessment factor is set to 100 based on a factor of 2.5 for general interspecies differences, 4 for allometric scaling between rats and humans, and 10 for intraspecies differences.
Thus, the DNEL for prochloraz becomes 0.5 mg/kg BW/day (NOAEL/AF).
7.7.6.2 Exposure from food
Prochloraz (N-propyl-N-[2-(2,4,6-trichlorophenoxy)ethyl]-1H-imidazole-1-carboxamide) is a fungicide use of which is permitted on several edible crops. JMPR (2001) has determined the ADI to be 0.01 mg/kg BW/day.
Table 7.54 Findings of prochloraz in the 2008 monitoring programme of the Danish Veterinary and Food Administration (Danish Veterinary and Food Administration, 2008).
| Food | Max. finding | Number of exceeded thresholds/number of samples | MRL (maximum residue limit) |
| Oranges | 0.6 mg/kg | 0/63 | 10 mg/kg |
| Lemons | 0.47 mg/kg | 0/67 | 10 mg/kg |
| Clementine | 1.1 mg/kg | 0/57 | 10 mg/kg |
| Grapefruit | 0.16 | 0/67 | 10 mg/kg |
| Mango | 2.1 | 0/11 | 5 mg/kg |
| Papaya | 0.49 | 0/12 | 5 mg/kg |
Grapefruit is presumably only consumed minimally by two-year olds, so it can be disregarded in the context of exposure.
Prochloraz is not amongst the 20 pesticides that, according to calculations by the Danish Food and Veterinary Administration, constitute the majority of the ingestion in 2007. The average ingestion is less than 0.7 µg/day/person. For a 60 kg person this corresponds to less than 0.01 µg/kg BW/day.
The caloric consumption of 2-year-olds is approximately 325 kJ/kg BW, which is roughly 3 times that of adults. If a transformation factor of 3 is used for 2-year-olds, the corresponding exposure can be derived:
Less than 0.04 µg/kg BW/day.
It should be noted that the findings in the table cannot be used to directly calculate the exposure. This is because in many cases one is dealing with results of analyses of samples that were chosen on the basis of suspicion, because the findings are not representative, and because there is always a proportion of the pesticides that will be removed upon peeling, washing and preparation. A larger exposure than the one calculated above will therefore only occur sporadically.
7.7.6.3 Combined exposure and risk
The total contribution for prochloraz that was considered in the investigation comes from foods. As it can be discerned from the tables Table 7.85-Table 7.87 the contribution from prochloraz was so minimal that it only gives a visible contribution in the total calculations for the maximum value, which constitutes 0.04 µg/kg BW/day. The contribution is too small to be reflected in the RCR values, since the calculations are with two decimals.
7.7.7 Tebuconazole, 107534-96-3
Table 7.55 Identification of Tebuconazole
| Chemical name | Tebuconazole, 107534-96-3 |
| CAS no. | 107534-96-3 |
| EINECS no. | 403-640-2 |
| Molecular formula (gross) | C16-H23-Cl-N3-O |
| Molecular structure | 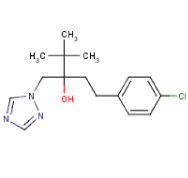 |
| Molecular weight | 307.8182 |
| Synonyms | (RS)-1-(4-Chlorophenyl)-4,4-dimethyl-3-(1H-1,2,4-triazol-1- ylmethyl)pentan-3-ol, Ethyltrianol, Fenetrazole |
| Classification | Rep3;R63 XN;R22 N;R51/53 Rep3;R63 XN;R22 N;R51/53 (LOFS) |
7.7.7.1 NOAEL, AF and DNEL
For tebuconazole the LOAEL of 50 mg/kg BW/day (NOAEL is not identified) is chosen for its antiandrogenic effects, based on increased retention of nipples in the offspring of rats exposed during pregnancy (Christiansen et al. 2007).
The combined assessment factor is set to 300 based on a factor of 2.5 for general interspecies differences, 4 for allometric scaling between rats and humans, 10 for intraspecies differences and 3 for LOAEL to NOAEL.
Thus, the DNEL for tebuconazole becomes 0.17 mg/kg BW/day (LOAEL/AF).
7.7.7.2 Exposure from food
Tebuconazole is a fungicide use of which on a series of edible crops is allowed outside of the EU. JMPR (1994) has determined the ADI to be 0.03 mg/kg BW/day (FAO/WHO, 2006).
Table 7.56 Findings of tebuconazole in the 2007 monitoring programme of the Danish Veterinary and Food Administration (Danish Veterinary and Food Administration, 2008).
| Food | Max. finding | Number of occurrences/number of samples |
MRL (maximum residue limit) in mg/kg |
| Plums, foreign. | 0.05 mg/kg | 5/55 | 0.5 |
| Green beans, foreign. | 0.019 mg/kg | 1/36 | 2 |
| Clementines | 0.025 mg/kg | 2/57 | 0.05 |
| Peaches | 0.15 mg/kg | 6/23 | 1 |
| Figs | 0.15 mg/kg | 1/1 | 0.05 |
| Carrots, foreign. | 0.05 mg/kg | 1/13 | 0.5 |
| Melons | 0.06 mg/kg | 1/56 | 0.2 |
| Nectarine | 0.43 mg/kg | 9/34 | 1 |
| Leek, foreign. | 0.045 mg/kg | 1/12 | 1 |
| Grapes | 0.38 mg/kg | 6/75 | 2 |
| Peas with pea pod, foreign | 0.02 mg/kg | 2/4 | 0.05 |
Tebuconazole is not amongst the 20 pesticides that, according to calculations by the Danish Food and Veterinary Administration, constitute the majority of the ingestion in 2007. The average ingestion is less than 0.7 µg/day/person. For a 60 kg person this corresponds to less than 0.01 µg/kg BW/day.
The caloric consumption of 2-year-olds is approximately 325 kJ/kg BW., which is roughly 3 times that of adults. If a transformation factor of 3 is used for 2-year-olds, the corresponding exposure is derived:
Less than 0.04 µg/kg BW/day.
7.7.7.3 Combined exposure and risk
The total contribution for tebuconazole that was considered in the investigation comes from foods. As it can be discerned from the tables Table 7.85 to-Table 7.87 the contribution is so minimal that it only gives a visible contribution in the total calculations for the maximum value, which constitutes 0.04 µg/kg BW/day. The contribution is too small to be reflected in the RCR values, since the calculations are with two decimals.
7.7.8 Linuron, 330-55-2
Table 7.57 Identification of linuron.
| Chemical name | Linuron, 330-55-2 |
| CAS no. | 330-55-2 |
| EINECS no. | 206-356-5 |
| Molecular formula (gross) | C9-H10-Cl2-N2-O2 |
| Molecular structure | 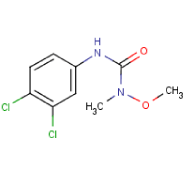 |
| Molecular weight | 249.0934 |
| Synonyms | 1-(3,4-Dichlorophenyl)3-methoxy-3-methylurea, Garnitan Afalon, |
| Classification | REP2;R61 XN;R22-48/22 CARC3;R40 REP3;R62 N;R50/53 (LOFS) |
7.7.8.1 NOAEL, AF and DNEL
For linuron the NOAEL of 25 mg/kg BW/day (LOAEL 50 mg/kg/d) is chosen for its antiandrogenic effects, based on increased retention of nipples in the offspring of rats exposed during pregnancy (Christiansen et al. 2000).
The combined assessment factor is set to 100 based on a factor of 2.5 for general interspecies differences, 4 for allometric scaling between rats and humans, and 10 for intraspecies differences.
Thus, the DNEL for linuron becomes 0.25 mg/kg BW/day (NOAEL/AF).
7.7.8.2 Exposure from food
Linuron is an herbicide that is used on corn, vegetables, sunflowers and decorative greenery.
Table 7.58 Findings of linuron in the 2007 monitoring programme of the Danish Veterinary and Food Administration (Danish Veterinary and Food Administration, 2008).
| Food | Max. Finding | Number of exceeded thresholds/number of samples |
MRL (maximum residue limit) |
| Carrot, DK | 0.038 mg/kg | 0/45 | 0.2 mg/kg |
| Carrot, foreign | 0.07 mg/kg | 0/13 | 0.2 mg/kg |
Linuron is not amongst the 20 pesticides that, according to calculations by the Danish Food and Veterinary Administration, constitute the majority of the ingestion in 2007. I.e. the average ingestion is less than 0.7 µg/day/person. For a 60 kg person this corresponds to less than 0.01 µg/kg BW/day.
The caloric consumption of 2-year-olds is approximately 325 kJ/kg BW., which is roughly 3 times that of adults. If a transformation factor of 3 is used for 2-year-olds, the corresponding exposure is derived:
Less than 0.04 µg/kg BW/day.
7.7.8.3 Combined exposure and risk
The total contribution for linuron that was considered in the investigation comes from foods. As it can be discerned from Table 7.87 to Table 7.89 the contribution is so minimal that it only gives a visible contribution in the total calculations for the maximum value, which constitutes 0.04 µg/kg BW/day. The contribution is too small to be reflected in the RCR values, since the calculations are with two decimals.
7.7.9 Vinclozolin
Table 7.59 Identification of Vinclozolin
| Chemical name | Vinclozolin |
| CAS no. | 50471-44-8 |
| EINECS no. | 256-599-6 |
| Molecular formula (gross) | C12-H9-Cl2-NO3 |
| Molecular structure | 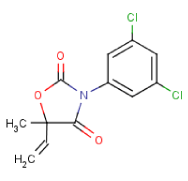 |
| Molecular weight | 286.1102 |
| Synonyms | 1-(3,4-Dichlorophenyl)3-methoxy-3-methylurea, 3-(3,5-Dichlorophenyl)-5-ethenyl-5-methyl-2,4- oxazolidinedione, Ronilan, Ornalin, |
| Classification | REP2;R60-61 CARC3;R40 R43 N;R51/53 (LOFS) |
7.7.9.1 NOAEL, AF and DNEL
For vinclozolin, the LOAEL of 5 mg/kg BW/day (NOAEL is not identified) is chosen for its antiandrogenic effects, based on increased retention of nipples in the offspring of rats exposed during pregnancy (Hass et al. 2007).
The combined assessment factor is set to 300 based on a factor of 2.5 for general interspecies differences, 4 for allometric scaling between rats and humans, 10 for intraspecies differences and 3 for LOAEL to NOAEL.
Thus, the DNEL for vinclozolin becomes 0.0167 mg/kg BW/day (LOAEL/AF).
7.7.9.2 Exposure from foods
Vinclozolin is a fungicide that so far has been used widely. The EFSA (2008) has recommended that the use be limited, since the theoretical maximum (TAMDI) is high, around 110-644% of the ADI.
Even though the actual ingestion value is smaller, the EFSA has recommended that residues not be tolerated in certain crops. (EFSA 1-36).
Table 7.60 Findings of vinclozolin in the 2007 monitoring programme of the Danish Veterinary and Food Administration (Danish Vveterinary and Food Administration, 2008).
| Food | Max. finding | Number of exceeded thresholds/number of samples |
MRL (maximum residue limit) |
| Peas with pea pod, foreign | 0.07 mg/kg | 0/36 | 2 mg/kg |
| Peaches | 0.026 mg/kg | 0/23 | 0.05 mg/kg |
| Kiwi | 2.2 mg/kg | 0/57 | 10 mg/kg |
| Salad, foreign | 0.049 mg/kg | 0/32 | 5 mg/kg |
Vinclozolin is not amongst the 20 pesticides that, according to calculations by the Danish Food and Veterinary Administration, constitute the majority of the ingestion in 2007. The average ingestion is less than 0.7 µg/day/person. For a 60 kg person this corresponds to less than 0.01 µg/kg BW/day.
The caloric consumption of 2-year-olds is approximately 325 kJ/kg BW., which is roughly 3 times that of adults. If a transformation factor of 3 is used for 2-year-olds, the corresponding exposure is derived:
Less than 0.04 µg/kg BW/day.
7.7.9.3 Combined exposure and risk
The total contribution for vinclozolin that was considered in the investigation comes from foods. As it can be discerned from Table 7.87 to Table 7.89 the contribution is so minimal that it only gives a visible contribution in the total calculations for the maximum value, which constitutes 0.04 µg/kg BW/day. The contribution is too small to be reflected in the RCR values, since the calculations are with two decimals.
7.7.10 Procymidone
Table 7.61 Identification of Procymidone
| Chemical name | Procymidone |
| CAS no. | 32809-16-8 |
| EINECS no. | 251-233-1 |
| Molecular formula (gross) | C13-H11-Cl2-N-O2 |
| Molecular structure | 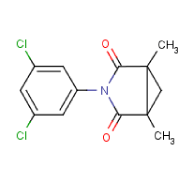 |
| Molecular weight | 284.1374 |
| Synonyms | 3-(3,5-dichlorophenyl)-1,5-dimethyl-3-azabicyclo[3.1.0]hexane-2,4-dione, Dicyclidine |
| Classification | - |
7.7.10.1 NOAEL, AF and DNEL
For procymidone the NOAEL of 2.5 mg/kg BW/day (LOAEL of 12.5 mg/kg BW/day) is chosen for its antiandrogenic effects, based on decreased anogenital distance (AGD), hypospadias (malformed genitalia) as well as effects on the testes in the offspring of rats exposed during pregnancy (EFSA, 2009b).
The combined assessment factor is set to 100 based on a factor of 2.5 for general interspecies differences, 4 for allometric scaling between rats and humans, and 10 for intraspecies differences.
Thus, the DNEL for procymidone becomes 0.025 mg/kg BW/day (NOAEL/AF).
7.7.10.2 Exposure from foods
Procymidone is a fungicide which is prohibited to use within the EU.
Table 7.62 Findings of procymidone in the 2007 monitoring programme of the DanishVeterinary and Food Administration (DanishVeterinary and Food Administration, 2008).
| Food | Max. finding | Number of exceeded thresholds/number of samples |
MRL (maximum residue limit) |
| Cucumber, foreign | 0.19 mg/kg | 0/28 | 1 mg/kg |
| Plum, foreign. | 0.46 mg/kg | 0/55 | 2 mg/kg |
| Green bean with pod, foreign | 0.44 mg/kg | 0/36 | 2 mg/kg |
| Strawberry, foreign | 0.05 mg/kg | 0/26 | 5 mg/kg |
| Pepper, foreign | 0.14 mg/kg | 0/55 | 2 mg/kg |
| Salad, foreign | 0.028 mg/kg | 0/32 | 5 mg/kg |
| Tomato, foreign | 0.02 mg/kg | 0/26 | 2 mg/kg |
| Grapes | 0.07 mg/kg | 0/75 | 5 mg/kg |
Procymidone is amongst the 20 pesticides that, according to calculations by the Danish Food and Veterinary Administration, constitute the majority of the pesticide ingestion in 2007. The average ingestion has been calculated to be 0.7 µg/day/person (Danish Food and Veterinary Administration, 2008). For a 60 kg person this corresponds to 0.01 µg/kg BW/day.
The caloric consumption of 2-year-olds is approximately 325 kJ/kg BW., which is roughly 3 times that of adults. If a transformation factor of 3 is used for 2-year-olds, the corresponding exposure is derived fromof 0.04 µg/kg BW/day.
7.7.10.3 Combined exposure and risk
The total contribution for procymidone that was considered in the investigation comes from foods. As it can be discerned from Table 7.87 to Table 7.89 the contribution is so minimal that it only gives a visible contribution in the total calculations for the 50th percentile value and the maximum value, respectively, each of which constitute 0.04 µg/kg BW/day. The contribution is too small to be reflected in the RCR values, since the calculations are with two decimals.
7.7.11 Dioxins and dioxin-like PCBs
Table 7.63 Identification of dioxins.
| Chemical name | “Dioxins and dioxin-like PCBs” include polychlorinated dibenzo-para-dioxins (PCDD), polychlorinated dibenzofurans(PCDF) and polychlorinated biphenyls |
| CAS no. | Dioxins and dioxine-like PCBs comprise a whole group of the above substances. There is intergroup variation and thus CAS nos. etc. have not been given here. |
| EINECS no. | |
| Molecular formula (gross) | |
| Molecular structure | |
| Molecular weight | |
| Synonyms | |
| Classification |
7.7.11.1 NOAEL, AF and DNEL
For dioxins, an LOAEL of 25 ng 2,3,7,8-TCDD/kg (NOAEL not identified) is chosen for its antiandrogenic effects, based on reduced semen production in rats (Faqi et al. 1998). In the study, the dose has been administered as a loading dose before mating, with a subsequent maintenance dose of 5 ng/kg BW/week.
For dioxins and dioxin-like PCBs, the EU Scientific Committee on Foods (SCF) and the FAO/WHO Expert Committee on Food Additives (JECFA) have set a tolerable daily intake (TDI) of 2 pg/kg BW for 2,3,7,8-tetrachlor dibenzo-p-dioxin (TCDD). At assessment, the animal’s body load has been converted to the body load and daily dose for humans at continuous exposure. Next, a factor of uncertainty of 3 has been used to extrapolate from an LOAEL to an NOAEL level, and a factor of uncertainty of 3.2 is used to take into account intraspecies differences.
A toxic equivalent factor is used to measure the toxicity of the various PCDDs, PCDFs and PCBs that denotes the various potencies of the substances. As the most toxic, 2,3,7,8-TCDD has been allocated a toxicity of 1.
7.7.11.2 Exposure from foods
Bergkvist et al. (2008) have estimated the exposure from six food groups combined with data on food intake for 670 people aged between 1and 24. Swedish children up to 10 years of age have a median TEQ intake that is greater than the TDI of 2 pg/kg BW/d. Younger children between 1-3 years-old revealed a median TEQ intake of 4.4 – 4.3 pg/kg BW/day, while the 95th percentile lay between 6.6 and 8.1. Younger children have the highest exposure per kg BW, which drops with increasing age. The higher exposure is due to the fact that children consume more food than adults compared to their body weight. The youngest children in the Swedish study consumed 3-4 times more food compared to their body weight than did the average young adult.
Bergkvist et al. (2008) have estimated the exposure to dioxins and dioxin-like PCBs via foods, see table 7.64
Table 7.64 Exposure to dioxin-like substances in Swedish children aged 1-3 years (Bergkvist et al., 2008)
| pg WHO-TEQ/kg BW/day | ||
| boys | girls | |
| Median intake | 3.5 | 3.9 |
| Average TEQ intake | 4.2 | 4.3 |
| 95th percentile | 6.6 | 8.1 |
| Individuals exceed ingTDI (%) | 98 | 100 |
Therefore, in this project we have calculated the exposure to dioxin from foods for 2-year-olds as an average 4.3 pg WHO-TEQ/kg bW/day, and a maximum 8.1 pg WHO-TEQ/kg BW/day.
Bergkvist et al. calculate that average exposure via foods is distributed as 30% from diary products, 29% from fish, 12% from meat, 1% from eggs, and 28% from other fat-containing products.
7.7.11.3 Combined exposure and risk
The combined exposure and risk from dioxin and dioxin-like substances covered in this study, comes from foods. The Swedish study from 2008 states that children aged 1 – 3 years have an average intake that is twice as great as the TDI, while the maximum exceeds the TDI by four times. The RCR becomes 2 for average exposure and 4 for maximum exposure for dioxins and dioxin-like PCBs solely from foods. Any additional contribution of dioxin-like PCBs from the indoor climate arising from the use of PCB-containing building materials would therefore be undesirable as the background load of dioxins and dioxin-like PCBs from foods already exceeds the tolerable exposure.
7.7.12 Non-dioxin-like PCBs
Table 7.65 Identification of PCBs.
| Chmeical name | Polychlorinated biphenyls (PCBs). |
| CAS no. | PCBs is a collective name for an entire group of 209 closely-related polychlorinated biphenyls. There is intergroup variation, and therefore CAS nos, etc. have not been allocated for the substances. |
| EINECS No. | |
| Molecular formula (gross) | |
| Molecular structure | |
| Molecular weight | |
| Synonyms | |
| Classification |
7.7.12.1 Risk assessment
In the report, “Sundhedsmæssig vurdering af PCB-holdige bygningsfuger” (Health-related assessment of PCB-containing building joint-filler) Gunnersen et al. (2009), it is stated that the greatest exposure to PCB used in building joint-fillers is due to releases into the indoor air. Even though there is some exposure to dioxin-like PCBs, it is primarily non-dioxin-like PCBs that liberate into the indoor air. The risk assessment performed by Gunnersen et al. (2009) is based on an NOAEL of 0.036 mg/kg/day for non-dioxin-like PCB (PCB 28) with regard to the effect on the liver and thyroid. The assessment was not performed for antiandrogenic effects. Re-assessment of the toxicology of non-dioxin-like PCBs with regard to antiandrogenic effects or oestrogenic effects lies outside the remit of this project. Its relevance should also be considered taking into account that exposure to non-dioxin-like PCBs to some extent or other always occurs in conjunction with dioxin-like PCBs. It has already been concluded for these substances, that any additional contriubtion of PCBs to the antiandrogenic effect is deemed undesirable. Any additional contribution to exposure by the non-dioxon-like PCBs must similarly be deemed undesirable.
7.7.13 DDT
Table 7.66 Identification of DDT.
| Chemical name | Dichlorodiphenyltrichloroethane (DDT) |
| CAS no. | 50-29-3 |
| EINECS no. | |
| Molecular formula (gross) | C14H9Cl5 |
| Molecular structure | 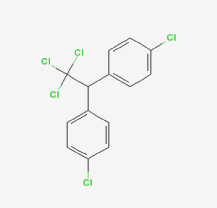 |
| Molecular weight | 354.48626 |
| Synonyms | |
| Classification | T;R25-48/25 CARC3;R40 N;R50/53 (LOFS) |
| Comments | The employed data sources for DDT also include the decomposition products DDE (1,1-dichloro-2,2-bis(p-chlorophenyl)ethylene) and DDD (1,1- dichloro-2,2-bis(p-chlorophenyl)ethane). |
7.7.13.1 NOAEL, AF and DNEL
For DDT, an LOAEL of 10 mg pp-DDE /kg BW/day (NOAEL is not identified) is chosen for its antiandrogenic effects, based on increased retention of nipples in the offspring of rats exposed during pregnancy (You et al. 1998).
The combined assessment factor is set to 300 based on a factor of 2.5 for general interspecies differences, 4 for allometric scaling between rats and humans, 10 for intraspecies differences, and 3 for LOAEL to NOAEL.
Thus the DNEL for pp-DDE becomes 0.03 mg/kg BW/day (LOAEL/AF).
7.7.13.2 Exposure from foods
Fromberg et al. (2005) estimated the adult daily ingestion of DDT based on measured findings in animal foods. This is expressed as the sum of DDT and its metabolites DDE and DDD.
The average ingestion of DDT from animal foods is 0.27 µg/day, the 90th percentile is 0.46 µg/day and the 95th percentile is 0.60 µg/day. When converted to units of kg BW for a 60 kg adult this corresponds to 0.005, 0.008 and 0.01 µg/kg BW/day, respectively.
The caloric consumption of 2-year-olds is approximately 325 kJ/kg BW., which is roughly 3 times that of adults. If a transformation factor of 3 is used for 2-year-olds, the corresponding exposure is obtained:
- Average: 0.01 µg/kg BW/day
- 90th percentile: 0.02 µg/kg BW/day
- 95th percentile: 0.03 µg/kg BW/day
7.7.13.3 Combined exposure and risk
The total DDT contribution that was considered in the investigation comes from foods. As it can be discerned from Table 7.87 to Table 7.89 the contribution is so minimal that it only gives a visible contribution to the total calculations for the average value (the 50th percentile) of 0.01 µg/kg BW/day and the maximum value, which gives a total of 0.03 µg/kg BW/day. The contribution is too small to be reflected in the RCR values, since the calculations are with two decimals.
7.7.14 Propyl-, butyl-, and isobutylparaben
7.7.14.1 Propylparaben, 94-13-3
Table 7.67 Identification of propylparaben.
| Chemical name | Propylparaben, 94-13-3 |
| CAS no. | 94-13-3 |
| EINECS no. | 202-307-7 |
| Molecular formula (gross) | C10-H12-O3 |
| Molecular structure | 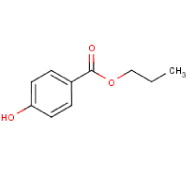 |
| Molecular weight | 180.2005 |
| Synonyms | Benzyl salicylate (2-hydroxybenzoic acid, benzyl ester) (R43) Propyl p-hydroxybenzoate |
| Classification | - |
7.7.14.2 NOAEL, AF and DNEL
For propylparaben, an LOAEL of 10 mg/kg BW/day (NOAEL is not identified) is chosen for its oestrogenic effects, based on decreased daily semen production in young rats (Oishi et al., 2002 in SCCP opinion: SCCP (2008)).
The combined assessment factor is set to 300 based on a factor of 2.5 for general interspecies differences, 4 for allometric scaling between rats and humans, 10 for intraspecies differences, and 3 for LOAEL to NOAEL.
Thus the DNEL for propylparaben is 0.03 mg/kg BW/day (LOAEL/AF).
Exposure from foods etc.
Soni et al. (2005) has calculated the possible average (PADI) and maximum (PMDI) ingestion via food for 2-4-year olds. The values are 105 and 179 mg, respectively, or 10 and 16 mg/kg BW/day, respectively, as calculated by Soni et al., using a body weight of 11 kg for the 2-4-year olds.
Propylparaben as a food additive is called E 216 or propyl-p-hydroxybenzoate, but its use was not permitted after 15 February 2008. The actual exposure through foods should therefore now be 0.
As mentioned in chapter 7.5.2.2, with the data currently available, it is not possible to obtain reliable quantitative estimates of the dermal uptake of parabens.
The industry, in its answer to the SCCP, gives an estimate of 1% absorption of unreacted butylparaben via the skin from cosmetic products, whilst a series of investigations suggest that the absorption could be higher. Due to some metabolisation in the skin the absorption presumably does not reach 100%. Therefore, the absorption is experimentally set to 10% with the condition that dermal uptake is the same for propylparaben and butylparaben.
7.7.14.3 Butylparaben, 94-26-8
Table 7.68 Identification of butylparaben.
| Chemical name | Butylparaben, 94-13-3 |
| CAS no. | 94-26-8 |
| EINECS no. | 202-318-7 |
| Molecular formula (gross) | C11-H14-O3 |
| Molecular structure | 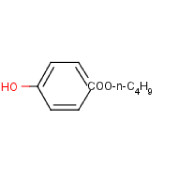 |
| Molecular weight | 194.2271 |
| Synonyms | Benzoic acid, 4-hydroxy-, butyl ester, Butyl 4-hydroxybenzoate, Butyl parahydroxybenzoate |
| Classification | - |
NOAEL, AF and DNEL
For butylparaben, an LOAEL of 10 mg/kg BW/day (NOAEL is not identified) is chosen for its oestrogenic effects, based on effects on semen quality and production, as well as decreased serum testosterone levels in young rats (Oishi et al., 2001 in SCCP opinion: SCCP (2008)).
The combined assessment factor is set to 300 based on a factor of 2.5 for general interspecies differences, 4 for allometric scaling between rats and humans, 10 for intraspecies differences, and 3 for LOAEL to NOAEL.
Thus the DNEL for butylparaben is 0.03 mg/kg BW/day (LOAEL/AF).
Exposure from foods etc.
It is assumed no contributions occur via foods since the use of butylparaben as a food additive is not permitted within the EU.
As mentioned in chapter 7.5.2.2, with the data currently available, it is not possible to obtain reliable quantitative estimates of the dermal uptake of parabens.
The industry, in its answer to the SCCP, gives an estimate of 1% absorption of unreacted butylparaben via the skin from cosmetic products, whilst a series of investigations suggest that the absorption could be higher. Due to some metabolisation in the skin the absorption presumably does not reach 100%. Therefore, the absorption is experimentally set to 10%.
7.7.14.4 Isobutylparaben, 4247-02-3
Table 7.69 Identification of isobutylparaben.
| Chemical name | Isobutylparaben, 94-13-3 |
| CAS no. | 4247-02-3 |
| EINECS no. | 224-208-8 |
| Molecular formula (gross) | C11H14O3 |
| Molecular structure | 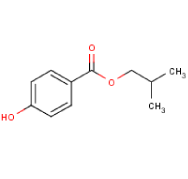 |
| Molecular weight | 194.2304 |
| Synonyms | 4-Hydroxybenzoic acid, 2-methylpropyl ester, isobutyl 4-hydroxybenzoate, 2-Methylpropyl 4-hydroxybenzoate, |
| Classification | - |
NOAEL, AF and DNEL
For isobutylparaben, an LOAEL of 72 mg/kg BW/day (NOAEL is not identified) is chosen for its oestrogenic effects, based on increased uterus weight in mice in an uterotrophic study (Darbre et al., 2002).
The combined assessment factor is set to 525 based on a factor of 2.5 for general interspecies differences, 7 for allometric scaling between rats and humans, 10 for intraspecies differences, and 3 for LOAEL to NOAEL.
Thus the DNEL for isobutylparaben is 0.14 mg/kg BW/day (LOAEL/AF).
Exposure from food, etc.
It is assumed no contributions occur via foods since the use of isobutylparaben as a food additive is not permitted within the EU.
As mentioned in chapter 7.5.2.2, with the data currently available, it is not possible to obtain reliable quantitative estimates of the dermal uptake of of parabens.
The industry, in its answer to the SCCP, gives an estimate of 1% absorption via the skin from cosmetic products, whilst a series of investigations suggest that the absorption could be higher. Due to some metabolisation in the skin the absorption presumably does not reach 100%. Therefore, the absorption is experimentally set to 10% with the condition that the dermal uptake is equal for isobutylparaben and butylparaben.
7.7.14.5 Exposure to parabens from consumer products
The DNEL values for the parabens (0.03 mg/kg BW/day for both propylparaben and butylparaben, and 0.14 mg/kg BW/day for isobutylparaben) indicate that propylparaben and butylparaben are the most potent substances, and is the reason in the exposure calculations that a worst-case scenario is assumed with cosmetic products containing 0.4% propylparaben and 0.4% butylparaben, i.e. the maximum allowed concentrations in the products. A worst case daily exposure dose for isobutylparaben is not calculated since the maximum permitted value of paraben contents is 0.8%, and would therefore give too large a contribution when tthe additive effects of the substances are calculated. The worst case daily exposure dose for isobutylparaben will, however, be equal to the value for the other two parabens, but the RCR value will be lower (approx. 4.5 times) due to a higher DNEL value than the other parabens.
Two-year olds can be exposed to parabens from several different sources. For the exposure calculations it is assumed that the 2-year-old is exposed to parabens via the cosmetic products listed in Table 7.71 (moisturising creams/oil-based creams/lotions, sunscreens, shampoo and soap). The assumptions made during the calculations are also stated in the table.
This project surveys the contents of moisturising creams/oil-based creams/lotions and sunscreens for children on the Danish market. The use of parabens in the 32 moisturising creams/oil-based creams/lotions and the 28 sunscreens is declared in the table below.
Table 7.70 The use of parabens in moisturising creams/oil-based creams/lotions and sunscreens surveyed on the Danish market in October 2008. Each row indicates by a cross the parabens that were found in the surveyed cream or sunscreen.
| No parabens | Methyl paraben |
Ethyl paraben |
Propyl paraben |
Butyl paraben |
Isobutyl paraben |
|
| Creams | 25 of 32 (78%) |
x | x | |||
| x | x | |||||
| x | x | x | ||||
| x | x | |||||
| x | x | |||||
| x | x | |||||
| x | x | |||||
| Sunscreens | 21 of 28 (75%) |
x | x | x | ||
| x | x | x | ||||
| x | x | x | ||||
| x | x | |||||
| x | x | x | x | x | ||
| x | x | |||||
| x |
From the table it can be seen that most typically methylparaben and propylparaben are used in the products (but only in 25 and 22% of the cases, respectively). Neither butylparaben nor isobutylparaben are used frequently.
No standard values for the use of creams and sunscreens have been found in the REACH Guidance Documents, but COLIPA estimates that 8 grams of body lotion/day is a realistic amount in a safety assessment of cosmetics for adults. For sun lotions, the estimate is 18 g/day (SCCP, 2006). Additionally, the typical use levels of cosmetics are stated in TGD (Appendix II, Table 14, page 242), (European Commission, 2003):
- For body lotion the typical use is stated as 7.5 g once or twice per day. In this report it assumed to be used twice a day in order to take into account children with eczema. The use of 7.5 g per application applies to adults. The use is proportionally downscaled for children by comparing the body surface of a 2-year-old and an adult.
- For sun lotions the typical use is stated as 10 g 2-3 times per day, but only for 3 weeks a year (2 weeks in the summer (full body use) and 1 week in the winter (only facial use).
- For shampoo the typical use is stated as 12 g 2-7 times per week for adults. It is assumed that children use half the amount stated. The worst case scenario is deemed to be daily use.
- For liquid soap the typical use is stated as 5 g 1-2 times per day for adults. It is assumed that children use half the amount stated. The calculations assume use once per day, since it is assumed that the 2-year-old is bathed at most once per day.
The EU Commission recommends that an adult use 36 g of sunscreen on the entire body (Recommendation by the Commission, 2006). The recommendations by the Danish Environmental Protection Agency are that children should use approx. 20 ml of sunscreen to completely cover the body, and adults should use 40 ml (The Cosmetics Guide by the Danish Environmental Protection Agency, 2008). Matas states on the sunscreen products that children should use 15-20 ml.
It is assumed that the density of sunscreens is slightly lessthan 1 (0.9 g/cm3), hence the 40 ml sunscreen recommendation is comparable with the 36 g recommendation for adults. The recommendation of the Danish Environmental Protection Agency on sunscreens is that children should use half of the recommended amount for adults. In the following calculations a value of 18 g of sunscreen is used for 2-year-olds.
With regard to the use of sunscreens in Danish day-care centres, the actual use differs widely from that described in TGD. In periods of sunshine, the message is typically that parents are responsible for applying sunscreens at home (before delivering the children) and the day-care centre applies sunscreen once again after lunch. Thus the values from TGD are not used in these exposure calculations. [27]
According to the UV index for the world as calculated by the DMI[28] (Danish Meteorological Institute), Denmark will have a UV index greater than 3, which implies necessary protection against the sun from May to September. The DMI also publishes climate normals for Denmark that include the number of sunshine hours per month.[29] The total number of sunshine hours from May to September as an average from 1961-1999 is 928 sunshine hours[30]. If it is assumed that sunscreen is applied to a 2-year-old twice for every 12 sunshine hours (approx. 1 day) then there will be 2 x 77 applications of sunscreen.
The majority of the applications of sunscreen will primarily occur on arms and on the face. Sunscreen will only be applied to legs in the warmer periods of summer, when children possibly wear shorts. The following is therefore assumed with respect to sunscreen applications:
- Two weeks (i.e. 14 days) with applications of sunscreen to the whole body.
- Two weeks (i.e. 14 days) with applications of sunscreen to the face, arms and legs.
- During the remaining days (77 –14 -14 = 49) the application of sunscreen occurs only on arms and face.
Contrary to adults, it is not assumed that sunscreen will be needed in the winter (winter break) as described in TGD because skiing holidays will not normally involve 2-year-olds.
Some of the products are bathroom products and are washed off after use. This necessitates the use of a dilution factor (retention factor) of 0.01. The retention factor has been introduced by the SCCNFP to account for products that are diluted when used and washed off after use, i.e. for shampoo products, body shampoos and similar rinse-off products. (SCCNFP 0690 (2003)). Since this exposure is in the bath tub, it is permissible to use the retention factor in this context too.
Table 7.71 Assumptions made for the use of cosmetic products for the exposure calculations of parabens. (The values in parenthesis are calculated later)
| Cosmetic products | Applications (how often) |
Is applied to how large a proportion of the body | Stay on/rinse off | Amount used per time? | Fraction of parabens in product. |
| Creams | Twice daily (3 times weekly) all year round |
The whole body (= 0.6 m2) |
Stay on[31] | 2.7 g6 | 0.004 |
| Sunscreens | Twice daily for 14 days (2 x 7 days) | The whole body (= 0.6 m2) |
Stay on | 18 g | 0.004 |
| Sunscreens | Twice daily for 14 days (2 x 14 days) | Only on face, arms and legs | Stay on | 8.6 g7 | 0.004 |
| Sunscreens | Twice daily for 49 days (2 x 11 days) | Only on face and arms | Stay on | 3.9 g8 | 0.004 |
| Shampoo | Once daily (3 times weekly) all year round |
Face (= 0.06 m2) |
Rinse off (i.e. correct result with a factor of 0.01) | 6 g | 0.004 |
| Liquid soap | Once daily (3 times weekly) all year round |
The whole body (= 0.6 m2) |
Rinse off (i.e. correct result with a factor of 0.01) | 2.5 g | 0.004 |
Additionally there will be contributions from other sources such as Shrovetide/Halloween makeup, makeup, lip balm, etc., which are assumed to have a significantly smaller effect than the above mentioned sources. Finally, there is a small exposure via the indoor climate (see the calculations in the chapter on indoor climate) that contributes less than 1/10,000 of the total effect of cosmetic products.
The exposure calculations are performed by multiplying the amount of product by the fraction of parabens in the product and by the number of uses per day. The result is divided by the body weight of 15.2 kg in order to obtain the amount of parabens per kg BW per day. 10% dermal uptake is factored into the calculations. The result of the calculations is given in the table below.
Table 7.72 Daily ingestion of parabens from cosmetic products based on the maximum allowed concentrations in the products – worst case
As can be seen, the use of moisturising creams/oil-based creams/lotions and sunscreens gives an RCR value that is larger than 1. Under the assumptions made, the use of these products can pose a risk.
Other uptake data:
It is investigated whether the RCR is larger than 1 for a more moderate use of moisturising creams/oil-based creams/lotions and sunscreens, where:
- The maximum use of moisturising creams/oil-based creams/lotions on the full body is 3 times per week (say, after a shower)
- Sunscreens are used less often, i.e. only in the two months when the daily average temperature is around 20°Celsius (July and August). There are 382 sunshine days during these two months according to DMI climate normals. If it is assumed as previously that the application of sunscreen is done twice every 12 sunshine hours, then this gives 2 x 32 applications distributed in the following way:
- One week (i.e. 7 days) with applications of sunscreen on the full body (very warm summers are rare in Denmark)
- Two weeks (i.e. 14 days) with applications of sunscreen to the face, arms and legs.
- During the remaining days (32 –7 -14 = 11) application of sunscreen occurs only on arms and face.
- Shampoo is used at most (i.e. the maximum number of showers): 3 times per week
- Soap is used at most (i.e. the maximum number of showers): 3 times per week
These assumptions yield the following result:
Table 7.73 Daily uptake of parabens from cosmetic products on the basis of the maximum allowed concentrations in the products – more realistic values
As can be seen, the use of moisturising creams/oil-based creams/lotions and sunscreens still give an RCR value that is 1 or larger than 1. Under the assumptions made, the use of these products can pose a risk.
Rastogi et al, 1995 has performed a survey of the content of parabens in 215 cosmetic products in Denmark. The results showed that 77% of the products contained a total of 0.1-0.97% parabens (the maximum allowed concentration is 0.8%). 99% of all the leave-on products contained parabens. The maximum concentrations of parabens were:
- Butylparaben 0.07%
- Propylparaben 0.32%
- Isobutylparaben (not considered in the survey).
If these concentrations of parabens are used on set no. 2 of the assumed uptake values (the smaller, more moderate uptake values) the RCR values still lie above 1, i.e. the use of moisturising creams/oil-based creams/lotions and sunscreens can result in endocrine disrupting effects (see Table 7.74). Furthermore contributions from any isobutylparaben that could be present should be added, since the sum of butylparaben and propylparaben in this case does not exceed the allowed value of 0.8%.
Table 7.74. Daily uptake of parabens from cosmetic products based on measured values in the products – more moderate values
As can be observed, the use of moisturising creams/oil-based creams/lotions and sunscreens still give an RCR value that is larger than 1. Under the assumptions made, the use of these products can pose a risk.
It should be pointed out that the survey of moisturising creams/oil-based creams/lotions and sunscreens on the market in this project has shown that parabens only occur in 22 and 25% of the products on the Danish market, respectively, which contrasts with the Rastologi study from 1995 (which however, was a survey of not only child creams/sunscreens) where a far greater percentage of products contained parabens. It is possible therefore to choose moisturising creams/oil-based creams/lotions and sunscreens that do not contain parabens.
Doubts as to the actual absorption of parabens:
For all of the above calculations, the value used for the absorption of parabens through the skin was 10%. This value for the absorption can be questioned as there is no reliable data available. The industry in its answer to the SCCP estimates an absorption of 1% for butylparaben, whereas a number of studies indicate that this value might be greater. The daily ingestion value of parabens has been calculated experimentally at 1, 5, 10, and 50% dermal uptake. The calculations are performed by employing the previously mentioned amounts of product, the previously measured actual values for the content of propyl and butylparaben (i.e. 0.32% and 0.07%) as well as the more realistic values for the use of moisturising creams/oil-based creams/lotions, sunscreens, shampoo and soap, i.e.:
- Use of moisturising creams/oil-based creams/lotions, shampoo and soap 3 times per week.
- The first uptake scenario for sunscreens described (i.e. 14 days of application to the whole body, 14 days of application to face, arms and legs, as well as 49 days of application of arms and face).
The values employed in the calculations are given in the table below.
Table 7.75 Values used for the calculation of the daily uptake of parabens from cosmetic products on the basis of measured concentrations in the products (variation of Fabs).
| Product | Substance | Amount of product (mg) | Weight fraction of parabens in product. | Retention factor | F abs | Number of uses per day | Average weight, 2-year-old |
| Creams | Propylparaben | 2700 | 0.0032 | 1 | 0.01 – 0.5 | 3/7 | 15.2 |
| Butylparaben | 2700 | 0.0007 | 1 | 0.01 – 0.5 | 3/7 | 15.2 | |
| Sunscreens 14 days: Full body | Propylparaben | 18000 | 0.0032 | 1 | 0.01 – 0.5 | 2 x 14/365* | 15.2 |
| Sunscreens 14 days: Full body | Butylparaben | 18000 | 0.0007 | 1 | 0.01 – 0.5 | 2 x 14/365* | 15.2 |
| Sunscreens 14 days: Face, arms and legs | Propylparaben | 8600 | 0.0032 | 1 | 0.01 – 0.5 | 2 x 14/365* | 15.2 |
| Sunscreens 14 days: Face, arms and legs | Butylparaben | 8600 | 0.0007 | 1 | 0.01 – 0.5 | 2 x 14/365* | 15.2 |
| Sunscreens 49 days: Face and arms | Propylparaben | 3900 | 0.0032 | 1 | 0.01 – 0.5 | 2 x 49/365* | 15.2 |
| Sunscreens 49 days: Face and arms | Butylparaben | 3900 | 0.0007 | 1 | 0.01 – 0.5 | 2 x 49/365* | 15.2 |
| Shampoo | Propylparaben | 6000 | 0.0032 | 0.01 | 0.01 – 0.5 | 3/7 | 15.2 |
| Butylparaben | 6000 | 0.0007 | 0.01 | 0.01 – 0.5 | 3/7 | 15.2 | |
| Liquid soap | Propylparaben | 2500 | 0.0032 | 0.01 | 0.01 – 0.5 | 3/7 | 15.2 |
| Butylparaben | 2500 | 0.0007 | 0.01 | 0.01 – 0.5 | 3/7 | 15.2 |
* Sunscreens are only used in the summer period, hence a daily average use for the entire year has been calculated.
Using the numbers in the table above gives the values for the daily uptake and the RCR values of dermal uptake of parabens listed in the table below. These vary between 1 and 50%. The calculations attempt to demonstrate the significance of the absorption of parabens through the skin, as due to the lack of data there is no agreement on an absolute value.
Table 7.76. The variation in the daily ingestion of parabens from cosmetic products based on measured concentrations in the products (variation of FABS ranging from 1 to 50%).
From the table it can be seen that the RCR value is less than 1 only for dermal absorption of parabens at values less than 5%.
7.7.14.6 Exposure from indoor climate
In reality the small contribution from the indoor climate for butylparaben of max.0003 µg/kg BW/day should be added here, but this value constitutes only a miniscule fraction in comparison to the contributions from the cosmetics, which is why it can be ignored in the calculations.
7.7.14.7 Combined exposure and risk
The different contributions of parabens for both the summer scenario and the winter scenario are summarised in the tables below, assuming that the dermal uptake of parabens is 10% (for the most realistic ingestion scenario, as described in Table 7.76).
Table 7.77 Daily absorbed dose of propylparaben from various sources
| Summer scenario | Winter scenario | |||
| Source | Daily uptake (µg/kg BW/day) |
RCR | Daily uptake (µg/kg BW/day) |
RCR |
| Creams | 24.2 | 0.8 | 24.4 | 0.8 |
| Sunscreens, total | 65.0 | 2.2 | ||
| Shampoo | 0.55 | 0.02 | 0.55 | 0.02 |
| Liquid soap | 0.25 | 0.01 | 0.25 | 0.01 |
| Dust, total | 90.2 | 3.03 | 25.2 | 0.83 |
Table 7.78 Daily absorbed dose of butylparaben from various sources
| Summer scenario | Winter scenario | |||
| Source | Daily uptake (µg/kg BW/day) |
RCR | Daily uptake (µg/kg BW/day) |
RCR |
| Creams | 5.3 | 0.2 | 5.3 | 0.2 |
| Sunscreens, total | 14.2 | 0,5 | ||
| Shampoo | 0.1 | 0.005 | 0.1 | 0.005 |
| Liquid soap | 0.05 | 0.0015 | 0.05 | 0.0015 |
| Total | 19.7 | 0,71 | 5.45 | 0.21 |
As previously mentioned there is no calculated data (and hence no table) for isobutylparaben in the survey, since only the two most potent parabens were considered initially.
It should be noted that the in this project, the survey has only identified a parabens in 22 and 25% of the investigated moisturising creams/oil-based creams/lotions and sunscreens, respectively. Of these, parabens were identified in the following percentages: Isobutylparaben in 0 and 4%, butylparaben in 3 and 4% and propylparaben in 16 and 21%, respectively, of the creams and sunscreens. It is possible to choose moisturising creams/oil-based creams/lotions and sunscreens for 2-year-olds on the Danish market that do not contain parabens. This survey also shows that there has been a significant reduction in the use of parabens in cosmetic products since the Rastologi survey from 1995, which however considered cosmetic products generally and not just childcare products.
7.7.15 Bisphenol A, 80-05-7
Table 7.79 Identification of Bisphenol A.
| Chemical name | Bisphenol A |
| CAS no. | 80-05-7 |
| EINECS no. | 201-245-8 |
| Molecular formula (gross) | C15-H16-O2 |
| Molecular structure | 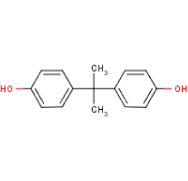 |
| Molecular weight | 228.2863 |
| Synonyms | 4,4'-(1-Methylethylidene)bisphenol, 4,4'-Isopropylidenediphenol |
| Classification | XI;R37-41 R43 REP3;R62 (LOFS) |
NOAEL, AF and DNEL
For bisphenol A, an NOAEL of 50 mg/kg BW/day (LOAEL 500 mg/kg/day) is chosen for its antiandrogenic effects, based on the effects on reproduction in mice (increased duration of pregnancy, increased incidence of undescended testes in male mice, abnormal growth of cells in the epididymis, and delayed puberty measured as separation of prepuce and penis in young males (Tyl et al., 2007 in an EU Risk Assessment: European Chemicals Bureau (2008a)).
The combined assessment factor is set to 175 based on a factor of 2.5 for general interspecies differences, 7 for allometric scaling between mice and humans, and 10 for intraspecies differences.
Hence, the DNEL for bisphenol A is 0.29 mg/kg BW/day (NOAEL/AF).
7.7.15.1 Exposure from foods etc.
Bisphenol A in polycarbonate plastics, tooth fillings and epoxy lacquer on the inner side of cans (Bisphenol –a.org., 2009).
In 2006, the EFSA (EFSA, 2009) updated its earlier assessment of bisphenol A in plastic materials in contact with foods with an exposure calculation for children. The EFSA has estimated the exposure via diet for several age groups, of which the group 1½-year-olds is the one that approaches the target group of this report: The 2-year olds
The EFSA’s conservative estimate for the 1½-year-olds is:
5.3 µg/kg BW/day
This assumes the ingestion of 2 kg of commercially processed food and beverage every day. The estimate is obtained by including the exposure via can food and foods in contact with polycarbonate (feeding bottles, service and storage containers). Exposure from the use of microwave heating of polycarbonate material or the use of drinking water from polycarbonate or epoxy coated water pipes and water containers was not included.
The NTP (2008) has calculated, on the basis of findings of bisphenol A concentrations in the urine of 90 6-8 year old girls, a median ingestion of 0.07 µg/kg BW/day, with a variation of <0.012–2.17 µg/kg BW/day. This reflects the fact that exposure comes from all sources; the environment, materials in contact with food; tooth fillings; toys; skin care products; etc.
The most important differences between the exposure of the 1½-year-old and the 6-8-year-olds are probably that the 1½-year-olds have more intense sucking habits and larger exposure via food ingestion measured compared to body weight. One can use the number for the 1½-year olds in the estimate for the 2-year-olds with the addition of the exposure via sucking and handling of toys and other items, the values of which can be found via measurements of the consumer products.
The following absorption values are used in agreement with the data given in the EU Risk Assessment (European Chemicals Bureau, 2003 a):
- Dermal: 10%
- Oral: 100%
- Inhalation: 100%.
7.7.15.2 Exposure from consumer products
Bisphenol A has not been identified in previous surveys, but is found in pacifiers as the only product group in this survey.
Values of the analysis
The table below displays the values for Bisphenol A in this project.
Calculation of exposure – other objects
In this project, Bisphenol A was identified in the coverage of two pacifiers made of polycarbonate. The measured values range between 106 and 280 mg/kg. Migration analyses of sweat and saliva were performed for both samples. A sweat simulant has been used in the analysis because the coverage of the pacifier constitutes the largest part and is in direct dermal contact with the child's skin surrounding the mouth. The results show that there is only a minor migration of Bisphenol A to sweat, with a value of 7 mg/kg for the pacifier with the higher content of Bisphenol A. This was only identified in one of the dual analyses. The detection threshold was 5 mg/kg.
Table 7.80 Overview of findings of Bisphenol A in the products analysed in this project
| Product type + no. | Screening analysis, ug/g | Quantitative analysis, ug/g | Migration analysis, ug/g | Migration period, hours | Migration fluid |
| 5-1, Pacifier (coverage) | 1900 | 106 | n.d. | 7.75 | Sweat |
| n.d. | 7.75 | Saliva | |||
| 5-3, Pacifier (coverage) | 1600 | 280 | 7* | 7.75 | Sweat |
| n.d. | 7.75 | Saliva |
*: Only found in one of the samples.
n.d. Signifies that the substance has not been detected.
As described in the section “Exposure calculations – method”, it is assumed that the dermal contact with the coverage of the pacifier occurs for 7 hours and 45 minutes per day. Dermal contact occurs when sucking on the pacifier or by contact of the coverage with the mouth. It is assumed that 100% of the Bisphenol A that migrates is taken up via the skin, or is taken in directly through the mouth (pacifier in mouth) or by later sucking on the fingers. It is assumed that the child is in contact with 25% of the surface area of the pacifier.
Pacifier no. 5-3 weighs 9.6 g, of which 80% (i.e. 7.68 g) is estimated to be made up of the coverage, which is made of the material (polycarbonate) that contains Bisphenol A.
The following exposure values are obtained for the pacifier:
Table 7.81 Daily ingestion of Bisphenol A from other objects based on measured migration values
| Product | Weight product (g) | Max measured migration value (µg/g) | Fraction of product in dermal contact. | Average weight, 2-year-old | Exposure (hours) | Daily ingestion (µg/kg BW/day) |
Calculated DNEL (mg/kg BW/day) |
RCR |
| Pacifiers | 7.68 g | 7 per 7 h and 45 min | 0.25 | 15.2 | 7.75 | 0.88 | 0.29 | 0.0030 |
7.7.15.3 Exposure from indoor climate
The exposure calculation for Bisphenol A via the indoor climate is presented and calculated in the section on indoor climate, but is reproduced in the table below.
Table 7.82 Daily ingestion of Bisphenol A via the indoor climate (dust and air) Based on 95th percentile
| Material | Daily ingestion at 100 mg dust (µg/kg BW/day) |
RCR (at 100 mg dust) |
Daily ingestion at 50 mg dust (µg/kg BW/day) |
RCR (at 50 mg dust) |
| Bisphenol A | 0.12 | 0.0004 | 0.06 | 0.0002 |
Table 7.83 Daily ingestion of Bisphenol A through the indoor climate (dust and air) On the basis of the 50th percentile
| Substance | Daily ingestion at 100 mg dust (µg/kg BW/day) |
RCR (at 100 mg dust) |
Daily ingestion at 50 mg dust (µg/kg BW/day) |
RCR (at 50 mg dust) |
| Bisphenol A | 0.01 | 0.00003 | 0.003 | 0.00001 |
The calculation shows that the RCR value is less than 1, which indicates that there is no risk of endocrine disrupting effects consequent to exposure to Bisphenol A via the indoor climate.
7.7.15.4 Combined exposure and risk
In the table below the various contributions to Bisphenol A are summarised.
Table 7.84 Daily ingestion of Bisphenol A from various sources
| Summer scenario | Winter scenario | |||
| Source | Daily ingestion (µg/kg BW/day) |
RCR | Daily ingestion (µg/kg BW/day) |
RCR |
| Foods combined 50th percentile | 0.07 | 0.00024 | 0.07 | 0.00024 |
| Foods combined max | 5.3 | 0.0183 | 5.3 | 0.0183 |
| Indoor climate, combined 50th percentile | 0.003 | 0.00001 | 0.005 | 0.00002 |
| Indoor climate, combined 95th percentile | 0.06 | 0.0002 | 0.12 | 0.0004 |
| Pacifier | 0.88 | 0.0030 | 0.88 | 0.0030 |
| Total (50th percentile) | 0.96 | 0.0033 | 1.00 | 0.0034 |
| Total (95th percentile) | 6.24 | 0.0215 | 6.30 | 0.0217 |
For Bisphenol A, the TDI value (based on liver damage as the toxic effects on the liver is the most sensitive endpoint) was larger than the DNEL value used (based on hormonal effects) by a factor of 10. From the table it can be discerned that the total bisphenol A contribution does not constitute a risk for either the summer scenario or the winter scenario under the assumptions made. This is in agreement with the calculations made by EFSA showing that not even infants, who have the largest bisphenol A contribution via foods, attain more than 26% of the TDI value (EFSA, 2009).
7.8 Cumulative risk assessment of potential endocrine-like substances
7.8.1 Risk assessment, overview summary
The calculated total risk for each substance is stated by the RCR values (see tables below).
The maximum RCR value is calculated in such a way that the maximum values are summated. 95th percentile values have been used in the cases where maximum values for the substance were not available. 95th percentiles have also been used for the indoor climate, since there can be extreme differences in the maximum value and the 95th percentile.
For the other RCR column labelled "RCR (total of 50% and eventual alternative scenario)" a total of the 50% (where applicable) and the other alternative low or medium scenarios was employed. If several scenarios occur, the minimum value is used. This column thus represents neither an RCR value of 50% nor a minimum RCR value, but is an expression of a total of the remaining scenarios, that form a counterpart to the calculated maximum RCR. This has been calculated to show the range between the maximum/95th percentile values and the alternative values.
As there is a difference in the behavioural patterns of 2-year-olds in the summer half-year and in the winter half-year, both a summer scenario and a winter scenario have been considered in order to include the most realistic exposure for both half-years.
The elements that are common to both the summer scenario and the winter scenario are included in both scenarios, in particular the following factors:
- Ingestion of foods
- Contact with objects other than toys, i.e. moisturising cream, bath articles and textiles other than winter clothing (jackets/mittens).
7.8.1.1 Summer scenario
The following factors have been included in the summer scenario (see table below):
- Contact with sunscreens.
- Contact with rubber clogs (no socks are worn).
- Dermal contact with toys for 9 hours in the summer
- Ingestion of 50 mg dust (US EPA states this value for the summer scenario).
Table 7.85 Calculation of RCR. Summer scenario with maximum value for rubber clogs. Red numbers indicate the RCR > 1
The content of phthalates in the examined rubber clogs was shown to exceed the permitted values; hence a table has been inserted that does not inlcude the contribution from these shoes. As requested by the Danish Environemntal Protection Agency, the table for toys only includes the phthalate with the maximum contribution to the RCR value for toys, in order not to use an overestimate for the exposure time for toys (in the calculations a 9 hour exposure has been used for each phthalate for toys). These calculations are given in the table below.
We compare the calculations where only one phthalate contributes to the RCR value with the calculations where all the phthalates contributed to the RCR values. It turns out that the difference is minimal, i.e. only 2 points at the 2nd decimal place for the total of the RCR values. It should be noted that toys were found containing more than one phthalate. It is possible that the 2-year-old could be in contact with toys at home or in the childcare institution, such that exposure to phthalates is higher than that stated in the table below. Because the difference is minimal, it is not possible to interpret this from the total risk, when the value is rounded up/down to a whole number.
[1] RCR for PCBs in the indoor climate has not been calculated because the proportion that represents non-dioxin-like PCBs is highly variable. As the RCR for dioxin-like PCBs from foods alone exceeds 1, any contribution from the indoor climate is undesirable.
Table 7.86 Calculation of RCR. Summer scenario without rubber clogs and without contribution of phthalates from toys. Red numbers indicate the RCR > 1
7.8.1.2 Winter scenario
The following factors have been included in the winter scenario (see table below):
- Dermal contact with toys for 6 hours in the winter.
- Contact with jackets/mittens for 3 hours.
- Ingestion of 100 mg dust (US EPA states this value for the winter scenario, where one is more indoors).
Similarly to the summer scenario, the difference between including the contribution from toys in for the phthalate with the maximum contribution, and for all the other phthalates, in the calculations of the RCR value is minimal. The difference is only 2 points at the 2nd decimal place of the total of the RCR values. In order to avoid misinterpretations the contribution of toys from all phthalates is deliberately given in the table below. This is because the difference is minimal and cannot be read from the total risk when this result is rounded up/down to a whole number.
Table 7.87 Calculation of RCR. Winter scenario with a minimal contribution from phthalates in toys. Red numbers indicate the RCR > 1
7.8.2 Risk assessment, total for antiandrogenic substances
The total risk for each antiandrogenic substance is calculated and stated in the table below.
Table 7.88. Total RCR for antiandrogenic substances
| Substance | Summer scenario with rubber clogs (i.e. max. value) | Summer scenario without rubber clogs and with no contribution of phthalates from toys (i.e. minimum values) | Winter scenario with no contribution of phthalates from toys (i.e. minimum values) | |||
| RCR (50% ) |
RCR (95% and max) |
RCR (50% ) |
RCR (95% and max) |
RCR (50% ) |
RCR (95% and max) |
|
| DEHP | 0.40 | 1.51 | 0.39 | 1.51 | 0.46 | 1.98 |
| DINP | 0.01 | 0.02 | 0.01 | 0.02 | 0.01 | 0.02 |
| DBP | 12.67 | 14.87 | 1.32 | 3.62 | 1.41 | 3.90 |
| DIBP | 0.04 | 0.04 | 0.00 | 0.00 | 0.00 | 0.01 |
| BBP | 0.01 | 0.04 | 0.01 | 0.04 | 0.01 | 0.05 |
| Prochloraz | 0.00 | 0.00 | 0.00 | 0.00 | 0.00 | 0.00 |
| Tebuconazole, 107534-96-3 | 0.00 | 0.00 | 0.00 | 0.00 | 0.00 | 0.00 |
| Linuron, 330-55-2 | 0.00 | 0.00 | 0.00 | 0.00 | 0.00 | 0.00 |
| Vinclozolin | 0.00 | 0.00 | 0.00 | 0.00 | 0.00 | 0.00 |
| Procymidone | 0.00 | 0.00 | 0.00 | 0.00 | 0.00 | 0.00 |
| Dioxins and dioxin-like PCBs | 2 | 4 | 2 | 4 | 2 | 4 |
| PCBs (DK) | ||||||
| DDT | 0.00 | 0.00 | 0.00 | 0.00 | 0.00 | 0.00 |
| Total | 15.13 | 20.48 | 3.73 | 9.19 | 3.89 | 9.,96 |
The result shows that irregardless of whether the summer scenario or the winter scenario are considered with shoes, without shoes and with all phthalates, the RCR value for the antiandrogenic substances is much greater than 1. The significant contributions to the RCR value come the from DEHP, DBP and PCB concentrations in foods.
Any additional contribution from other sources and other substances could contribute to an even higher RCR total for the antiandrogenic substances.
7.8.3 Risk assessment, total for oestrogenic substances
The total risk for each oestrogenic substance is calculated and stated in the table below.
Table 7.89 Total RCR for oestrogenic substances
| Substance | Summer scenario | Winter scenario | ||
| RCR (50% ) |
RCR (95% and max) |
RCR (50% ) |
RCR (95% and max) |
|
| Propylparaben | 3.03 | 3.03 | 0.83 | 0.83 |
| Butylparaben | 0.71 | 0.71 | 0.21 | 0.21 |
| Isobutylparaben, 94-13-3 | 0.00* | 0.00* | 0.00* | 0.00* |
| Bisphenol A | 0.00 | 0.01 | 0.00 | 0.02 |
| Total | 3.74 | 3.76 | 1.04 | 1.06 |
* It should be noted that the RCR value for isobutylparaben has not been calculated. This is primarily because the focus was on propyl and butylparaben, not onlybecause they are the two most potent parabens (lowest DNEL value), but also because isobutylparaben has only been identified in 1 of 60 sunscreens and creams surveyed in this project.
Since no oestrogenic substances were measured or found in either the rubber clogs or toys, the results show that irregardless of whether calculations are done on the summer scenario with or without rubber clogs, the RCR values are identical for the oestrogenic substances. For the summer scenario the RCR values are of around 3 and thus above 1. Propyl- and butylparaben in sunscreens are the most significant contributors to the RCR. The total contribution in the winter scenario is smaller than for the summer scenario, but the RCR value in the winter scenario is also above 1.
To this result one needs to add any possible contributions from other sources, for instance the use of sunscreens in the winter half-year and other cosmetic products all year around, as well as other substances that have been assessed as potential contributors to the RCR total for oestrogenic substances.
7.8.4 Risk assessment totalled for oestrogenic and antiandrogenic substances
In this section, the risk at exposure to both antiandrogens and oestrogen-like substances that affect the male reproductive system is calculated. This is based on an assumption thtat combination effects may be present when the substances’ effects are identical, even though the underlying mechanisms are different. However, to date there have been no animal studies demonstrating combined effects of antiandrogenic and oestrogen-like substances. On the rother hand, it has not been disproved, and it is normally very difficult to differentiate clearly between oestrogen-like and antiandrogenic substances, because both can induce the same type of effects; demasculinisation of the male reproductive system. In animal studies, antiandrogens can result in demasculinisation by reducing the effect of the male sex hormones, while oestrogen-like substances can result in demasculinisation by changing the balance between male and female sex hormones. Some substances that were orginally classified as oestrogen-like, have also been shown to have antiandrogenic effects, and vice-versa. Based on careful regulatory access, it is therefore assumed that concomitant exposure to two types of endocrine disruptors with similar effects can result in endocrine disrupting effects if the total risk characterisation coefficient is greater than 1.
All the antiandrogenic substances selected will be included in the total risk assessment, while only those oestrogen-like substances that result in demasculinisation of the male reproductive system will be included. Thus, propylparaben and butylparaben, which both have effects on young male rats’ sperm production, and bisphenol A, which affects descent of the testicles, development of the epididymis, and puberty in young male mice exposed during the foetal stage, will be included.
The total risk at exposure to oestrogen-like and antiandrogenic substances has been calculated and is presented in the table below.
| Summer scenario with rubber shoes (i.e. max. values) | Summer scenario without rubber shoes and no phthtalate contribution from toys (i.e. min. values) | Winter scenario with no phthtlate contribution from toys (i.e. min. values) | ||||
| RCR (50% ) |
RCR (95% and max) |
RCR (50% ) |
RCR (95% and max) |
RCR (50% ) |
RCR (95% and max) |
|
| DEHP | 0.40 | 1.51 | 0.39 | 1.51 | 0.46 | 1.98 |
| DINP | 0.01 | 0.02 | 0.01 | 0.02 | 0.01 | 0.02 |
| DBP | 12.67 | 14.87 | 1.32 | 3.62 | 1.41 | 3.90 |
| DIBP | 0.04 | 0.04 | 0.00 | 0.00 | 0.00 | 0.01 |
| BBP | 0.01 | 0.04 | 0.01 | 0.04 | 0.01 | 0.05 |
| Prochloraz | 0.00 | 0.00 | 0.00 | 0.00 | 0.00 | 0.00 |
| Tebuconazole | 0.00 | 0.00 | 0.00 | 0.00 | 0.00 | 0.00 |
| Linuron | 0.00 | 0.00 | 0.00 | 0.00 | 0.00 | 0.00 |
| Vinclozolin | 0.00 | 0.00 | 0.00 | 0.00 | 0.00 | 0.00 |
| Procymidone | 0.00 | 0.00 | 0.00 | 0.00 | 0.00 | 0.00 |
| Dioxins and dioxin-like PCBs | 2 | 4 | 2 | 4 | 2 | 4 |
| PCBs | ||||||
| DDT | 0.00 | 0.00 | 0.00 | 0.00 | 0.00 | 0.00 |
| Propylparaben | 3.0 | 3.0 | 3.03 | 3.03 | 0.83 | 0.83 |
| Butylparaben | 0.71 | 0.71 | 0.71 | 0.71 | 0.21 | 0.21 |
| Bisphenol A | 0.00 | 0.02 | 0.00 | 0.02 | 0.00 | 0.02 |
| Total (PCB DK ) |
18.84 | 24.21 | 7.44 | 12.92 | 4.93 | 11.02 |
7.8.5 Discussion and conclusion
Researchers have long known that endocrine disruptors can affect sexual development in laboratory animals. Findings in males included malformed genitals, undescended testicles to the scrotum at birth (cryptorchidism), decreased sperm quality as well as testicular cancer later in life (Sharpe, 2009). Similar symptoms have been observed in humans, and new Danish research shows that Danish girls develop breasts earlier than 15 years ago. Exposure to endocrine disruptors in the environment is suspected to be a contributory factor in the development of these syndromes in the general population (Aksglaede et al., 2009). However, in humans it is much more difficult to prove a cause-effect relationship.
A risk assessment is normally performed by assessing the exposure to a single substance in a single product. We are exposed to many different products on a daily basis, of which several contain the same chemical substances. We are also exposed to many different chemical substances that can have the same toxicological effect. This project attempts to take into account some of these combination effects.
In the past few years, surveys have shown surprising results on combination effects (also known as cocktail effects) of endocrine disruptors. A new Danish survey has revealed serious malformations in baby rats when female rats are exposed to a mixture of endocrine disruptors at concentrations which would not by themselves cause an effect. An expert workshop was held to follow up these results. Several world leaders in endocrine disruptors and combination effects met in Denmark in January 2009, where they considered on current knowledge on combination effects and possibilities for introducing legislation to address the issue. In the report from the workshop, the experts emphasise the fact that the risks posed by chemicals are currently underestimated because we do not take into account our daily exposure to a cocktail of many different substances, including endocrine disruptors. The advice from the experts is that, it is possible and necessary to include the risks of combination effects when performing a risk assessment of endocrine disruptors. The experts also refer to a so-called dose addition method that can be used until further knowledge is acquired. This project attempts to use the dose addition method for exposure to a series of substances that have been proven to exhibit endocrine disrupting effects in animal studies.
The present project has shown that if one considers the total exposure as the sum of exposure from all the products suurrounding a 2-year-old, then for certain individual substances such as DBP, dioxins and dioxin-like PCBs, and propyl- and butylparaben, the individual substance can in themselves pose a risk.
If the exposure is then assessed together with the substances that are suspected of having antiandrogenic or oestrogen-like effects, the total contribution will result in a potential risk for endocrine disrupting effects.
The current investigation is, however, based on random samples of individual consumer products and product groups. There may therefore be other chemical substances suspected of having endocrine disrupting effects, and other products on the market that contribute to this risk. In addition to the exposure contributions included in these calculations, there may be other contributing factors that could increase overall risk, including for instance:
- Potential endocrine disrupting effects like the ones stated in the screening investigations of the project in chapter 3, among these the QSAR predictions.
- Contributions from propyl, butyl and isobutylparaben in sunscreens used in the winter half-year (e.g. during winter break beach holidays).
- Contributions from propyl, butyl and isobutylparaben in other cosmetic products, which are used both in the summer and the winter. e.g. after-sun lotion, Shrovetide/Halloween makeup.
- Contribution of phthalates from other footwear, e.g. rubber sandals and rubber shoes.
- Contributions from the indoor climate in cars and other means of transport. e.g. the value of the DEHP contribution from the indoor climate in cars of 21µg/m3 as stated in the EU Risk Assessment for DEHP (European Chemicals Bureau, 2008, p. 256).
- Contributions from outdoor air, etc.
In addition, there may be a greater contribution from some of the consumer products, as some values (such as for toys) may be underestimated consequent to the estimates necessary for the weight of the products in the calculations. In addition, the actual number of products used by the 2-year-old constitutes a factor that may further contribute to the calculated risk; for example, it should be assumed that pacifiers are replaced more often than mittens and jackets.
It should also be noted that the project's calculations include many conditions that are based on estimates. This is due to the fact that there is no clear documentation in the areas concerned. Such types of estimate can produce distorted results and may mean that the overall exposure is estimated at a higher level than is actually the case, as all estimates are based on worst-case considerations. The following results are deemed to be uncertain:
- For several of the phthalates the contents in foods are based on one source, which exclusively states a total estimate and the percent-wise distribution of indoor climate, foods and other products. When generating the report, it became evident from the calculation of total exposure that this is not valid.
- For the indoor climate: Surveys from other countries such as Sweden and the US have been used where no applicable Danish surveys have been found. It is not certain whether these numbers correspond to Danish conditions.
- For propyl and butylparaben in particular, that have been included in the cumulative risk assessments, the selected LOAEL based effects have been found in a few studies conducted by a Japanese group (Oishi et al.) In the SCCP opinion from 2005, doubt is raised concerning the validity of these results and SCCP has asked the industry to provide results from developmental toxicity studies, which can determine whether or not propyl, butyl and isobutylparaben have endocrine disrupting effects in animals. The industry has subsequently attempted to repeat the studies and show that the substances do not induce endocrine disrupting effects. The studies performed by the industry have nevertheless been rejected by the SCCP on the grounds of questionable validity (SCCP, 2006a). The question of whether the three parabens are able to induce endocrine distrupting effects thus remains inconclusive. The procedure chosen for this report can therefore be perceived as rather cautious, since the work was based on studies showing the strongest endocrine disrupting effects.
- For parabens the dermal uptake is estimated at 10%. As stated several times in the report, there is currently no documentation for skin absorption, metabolism and excretion of parabens. The EU’s Scientific Committee for consumer products has stated that this documentation will be available shortly, after which a more accurate risk assessment of parabens can be performed.
Based on the present investigation it can be concluded that:
- Single effects with a high content of an endocrine disruptor, such as is seen with the content of DBP in rubber clogs may result in a critical risk for the 2-year-old.
- The contributions that 2-year-olds absorb especially from the phthalate DBP (mostly from foods, if we discount the rubber clogs) and dioxin and dioxin-like PCBs (mostly from foods and partly from the indoor climate) constitute a risk for antiandrogenic disruptions to the endocrine system.
- The contributions that 2-year-olds absorb from the parabens propylparaben and butylparaben, in particular, can constitute a risk for oestrogenic disruptions of the endocrine system. These contributions originate predominantly from cosmetic products such as moisturising creams/oil-based creams/lotions and sunscreen.
In summary, it can be concluded that there is not only a need to reduce exposure to antiandrogenic and oestrogen-like substances from foods and the indoor climate, but also from products in the studied product groups. Based on the assumptions made in this report, these contribute to both the indoor climate and to the direct exposure. A reduction of the potential cumulative risk requires knowledge of which sources are present in foods and the indoor climate. Furthermore, there is a need to reduce possible contributions from other sources, e.g. propyl, butyl and isobutylparaben in cosmetics, phthalates from other footwear (e.g. rubber clogs and rubber shoes).
[16] Bremmer HJ, van Veen MP. Children's toys fact sheet: to assess the risks for the consumer. Bilthoven: Rijksinstituut voor Volksgezonheid en Milieu, National Institute of Public Health and the Environment, 2002. (RIVM report).
[18] Migration by contact with urine is not considered in this project.
[19] Body/torso is the body without limbs and neck/head.
[20] Hawley, 1985 refers to the source Poiger & Schlatter, 1979, where the compound TCDD was given orally in ethanol to rats. After 24 hours, 26.7 % of the total dose was found in the liver. If TCDD was administered mixed with earth, half of that amount was found in the liver after 24 hours.
[21] The numbers are obtained from table 4.1
[25] The products were bought in Norway, but could have been bought in Denmark.
[26] It is stated that an arm weighs 3.5 g, a boot 16 g and a leg 5 g on http://www.miljoeogsundhed.dk/default.aspx?node=5320
[27] http://www.dmi.dk/dmi/index/verden/uv_idag.htm
[28] http://www.dmi.dk/dmi/index/verden/uv_idag.htm
[29] http://www.dmi.dk/dmi/index/danmark/klimanormaler.htm
[30] http://www.dmi.dk/dmi/index/danmark/klimanormaler.htm
[31] The total surface area of adult women is 1.69 m2 according to the TGD. We employ a total surface area for children of 0.6 m2. The amount of creams used is calculated as 7.5 g creams for an adult per time/1.69 m2 (adult) * 0.6 m2 (chiild) = 2.7 g.
8 References:
Adibi et al. (2008). Characterization of phthalate exposure among pregnant women assessed by repeat air and urine samples. JJ Adibi, RM Whyatt, PL Williams, AM Calafat, D Camann, R Harrick, H Nelson, HK Bhat, FP Perera, MJ Silva, R Hauser. Environmental Health Perspective, Vol 116, No 4, April, 2008.
Aksglaede, L., K. Sørensen, J.H. Petersen, N.E. Skakkebæk and A. Juul (2009). Recent Decline in Age at Breast Development: The Copenhagen Puberty Study. Pediatrics 2009;123;e932-e939. http://www.pediatrics.org/cgi/content/full/123/5/e932
Arbejdstilsynet (2005). At – vejledning, Stoffer og materialer – C.0.1. Grænseværdier for stoffer og materialer, Oktober 2005.
Astma-Allergi Forbunder (2008): http://allergi.astma-allergi.dk/regado.jsp?type=page&id=205&domain=this. Consulted September 2008.
Becker et al. (2004). DEHP metabolites in urine of children and DEHP in house dust. K Becker, M Seiwert, J Angerer, W Heger, HM Koch, R Nagorka, E Rosskamp, C Schlüter, B Seifert, D Ullrich. Int J Hyg Environ Health 207 (2004), p. 409-417.
BEK 422, 2006. Bekendtgørelse nr. 422 af 4. maj 2006 om kosmetiske produkter with later changes.
BEK 786 (2006). BEK nr. 786 af 11.7.2006. Bekendtgørelse om forbud mod ftalater i legetøj og småbørnsartikler. Miljøministeriet. https://www.retsinformation.dk/Forms/R0710.aspx?id=12943
BEK 1074 (2006). BEK nr. 1074 af 3.11.2006. Bekendtgørelse om ændring af bekendtgørelse om forbud mod ftalater i legetøj og småbørnsartikler. Miljøministeriet. https://www.retsinformation.dk/Forms/R0710.aspx?id=12983
Benson R. (2009). Hazard to the developing male reproductive system from cumulative exposure to phthalate esters—dibutyl phthalate, diisobutyl phthalate, butylbenzyl phthalate, diethylhexyl phthalate, dipentyl phthalate, and diisononyl phthalate. Regulatory Toxicology and Pharmacology 53 (2009) 90–101.
Bergkvist et al. (2008). Exposure to dioxin-like pollutants via different food commodities in Swedish children and young adults. Foo and Chemical Toxicology, 2008, 46, 3360-3367.
Bisphenol-a.org. (2009). Bisphenol A. www bisphenol-a org/human 2009. Available from: URL: www.bisphenol-a.org/human
Björklund, J.A.; K. Thuresson og C.A. De Wit (2009). Perfluoroalkyl Compounds (PFCs) in Indoor Dust: Concentrations, Human Exposure Estimates, and Sources. Environ Sci. Technol. 2009, 43, 2276-2281.
Bornehag et al. (2004). The association between asthma and allergic symptoms in children and phthalates in house dust: a nested case-control study. C-G Bornehag, J Sundell, CJ Weschler, T Sigsgaard, B Lundgren, M Hasselgren, LH-Engmann. Environmental Health Perspectives, July, 2004.
Bornehag et al. (2005). Phthalates in indoor dust and their association with building characteristics. C-G Bornehag, B Lundgren, CJ Weschler, T Sigsgaard, LH-Engmann, J Sundell. Environmental Health Perspectives, Vol 113, No 10, 2005.
Bosgra S, Bos PM, Vermeire TG, et al. (2005). Probabilistic risk characterization: an example with di(2-ethylhexyl) phthalate. Regul Toxicol Pharmacol 2005 Oct;43(1):104-13.
Bremmer, HJ and van Veen, MP (2002): Children’s Toys Fact Sheet: to assess the risk for the consumer. RIVM report 612810012/2002Bilthoven: Rijksinstituut voor Volksgezonheid en Milieu, National Institute of Public Health and the Environment, 2002. (RIVM report 612810012/2002).
Christiansen et al. (2009). Synergistic disruption of external male sex organ development by a mixture of four anti-androgens. Christiansen S, Scholze M, Dalgaard M, Vingaard AM, Axelstad M, Kortenkamp A, Hass U. Submitted to Environmental Health Perspective 2009.
Clausen et al. (2003). Simultaneous extraction of di(2-ethylhexyl phthalate) and nonionic surfactants from house dust. Concentrations in floor dust from 15 Danish schools. PA Clausen, RLL Bille, T Nilsson, V Hansen, B Svensmark, S Bøwadt. Journ Chromatography A, 986 (2003), p. 179-190.
Commission Recommendation (2006). Commission Recommendation of 22 September 2006 on the efficacy of sunscreen products and the claims made relating thereto. 2006/647/EC.
CSTEE, 2003. Scientific Committee on Toxicity, Ecotoxicity and the Environment (CSTEE). Opinion on the Report on “Risks to Health and the Environment Related to the Use of lead in products”. 1st April 2003.
Darbre et al. (2002) Oestrogenic activity of isobutylparaben in vitro and in vivo. J. Appl. Toxicol. 22 (2002): 219-226
Darbre P and Harvey PW (2008). Paraben esters: review of recent studies of endocrine toxicity, absorption, esterase and human exposure, and discussion of potential human health risks. J.Appl.Toxicol. 28 (2008): 561-78.
DG Environment (2007). Study on enhancing the Endocrine Disruptor priority list with a focus on low production volume chemicals. By DHI, May 2007.
Direktiv 93/11, 1993. Kommisionens direktiv nr. 93/11/EØF af 15. marts 1993 om frigivelse af N-nitrosaminer og N-nitroserbare stoffer fra flaskesutter og narresutter af elastomere og gummi.
DS/EN 71-3:1995, 2. udgave. Legetøj - sikkerhedskrav.
DS/EN ISO 105-E04:1997. Tekstilprøvning - prøvning af farveægthed.
DS/EN ISO 14184-1:1999. Textilprøvning. Bestemmelse af formaldehyde.
DTI, 2002: Research into the mouthing behaviour of children up to 5 years old. Consumer and Competition Policy Directorate. Research commissioned by the Consumer and Competition Policy Directorate, DTI, UK. Udført af University of Nottingham. http://www.berr.gov.uk/files/file21800.pdf
ECHA, May 2008. Guidance on information requirements and chemical safety assessment. http://reach.jrc.it/docs/guidance_document/information_requirements_en.htm
ECHA, June 2009. ECHA RECOMMENDS STRICT CONTROL FOR SEVEN SUBSTANCES OF VERY HIGH CONCERN. Press Release 02/06-09. http://echa.europa.eu/doc/press/pr_09_07_annex_xiv_rec_20090602.pdf
EFSA (2004). "Opinion of the Scientific Panel on Food Additives, Flavourings, Processing Aids and Materials in Contact with Food on a Request from the Commission related to para hydroxybenzoates (E 214-219)." The EFSA Journal 83 (2004): 1-26.
EFSA (2005). Opinion of the Scientific Panel on Food Additives, Flavourings, Processing Aids and Material in Contact with Food (AFC) on a request from the Commission related to Di-Butylphthalate (DBP) for use in food contact materials Question N° EFSA-Q-2003-192 Adopted on 23 June 2005 by written procedure. The EFSA Journal, 242, 1-17.
http://www.efsa.europa.eu/cs/BlobServer/Scientific_Opinion/afc_op_ej242_dbp_en2.pdf?ssbinary=true
EFSA (2005a). Opinion of the Scientific Panel on Food Additives, Flavourings, Processing Aids and Materials in Contact with Food (AFC) on a request from the Commission related to Butylbenzylphthalate (BBP) for use in food contact materials Question N° EFSA-Q-2003-190 Adopted on 23 June 2005 by written procedure. The EFSA journal, 241, 1-14.
EFSA (2005b). Opinion of the Scientific Panel on Food Additives, Flavourings, Processing Aids and Materials in Contact with Food (AFC) on a request from the Commission related to Bis(2-ethylhexyl)phthalate (DEHP) for use in food contact materials Question N° EFSA-Q-2003-191 Adopted on 23 June 2005 by written procedure. The EFSA Journal, 243, 1-20.
EFSA (2005c). Opinion of the Scientific Panel on Food Additives, Flavourings, Processing Aids and Materials in Contact with Food (AFC) on a request from the Commission related to Di-isononylphthalate (DINP) for use in food contact materials Question N° EFSA-Q-2003-194 Adopted on 30 July 2005. The EFSA Journal, 244, 1-18.
http://www.efsa.europa.eu/cs/BlobServer/Scientific_Opinion/afc_op_ej244_dinp_en2.pdf?ssbinary=true
EFSA (2008). REASONED OPINION OF EFSA MRLs of concern for the active substance vinclozolin. EFSA Scientific Report 166 (2008): 1-36.
EFSA (2009). Opinion of the Scientific Panel on food additives, flavourings, processing aids and materials in contact with food (AFC) related to 2,2-BIS(4-HYDROXYPHENYL)PROPANE. http://www efsa europa eu 6 A.D. November 29Available from: URL:
http://www.efsa.europa.eu/EFSA/efsa_locale-1178620753812_1178620772817.htm
EFSA (2009b). Reasoned opinion of EFSA. MRLs of concern for the active substance procymidone, taking into account revised toxicological reference values. EFSA Scientific Report 227 (2009): 1-26.
El Hussein S, et al. (2007). Assessment of principal parabens used in cosmetics after their passage through human epidermis-dermis layers (ex vivo study). Exp.Dermatol. 16 (2007): 830-36.
ESIS (2009): European chemical Substances Information System. http://ecb.jrc.ec.europa.eu/esis/
EU-kommissionen (2002). Review report for the active substance linuron. 7595/VI/97-final. 2-12-2002. Ref Type: Report.
European Commission (2003). “Technical Guidance Document on Risk Assessment in support of Commission Directive 93/67/EEC on Risk Assessment for new notified substances. Commission Regulation (EC) No 1488/94 on Risk Assessment for existing substances. Directive 98/8/EC of the European Parliament and of the Council concerning the placing of biocidal products on the market”. Part I. European Commission, Joint Research Centre, Institute for Health and Consumer Protection, European Chemicals Bureau, 2003.
European Chemicals Bureau (2004). European Union
Risk Assessment Report. Dibutyl phthalate.with addendum 2004. Vol. 29 1st. priority list. http://ecb.jrc.ec.europa.eu/DOCUMENTS/Existing-Chemicals/RISK_ASSESSMENT/ADDENDUM/dibutylphthalate_add_003.pdf
European Chemicals Bureau (2007). European Union
Risk Assessment Report. Butyl benzyl phthalate. Vol. 76 3rd. priority list.
http://ecb.jrc.ec.europa.eu/DOCUMENTS/Existing-Chemicals/RISK_ASSESSMENT/REPORT/benzylbutylphthalatereport318.pdf
European Chemicals Bureau (2008). European Union
Risk Assessment Report. bis(2-ethylhexyl)phthalate (DEHP). Vol. 80 2nd. priority list.
http://ecb.jrc.ec.europa.eu/DOCUMENTS/Existing-Chemicals/RISK_ASSESSMENT/REPORT/dehpreport042.pdf
European Chemicals Bureau (2008a). European Union Risk Assessment Report. 4,4’-ISOPROPYLIDENEDIPHENOL (BISPHENOL-A) Updated risk assessment. Final approved version awaiting for publication.
http://ecb.jrc.ec.europa.eu/DOCUMENTS/Existing-Chemicals/RISK_ASSESSMENT/ADDENDUM/bisphenola_add_325.pdf
European Chemicals Bureau (2003). European Union Risk Assessment Report. 1,2-benzenedicarboxylic acid, di-C8-10-branched alkyl esters, C9-rich and di-“isononyl” phthalate (DINP) Vol. 35 2nd. priority list.
http://ecb.jrc.ec.europa.eu/DOCUMENTS/Existing-Chemicals/RISK_ASSESSMENT/REPORT/dinpreport046.pdf
European Chemicals Bureau (2003a). European Union Risk Assessment Report. 4,4'-ISOPROPYLIDENEDIPHENOL (BISPHENOL-A)Vol. 37, 3rd. priority list.
http://ecb.jrc.ec.europa.eu/DOCUMENTS/Existing-Chemicals/RISK_ASSESSMENT/REPORT/bisphenolareport325.pdf
FAO/WHO (2006). Inventory of IPCS and other WHO pesticide evaluations and summary of toxicological evaluations performed by the Joint Meeting on Pesticide Residues (JMPR), 2006.
Faqi et al. (1998). Effects on developmental landmarks and reproductive capability of 3,3',4,4'-tetrachlorobiphenyl and 3,3',4,4',5-pentachlorobiphenyl in offspring of rats exposed during pregnancy. Hum Exp Toxicol 17 (1998): 365-372
Fromberg A and et al (2005). Chemical contaminants Food monitoring, 1998-2003. Part 1. FødevareRapport 2005:01. 2005. Danish Veterinary and Food Administration. Ref Type: Report.
Fødevarestyrelsen (2008). Pesticidrester i fødevarer 2007. Resultater fra den danske pesticidkontrol, 2008.
Gunnarsen et al, 2009. Sundhedsmæssig vurdering af PCB-holdige bygningsfuger. L Gunnarsen, SBi; JC Larsen, Danmarks Fødevareforskning; P Mayer, DMU; W Sebastian, Bygge- og Miljøteknik A/S. Orientering fra Miljøstyrelsen nr. 1, 2009.
Hagendorn-Rasmussen, 2008. “Arbejdspapir til Miljøstyrelsen om 2-åriges kontakt med produkter”. Pernille Hagendorn-Rasmussen, Inge Larsen, Karl Vogt-Nielsen og Flemming Jakobsen, CASA.
Hass et al. 2007. Combined exposure to anti-androgens exacerbates disruption of sexual differentiation in the rat. Environ Health Perspect 115 2007. Suppl 1:122-128
Hawley J K, 1985. Assessment of health risk form exposure to contaminated soil. Risk Analysis, 5(4), 289-302.
Huwe et al, 2008. Comparative absorption and bioaccumulation of polybrominated diphenyl ethers following ingestion via dust and oil in male rats. J Huwe, H Hakk, D Smith, J Diliberto, V Richardson, L Birnbaum, H Stapleton, Env. Sci Tech 42: 2694-2700, 2008. http://www.ars.usda.gov/research/publications/publications.htm?SEQ_NO_115=216852
Hwang et al. (2008). Occurence of endocrine disrupting chemicals in indoor dust. H-M Hwang, E-K Park, TM Young, BD Hammock, Department of Civial and Environmental Engineering and Department of Entmology and Cancer Research Center, University of California, One Shields Avenue, Davis California, USA. Sci Total Env 404 (2008) p. 26-35.
Japanese law no. 112 (1973)
JECFA 2002, Safety evaluation of certain food additives and contaminants, Polychlorinated dibenzodioxins, Polychlorinated dibenzofurans, and coplanar polychlorinated biphenyls; WHO Food Additives Series, vol. 48; pp. 451-664.
Jensen et al, 2008. QSAR models for reproductive toxicity and endocrine disruption in regulatory use – a preliminary investigation. G.E. Jensen, J.R. Niemela, E.B. Wedebye, N.G. Nikolov, SAR and QSAR in Environmental Research, vol. 19, Nos. 7-8. October-December 2008, 631-641.
http://www.pubmedcentral.nih.gov/picrender.fcgi?artid=2607135&blobtype=pdf
Jensen og Knudsen (2006). Samlet sundhedsmæssig vurdering af kemiske stoffer i indeklimaet fra udvalgte forbrugerprodukter. AA Jensen, FORCE Technology, HN Knudsen, SBi Statens Byggeforskningsinstitut. Kortlægning af kemiske stoffer i forbrugerprodukter nr. 75, 2006.
JMPR (2001). Pesticide residues 2001. Toxicological evaluations. Prochloraz. http://www inchem org/documents/jmpr/jmpmono/2001pr11 htm 2001.
Kolarik et al. (2008). The association between phthalates in dust and allergic diseases among Bulgarian children. B Kolarik, K Naydenov, M Larsson, C-G Bornehag, J Sundell. Environmental Health Perspectives Vol 116, No 1, p. 98-103, 2008.
Kræftens Bekæmpelsen, 2008. Solråd på deres hjemmeside. Found at http://www.cancer.dk/NR/exeres/D0286441-7FA1-4E24-8130-A977C745CD5C.htm in December, 2008.
Lee et al. 2004. Diverse developmental toxicity of di-n-butyl phthalate in both sexes of rat offspring after maternal exposure during the period from late gestation through lactation. Toxicology 203, 2004: 221-238
Luk luften ind (2007). Miljøstyrelsens indeklimakampagne, 2007. http://www.mst.dk/kemikalier/forbrugerguide/indeklima/lukluftenind/
McIntyre et al 2000. Effects of in utero exposure to linuron on androgen-dependent reproductive development in the male Crl:CD(SD)BR rat. Toxicol Appl Pharmacol 167, 2000: 87-99
Miljøstyrelsen (2001). Rapport om vejledende liste til selvklassificering af farlige stoffer. Miljøprojekt nr. 635, 2001. Søgning i Miljøstyrelsens Vejledende liste til selvklassificering af farlige stoffer. http://www.mst.dk/Kemikalier/Stoflister+og+databaser/Vejledende+liste+til+selvklassificering+af+farlige+stoffer/
Miljøstyrelsen, 2006. Metoder til fastsættelse af kvalitetskriterier for kemiske stoffer i jord, luft og drikkevand med henblik på at beskytte sundheden. Vejledning fra Miljøstyrelsen nr. 5, 2006.
Miljøstyrelsens Kosmetikguide(2008). Fundet på http://www.mst.dk/Kemikalier/Forbrugerguide/Kosmetikguiden/V%C3%A6lg+et+produkt/Solcreme.htm. Last updated 16. October 2008.
Miljøstyrelsen (2008). Listen over farlige stoffer. Opslag via Miljøstyrelsens hjemmeside, november 2008. http://www.mst.dk/Kemikalier/Stoflister+og+databaser/Listen+over+farlige+stoffer/Søgning+i+farlige+stoffer.htm
Mors Verden (2008): http://morsverden.dk/statistik/ (October, 2008).
Müller AK, Nielsen E, Ladefoged O. (2003). Human exposure to selected phthalates in Denmark. 1st ed. 2003.
NAP (2008). Phthalates and Cumulative Risk Assessment The Task Ahead. Committee on the Health Risks of Phthalates, National Research Council. ISBN: 0-309-12842-0, 208 pages, 6 x 9, (2008).
http://www.nap.edu/catalog/12528.html
Netdoktor (2008a): http://www.netdoktor.dk/boern/fakta/boernsoevn.htm (October, 2008)
Netdoktor (2008b):
http://www.netdoktor.dk/boern/fakta/drengevaeksttabel.htm og
http://www.netdoktor.dk/sunderaad/fakta/pigevaeksttabel.htm (Oktober, 2008)
Nielsen et al, 2008. Toxicological Risk Assessment of Chemicals: A Practical Guide. E Nielsen, G Oestergaard, JC Larsen, CRC Press, 2008.
NNA (2004). Nordic Nutrition Recommendations 2004, 4th ed. Nord 2004:13. Nordic Council of Ministers, Copenhagen.
NNT (2002). Food additives in Europe 2000 - Status of safety assessments of food additives presently permitted in the EU. 2002. TemaNord.
Ref Type: Serial (Book,Monograph).
Nordström Joensen et al, 2009. Do Perfluoroalkyl Compounds Impair Human Seman Quality? U Nordström Joensen, R Bossi, H Leffers, AA Jensen, NE Skakkebæk, N Jørgensen. EHP. Online 2 March 2009. doi: 10.1289/ehp.0800517, http://dx.doi.org.
Notat Kriteriegruppen, 2004. Vurdering af sundhedsbaserede kvalitetskriterier og beskyttelsesniveauet. 6. december 2004.
NTP (2008). National Toxicology Program USDoHaHS. NTP-CERHR Monograph on the Potential Human Reproductive and Developmental Effects of Bisphenol A. 2008.
Oishi S 2001. Effects of butylparaben on the male reproductive system in rats. Toxicol Ind Health 17, 2001: 31-39
Oishi S 2002. Effects of propyl paraben on the male reproductive system. Food Chem Toxicol 40, 2002: 1807-1813
Pharma, 2008. Viden om hormonforstyrrende stoffer ønskes, p. 20-23, juli 2008.
Poulsen & Schmidt (2007). Kortlægning og sundhedsmæssig vurdering af kosmetiske produkter til børn. Pia Brunn Poulsen og Anders Schmidt, FORCE Technology, 2007. Kortlægning af kemiske stoffer i forbrugerprodukter nr. 88, 2007. Miljøstyrelsen.
Rakkestad KE, Dye CJ, Yttri KE, et al. (2007). Phthalate levels in Norwegian indoor air related to particle size fraction. J Environ Monit 2007 Dec;9(12):1419-25.
Rastogi, S.C., Schouten, A., de Kruijf, N., and Weijland, J.W. 1995. Contents of methyl-, ethyl-, propyl-, butyl- and benzylparaben in cosmetic products. Contact Dermatitis, 32:28-30. Abstract fra Interscience. http://www3.interscience.wiley.com/journal/119242643/abstract
Rudel et al. (2003). Phthalates, alkylphenols, pesticides, polybrominated diphenyl ethers, and other endocrine disrupting compounds in indoor air and dust. RA Rudel, DE Camann, JD Spengler, LR Korn, JG Brody. Env. Sci Tech Vol. 37, No. 20, p. 4543-4553, 2003.
Rudel et al. (2008). PCB-containing wood floor finish is a likely source of elevated PCBs in residents’ blood, household air and dust: a case study of exposure. RA Rudel, LM Seyak JG Brody. Env. Health Vol. 7, No. 2, 2008.
Saillenfait et al. (2008). Diisobutyl phthalate impairs the androgen-dependent reproductive development of the male rat. Reprod Toxicol 26, 2008: 107-115
SCCNFP 0690 (2003). The Scientific Committee on Cosmetic Products and Non-Food Products intended for Consumers. “The SCCNFP’s Notes of Guidance for the Testing of Cosmetic Ingredients and Their Saftey Evaluation, 5th Revision”. Adopted by the SCCNFP during the 25th plenary meeting of 20 October 2003. SCCNFP/0690/03 Final.
SCCP (2005). Scientific Committee on consumer products. SCCP. Extended opinion on the safety evaluation of parabens. 28 January 2005.
http://ec.europa.eu/health/ph_risk/committees/04_sccp/docs/sccp_o_019.pdf
SCCP (2006). THE SCCP'S NOTES OF GUIDANCE FOR THE TESTING OF COSMETIC INGREDIENTS AND THEIR SAFETY EVALUATION 6TH REVISION. 2006. Ref Type: Report.
SCCP (2006a). Scientific Committee on consumer products. SCCP. Opinion parabens. Colipa No P82. 10 October 2006.
http://ec.europa.eu/health/ph_risk/committees/04_sccp/docs/sccp_o_074.pdf
SCCP (2008). OPINION ON Parabens COLIPA n° P82. 2008.
Ref Type: Report.
http://ec.europa.eu/health/ph_risk/committees/04_sccp/docs/sccp_o_074.pdf
Schettler T. (2006). Human exposure to phthalates via consumer products. Int J Androl 2006 Feb;29(1):134-9.
Seifert et al. (1989). Seasonal variation of concentrations of volatile organic compounds in selected German homes. B Seifert, W Mailahn, C Schulz, D Ullrich. Environ Int 1989;15:397-408.
SCF 2001, European Commission, Scientific Committee on Food. Opinion on the Risk Assessment of Dioxins and Dioxin-like PCBs in Food, Adopted on 30 May 2001.
Sharpe, R. (2009). Male Reproductive Health Disorders and the Potential Role of Exposure to Environmental Chemicals. http://www.chemtrust.org.uk/documents/ProfRSHARPE-MaleReproductiveHealth-CHEMTrust09.pdf
Simenoeau, C; Geiss, A; Roncari, P; Zocchi P; Hannaert, P. 20001 EUR 19826 EN
Validation of methodologies for the release of diisononylphthalate (DINP) in saliva stimulant from toys.
Soni MG, Carabin IG, and Burdock GA (2005). Safety assessment of esters of p-hydroxybenzoic acid (parabens). Food and Chemical Toxicology 43 (2005): 985-1015.
Stuer-Lauridsen et al. (2007). Kortlægning af produkter der indeholder nanopartikler eller er baseret på nanoteknologi. F Stuer-Lauridsen, A Kamper, P Borling, GI Petersen, DHI. SF Hansen, A Baun, Institut for Miljø og Ressourcer, DTU. Kortlægning af kemiske stoffer i forbrugerprodukter nr. 81, 2007. Miljøstyrelsen.
Sullivan (2008). Polychlorinated biphenyls (PCBs) and indoor air: source investigation and remedial approach for a public school building in New Bedford, Massachusetts, USA. DM Sullivan, TRC Environmental Corporation. 28th Internation Symposium on Halogenated Persistant Organic Pollutants (POPs), Dioxin 2008.
Svendsen et al. (2007). Kortlægning samt sundhedsmæssig vurdering af kemiske stoffer i skoletasker, legetasker, penalhuse og viskelædere. N Svendsen, E Bjarnov, PB Poulsen, FORCE Technology, Miljøstyrelsen, Kortlægning af kemiske stoffer i forbrugerprodukter nr. 84, 2007.
Taxvig et al. 2007. Endocrine-disrupting activities in vivo of the fungicides tebuconazole and epoxiconazole. Toxicol Sci 100, 2007: 464-473
Tyl et al. 2002. Three-generation reproductive toxicity study of dietary bisphenol A in CD Sprague-Dawley rats. Toxicol Sci 68, 2002: 121-146
Tyl et al. 2004. Reproductive toxicity evaluation of dietary butyl benzyl phthalate (BBP) in rats. Reprod Toxicol 18, 2004: 241-264
US EPA (2002): Child-Specific Exposure Factors Handbook.
US EPA, 1997. US EPA, National Center for Environmental Assessment, Office of Research and Development. Exposure Factor Handbook. August 1997. http://www.epa.gov/NCEA/pdfs/efh/front.pdf.
Van Engelen J.G.M., M.V.D.Z. Park, P.J.C.M. Janssen, A.G. Oomen, E.F.A. Brandon, K. Bouma, A.J.A.M. Sips and M.T.M. Van Raaij (2006). Chemicals in Toys. A general methodology for assessment of chemical safety toys with a focus on elements. RIVM/SIR.
Weis et al. (2003). Highly PCB-contaminated schools due to PCB-containing roughcast. N Weis, M Köhler, C Zorn, Bremer Umweltsinstitut, Germany. Proceedings: Healthy buildings 2003.
Wolfe and Leyton, 2003. Upubliceret materiale fra producent.
Wittassek M, Heger W, Koch HM, et al. (2007). Daily ingestion of di(2-ethylhexyl)phthalate (DEHP) by German children -- A comparison of two estimation models based on urinary DEHP metabolite levels. Int J Hyg Environ Health 2007 Jan;210(1):35-42.
Wormuth M, Scheringer M, Vollenweider M, et al. (2006). What are the sources of exposure to eight frequently used phthalic acid esters in Europeans? Risk Anal 2006 Jun;26(3):803-24.
Ye X, et al. (2006). Parabens as Urinary Biomarkers of Exposure in Humans. Environmental Health Perspectives 114.12 (2006): 1843-46.
You et al. 1998. Impaired male sexual development in perinatal Sprague-Dawley and Long- Evans hooded rats exposed in utero and lactationally to p,p'-DDE. Toxicol Sci 45, 1998:162-173
Öko-Tex Standard 100, udgave 02/2009 OEKO-TEX, Zürich
Survey of chemical substances in consumer products
100: Kortlægning, emissioner samt miljø- og sundhedsmæssig vurdering af kemiske stoffer i kunstgræs
96: Metoder og procedurer til reduktion af uønskede stoffer
95: Kortlægning og sundhedsmæssig vurdering af kemiske stoffer i kunstige negle og neglehærdere
94: Kortlægning og sundhedsmæssig vurdering af kemiske stoffer i smykker
93: Kortlægning og sundhedsvurdering af kemiske stoffer i hobbyprodukter til børn
92: Kortlægning og sundhedsmæssig vurdering af kemiske stoffer i æteriske olier og duftolier
91: Kortlægning af kemiske stoffer i hovedtelefoner og høreværn
90: Kortlægning og afgivelse samt sundhedsmæssig vurdering af kemiske stoffer i babyprodukter
89: Kortlægning af kemiske stoffer i balloner
88: Kortlægning og sundhedsmæssig vurdering af kosmetiske produkter til børn (se billeder af emballager med ftalater)
86: Kortlægning og sundhedsmæssig vurdering af kemiske stoffer i deodoranter
85: Kortlægning af produkter og materialer til live rollespil
81: Kortlægning af produkter der indeholder nanopartikler eller er baseret på nanoteknologi
79: Kortlægning og sundhedsmæssig vurdering af produkter til brug ved ømhed og skader efter sport m.m
78: Kortlægning og sundhedsmæssig vurdering af kemiske stoffer i massageolier
77: Kortlægning og sundhedsmæssig vurdering af kemiske stoffer i sexlegetøj
76: Kortlægning og sundhedsmæssig vurdering af kemiske stoffer i sexcreme
75: Samlet sundhedsmæssig vurdering af kemiske stoffer i indeklimaet fra udvalgte forbrugerprodukter
74: Evaluation of the health risk to animals playing with phthalate containing toys (kun på engelsk)
72: Vurdering af DHA i selvbrunende produkter der sprayes på i kabiner
71: nummer udgået
69: Kortlægning og sundheds- og miljømæssig vurdering af håndsæbe
68: Kortlægning af parfumestoffer i legetøj og småbørnsartikler
67: Kortlægning og afgivelse af kemiske stoffer i "slimet" legetøj
66: Afgivelse og vurdering af kemiske stoffer fra udvalgte elektriske og elektroniske produkter - del 2
65: Kortlægning af kemiske stoffer i kohl- og hennaprodukter
64: nummer udgået
63: nummer udgået
62: nummer udgået
61: Farvestoffer i tatoveringsmærker
60: Kemiske stoffer i overfladebehandlet trælegetøj
59: Kortlægning og vurdering af kemiske stoffer i glas- og porcelænsfarver
58: Kortlægning af kemiske stoffer i tekstilfarver
57: Screening af sundhedseffekter fra kemiske stoffer i tekstilfarver
56: Kemiske stoffer i legetøj til dyr
55: Læbeplejeprodukter med duft, smag m.v.
54: PAH'er og aromatiske aminer i bildæk
53: Kemiske stoffer i skælshampoo
52: Kemiske stoffer i skoplejemidler
51: Afgivelse af stoffer fra produkter af chloropren
50: Eksponering af kemiske stoffer i imprægneringsmidler
49: Afgivelse af kemiske stoffer fra produkter af eksotisk træ
48: Vinduesfarver
47: PBT/vPvB-stoffer i forbrugerprodukter
46: Telte og tunneler til børn
45: Spraymaling
43: Pletfjernere
42: Tandbørster
41: Kemiske stoffer i autopolish og -voks
40: Fluorescerende stoffer i forbrugerprodukter
39: Afgivelse af kemiske stoffer i røgelse
38: Kortlægning og afgivelse af kemiske stoffer i fugemasser
37: Kortlægning og eksponering af kemiske stoffer i julepynt
36: Kortlægning, afgivelse og vurdering af flygtige kemiske stoffer i tryksager
35: Forbruget af PVC og phthalater i Danmark år 2000 og 2001
34: Papirlommetørklæder og toiletpapir
33: Naturlegetøj
32: Elektriske og elektroniske produkter
31: Kemiske hårfjerningsmidler
30: Duftkugler/ airfreshener og andre produkter der afgiver duft
29: Kemiske stoffer i hobbylime
27: Ørepropper. Indsamling af data
26: Organiske tinforbindelser i rullemadrasser, topmadrasser og baby/børnedyner
25: Rullemadrasser
24: Antibakterielle midler i beklædningsgenstande
22: Afgivelse af MBT fra naturgummi
21: Renserier
19: Julespray
17: Imprægneringsmidler, voks og anden polish til gulve
16: Rense- og pudsemidler til metal
15: Gulvtæpper
14: Modellervoks
13: Hygiejnebind
12: Tamponer
11: Naturlige kosmetiske produkter
9: Analysemetoder af planteekstarakter i naturkosmetikprodukter
8: Duftstoffer i rengøringsprodukter og andre forbrugerprodukter
7: Rørperler
5: Teater- og fastelavnssminke
4: Triclosan i forbrugerprodukter
3: Lædervarer
1: Phthalater i produkter med PVC
Earlier projects 2001
Analyse af forbrugerprodukter, juni, 2001
Appendix A: Chemical substances in sunscreens
This appendix is a summary of all the chemical substances in the selected sunscreens for children. A total of 233 different substances were found in the surveyed sunscreens.
The summary shows the frequency of different substances occurring in the sunscreens, and the rank order they occur in descending order of weigth, as indicated on the list of ingredients on the products. The rank order is thus an indication of the relative concentration of the ingredients in the products. A low figure (high ranking) means that the substance is the main ingredient in the product, wheras a high figure (low ranking) means that the substance is an additive (e.g., a preservative) in the product.
The table below shows how many of the 28 sunscreens that contain the listed substances as well as their rank order.
Ingredients listed in descending order of frequency
The chemical substances are indicated in descending order of frequency. For instance when the first substance is aqua (= water), it occurs in most of the products.
List of all the ingredients in the 28 surveyed sunscreens for children, marketed in October 2008. The ingredients are listed in descending order of frequency.
Appendix B: Chemical substances in moisturising creams, oil-based creams and lotions
This appendix is a summary of all the chemical substances found in the surveyed moisturising creams, oil-based creams and lotions for children. A total of 174 different substances were found in the 32 surveyed creams and lotions.
The summary shows the frequency of different substances occurring in the the creams and lotions, and the rank order they occur in descending order of weigth, as indicated on the list of ingredients on the products. The rank order is thus an indication of the relative concentration of the ingredients in the products. A low figure (high ranking) means that the substance is the main ingredient in the product, wheras a high figure (low ranking) means that the substance is an additive (e.g., a preservative) in the product.
The table below shows how many of the 32 moisturising creams, oil-based creams and lotions contain the different listed substances and the rank order of the substances.
Ingredients listed in descending order of frequency
The chemical substances are indicated in descending order of frequency. For instance when the first substance is aqua (= water), it occurs in most of the products.
List of all the ingredients in the 32 surveyed moisturising creams, oil-based creams and lotions for children, marketed in October 2008. The ingredients are listed in descending order of frequency.
Version 1.0 November 2009, © Danish Environmental Protection Agency