Establishment of a basis for administrative use of PestSurf
Annex 7
7 Comparison of risk assessment data produced by spray drift assessments, FOCUS SW and PestSurf
7.1 Chemical characteristics of the compound
| Compound: | Pendimethalin |
| Dose: | 400 g ai./ha |
| Spraying time: | 1st May |
| Crop: | Spring barley |
| Dose: | 1600 g ai./ha |
| Spraying time: | 20th September |
| Crop: | Winter wheat |
Table 7.1. Overview of chemical properties of pendimethalin and the parameters used in the simulations.
Tabel 7.1. Oversigt over pendimethalin kemiske egenskaber og parametrene brugt i simuleringerne.
| Chemical property | Condition | Recalculated values | |||
| Cas-no. | 40487-42-1 | ||||
| Molecular weight | 281.3 | ||||
| Form (acid, basic, neutral) | neutral | ||||
| pKa | |||||
| Water solubility | 0.33 µg/l l | pH 7 | 20°C | ||
| log Kow | at pH | KowA- | |||
| log Kow | 5.2 | at pH | 7 | KowAH | 5.2 |
| log Kow | at pH | KowAH+ | |||
| Vapor pressure, Pa | 1.94 x 10⁻³ | 25°C | 330 (Boiling point) | vapor pressure, Pa, 20°C | 1.07 × 10⁻³ |
| Henry’s law constant | 2.728 × 10⁻³ (Kpa x m³ / mol) | 25°C | Recalculated value, dimensionless | 1.10 × 10⁻³ | |
| Sorption properties in soil | |||||
| Freundlich exp | 0.96 | ||||
| Koc, l/kg | 14471 | ||||
| DT50 in soil, days | 148 | ||||
| DT50water | Fast sorption | PestSurf input | |||
| DT50sedment | None mentioned | ||||
| DT50water/sediment | range: 4-28 days: 16 days | DT50, days | 16 | ||
| Sediment konc., µg/l | 80 (default in PestSurf) | ||||
| Hydrolysis | no hydrolysis | at pH 5 | (acid) | ||
| at pH 7 | (neutral) | ||||
| at pH 9 | (basic) | ||||
| Photolysis | |||||
| quantum yield | No relevant direct phototransformation observed, set to 0 | ? | |||
| Spectrum | 238 nm ε = 28775 l.mol-1.cm-1 | ||||
| 425 nm, ε = 5490 l.mol-1.cm-1 | |||||
| Other | DT50 = 21 days (under 24 h daily exposure) pH not stated | ||||
7.2 Concentration generated by spray
| Direct spray | FOCUS buffer zones | |||
| Ditch | Stream | Pond | ||
| mg l-1 | mg l-1 | mg l-1 | mg l-1 | |
| Pendimethalin | ||||
| -spring appl. | 133.3 | 3.679 | 2.475 | 1.081 |
| - autumn appl. | 533.3 | 14.716 | 9.900 | 4.323 |
7.3 Concentrations generated by FOCUS SW
7.3.1 D3 - Ditch
| Pendimethalin, spring appl. | Ditch, D3 | |||||||
| Water | Sediment | |||||||
| Date | PEC | Date | TWAEC | Date | PEC | Date | TWAEC | |
| mg l-1 | mg l-1 | mg l-1 | mg l-1 | |||||
| Global max | 04-May-92 | 2.511 | 06-May-92 | 1.514 | ||||
| 1 d | 05-May-92 | 0.938 | 05-May-92 | 1.779 | 07-May-92 | 1.437 | 06-May-92 | 1.501 |
| 2 d | 06-May-92 | 0.086 | 06-May-92 | 1.092 | 08-May-92 | 1.334 | 07-May-92 | 1.472 |
| 4 d | 08-May-92 | 0.005 | 08-May-92 | 0.556 | 10-May-92 | 1.151 | 09-May-92 | 1.394 |
| 7 d | 11-May-92 | 0.004 | 11-May-92 | 0.320 | 13-May-92 | 0.932 | 12-May-92 | 1.275 |
| Pendimethalin, autumn appl. | Ditch, D3 | |||||||
| Water | Sediment | |||||||
| Date | PEC | Date | TWAEC | Date | PEC | Date | TWAEC | |
| mg l-1 | mg l-1 | mg l-1 | mg l-1 | |||||
| Global max | 26-Sep-92 | 10.075 | 28-Sep-92 | 7.883 | ||||
| 1 d | 27-Sep-92 | 5.635 | 27-Sep-92 | 7.818 | 29-Sep-92 | 7.548 | 29-Sep-92 | 7.838 |
| 2 d | 28-Sep-92 | 1.441 | 28-Sep-92 | 5.598 | 30-Sep-92 | 7.029 | 29-Sep-92 | 7.716 |
| 4 d | 30-Sep-92 | 0.070 | 30-Sep-92 | 3.015 | 02-Okt-92 | 6.208 | 01-Okt-92 | 7.365 |
| 7 d | 03-Oct-92 | 0.034 | 03-Oct-92 | 1.741 | 05-Oct-92 | 5.233 | 04-Oct-92 | 6.835 |
7.3.2 D4 – Pond
| Pendimethalin, spring appl. | Pond, D4 | |||||||
| Water | Sediment | |||||||
| Date | PEC | Date | TWAEC | Date | PEC | Date | TWAEC | |
| mg l-1 | mg l-1 | mg l-1 | mg l-1 | |||||
| Global max | 30-May-85 | 0.087 | 12-Jun-85 | 0.308 | ||||
| 1 d | 31-May-85 | 0.080 | 31-May-85 | 0.083 | 13-Jun-85 | 0.307 | 12-Jun-85 | 0.308 |
| 2 d | 01-jun-85 | 0.073 | 01-jun-85 | 0.080 | 14-Jun-85 | 0.305 | 13-Jun-85 | 0.308 |
| 4 d | 03-jun-85 | 0.060 | 03-jun-85 | 0.073 | 16-Jun-85 | 0.298 | 14-Jun-85 | 0.307 |
| 7 d | 06-jun-85 | 0.046 | 06-jun-85 | 0.064 | 19-Jun-85 | 0.282 | 16-Jun-85 | 0.305 |
| Pendimethalin, autumn appl. | Pond, D4 | |||||||
| Water | Sediment | |||||||
| Date | PEC | Date | TWAEC | Date | PEC | Date | TWAEC | |
| mg l-1 | mg l-1 | mg l-1 | mg l-1 | |||||
| Global max | 28-Sep-85 | 0.216 | 14-Oct-85 | 0.882 | ||||
| 1 d | 29-Sep-85 | 0.198 | 29-Sep-85 | 0.207 | 15-Oct-85 | 0.881 | 15-Oct-85 | 0.882 |
| 2 d | 30-Sep-85 | 0.181 | 30-Sep-85 | 0.198 | 16-Oct-85 | 0.877 | 15-Oct-85 | 0.881 |
| 4 d | 02-okt-85 | 0.154 | 02-okt-85 | 0.182 | 18-Oct-85 | 0.865 | 16-Oct-85 | 0.880 |
| 7 d | 05-okt-85 | 0.124 | 05-okt-85 | 0.163 | 21-Oct-85 | 0.836 | 18-Oct-85 | 0.887 |
7.3.3 D4 – Stream
| Pendimethalin, spring appl | Stream, D4 | |||||||
| Water | Sediment | |||||||
| Date | PEC | Date | TWAEC | Date | PEC | Date | TWAEC | |
| mg l-1 | mg l-1 | mg l-1 | mg l-1 | |||||
| Global max | 30-May-85 | 2.072 | 30-May-85 | 1.516 | ||||
| 1 d | 31-May-85 | 0.002 | 31-May-85 | 0.23 | 31-May-85 | 0.362 | 31-May-85 | 0.684 |
| 2 d | 01-jun-85 | 0.001 | 01-jun-85 | 0.115 | 01-jun-85 | 0.253 | 01-jun-85 | 0.496 |
| 4 d | 03-jun-85 | 0 | 03-jun-85 | 0.058 | 03-jun-85 | 0.172 | 03-jun-85 | 0.352 |
| 7 d | 06-jun-85 | 0 | 06-jun-85 | 0.033 | 06-jun-85 | 0.12 | 06-jun-85 | 0.263 |
| Pendimethalin, autumn appl. | Stream, D4 | |||||||
| Water | Sediment | |||||||
| Date | PEC | Date | TWAEC | Date | PEC | Date | TWAEC | |
| mg l-1 | mg l-1 | mg l-1 | mg l-1 | |||||
| Global max | 28-sep-85 | 8.654 | 28-sep-85 | 9.492 | ||||
| 1 d | 29-sep-85 | 0.073 | 29-sep-85 | 2.4 | 29-sep-85 | 3.755 | 29-sep-85 | 6.554 |
| 2 d | 30-sep-85 | 0.018 | 30-sep-85 | 1.219 | 30-sep-85 | 2.628 | 30-sep-85 | 4.941 |
| 4 d | 02-okt-85 | 0.005 | 02-okt-85 | 0.614 | 02-okt-85 | 1.808 | 02-okt-85 | 3.59 |
| 7 d | 05-okt-85 | 0.002 | 05-okt-85 | 0.352 | 05-okt-85 | 1.299 | 05-okt-85 | 2.718 |
7.3.4 Conclusion – FOCUS SW
The highest concentration is generated in the ditch (D3), 2.51 µg/l for the spring application and 10.1 µg/l for the autumn-application. The D4-stream scenario and D3-ditch shows almost identical maximum sediment concentrations (1.51 µg/kg) for the spring application, while the D4-stream scenario has the highest sediment concentration 9.49 µg/kg for the autumn application. All maximum concentrations are drift-generated. For all scenarios, the concentrations are lower than what is generated by the simpler assessments.
7.4 PestSurf
7.4.1 Sandy Catchment, Stream
The distribution of concentrations was assessed in several steps. First, the maximum concentrations at each calculation point were listed, and the dates for the occurrence of the maximum were assessed. The points, for which the maximum value also represents a local maximum were selected for further analysis. The relevant values are listed in Table 7.2.
The pattern over time was dominated by drift for all calculation points and both application times, see Figure 7.1 and Figure 7.2.
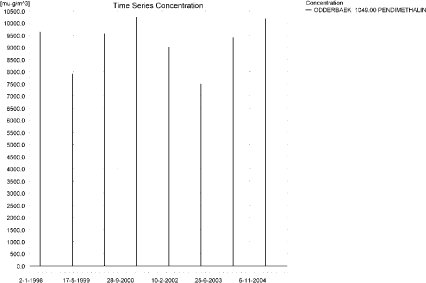
Figure 7.1. Concentration pattern over time for spring application of pendimethalin in the sandy catchment.
Figur 7.1. Koncentrationsmønster som funktion af tid for forårsudbragt pendimethalin i det sandede opland.
Table 7.2. Maximum concentrations (ng/l) of pendimethalin simulated for each calculation point in the sandy catchment.
Tabel 7.2. Maximumkoncentrationer (ng/l) af pendimethalin simuleret for hvert beregningspunkt i det sandede opland.
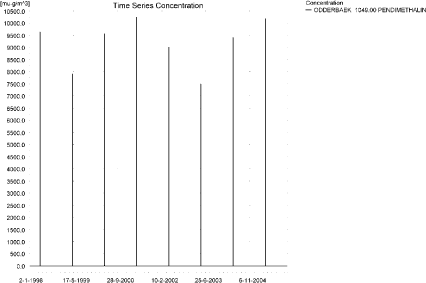
Figure 7.2. Concentration pattern over time for autumn application of pendimethalin in the sandy catchment.
Figur 7.2. Koncentrationsmønster som funktion af tid for efterårsudbragt pendimenthalin i det sandede opland.
Each of the drift-events generated an almost identical pattern along the stream. Figure 7.3, Figure 7.4, Figure 7.5 and Figure 7.6 show two cases of high concentrations for the spring and autumn application, respectively, just at the end of a spraying event and some time later, where the compound starts moving downstream. The flow downstream is slower in the autumn case than in the spring case shown. The thin black line represents the concentration, while the thick black line shows the maximum concentrations obtained during the simulations. In addition, the outline of the stream is shown. In the middle of the catchment, the stream is protected by unsprayed areas.
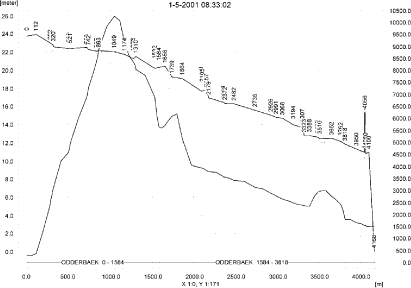
Figure 7.3. Concentrations of pendimethalin in the sandy catchment on the day of spraying (1. May, 2001, spring application).
Figur 7.3. Koncentrationer pendimethalin i det sandede opland på udbringningsdagen (1. maj 2001, forårsudbringning).
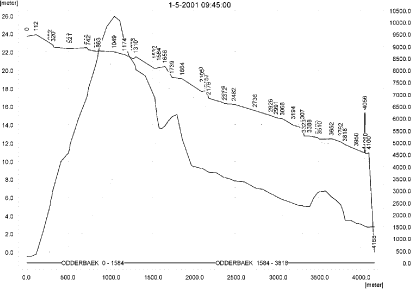
Figure 7.4. Concentrations of pendimethalin in the sandy catchment on the day of spraying (1. May, 2001, spring application); 75 minutes after the end of application.
Figur 7.4. Koncentrationer pendimethalin i det sandede opland på udbringningsdagen (1. maj 2001, forårsudbringning), 75 minutter efter endt udbringning.
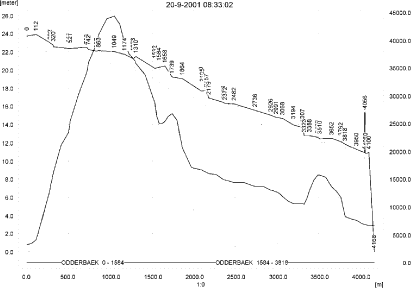
Figure 7.5. Concentrations of pendimethalin in the sandy catchment on the day of spraying (20. September, 2001, autumn application).
Figur 7.5. Koncentrationer pendimethalin i det sandede opland på udbringningsdagen (20. september 2001, efterårsudbringning).
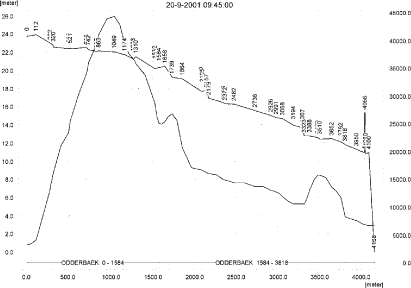
Figure 7.6. Concentrations of pendimethalin in the sandy catchment on the day of spraying (20. Sept, 2001, autumn application); 75 minutes after the end of application.
Figur 7.6. Koncentrationer pendimethalin i det sandede opland på udbringningsdagen (20. september 2001, efterårsudbringning), 75 minutter efter endt udbringning.
In order to present the data in a similar fashion to the FOCUS SW-results, data were extracted and recalculated for the time series marked in Table 7.2. The global maxima and time weighted concentrations (up to 7 days) were extracted and are reported in Table 7.3 and Table 7.4 for the spring and autumn-concentrations, respectively. Note that the unit is ng/l.
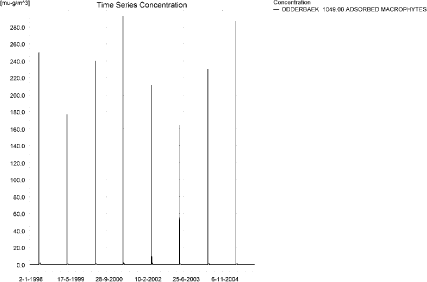
Figure 7.7. Sorption to macrophytes after spring application of pendimethalin in the sandy catchment.
Figur 7.7. Koncentration af forårsudbragt pendimethalin sorberet på makrofytter i det sandede opland.
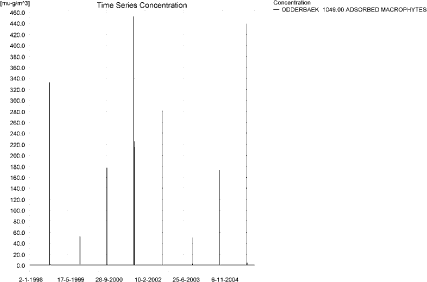
Figure 7.8. Sorption to macrophytes after autumn application of pendimethalin in the sandy catchment.
Figur 7.8. Koncentration af efterårsudbragt pendimethalin sorberet på makrofytter i det sandede opland.
Examples of sorption of pendimethalin to macrophytes is shown in Figure 7.7 and Figure 7.8 for the spring and the autumn application, respectively. The maximum values reached are 331 ng/l for the spring application and 511 ng/l for the autumn application, both values found 1421 m from the upstream end. The concentrations have limited influence on the concentrations in the water phase. The relative effect is slightly higher for the spring application than for the autumn application. The concentrations in porewater are shown in Figure 7.9 and Figure 7.10 for the spring and autumn application, respectively. The concentrations are quite small, and the concentrations of pendimethalin sorbed to sediment are about 3 and 21 ng/kg for the spring and autumn applications. Examples of sediment concentrations are shown in Figure 7.11 and Figure 7.12.
The global maximum value calculated by PestSurf for the sandy catchment in the water phase is 10.2 µg/l for the spring application and 44.3 µg/l for the autumn application. This is considerably more than what is found in the D3-ditch scenario (2.51 µg/l for the spring application and 10.1 µg/l for the autumn application). The major difference is the spraying along a long stretch of stream and a water depth that generally is lower than the 30 cm used in FOCUS SW (about 8 cm water depth at the point and time of maximum concentration). The sediment concentrations are considerably smaller (3 and 21 ng/kg) compared to 1.5 and 7.9 µg/kg calculated by FOCUS SW-D3 ditch.
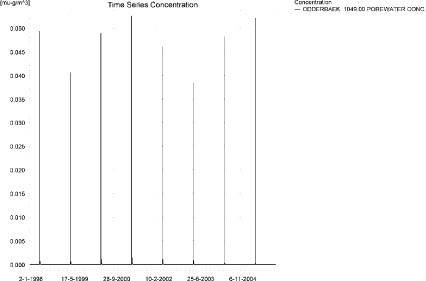
Figure 7.9. Pore water concentrations of pendimethalin in the sandy catchment after spring-application.
Figur 7.9. Porevandskoncentration for forårsudbragt pendimethalin i det sandede opland.
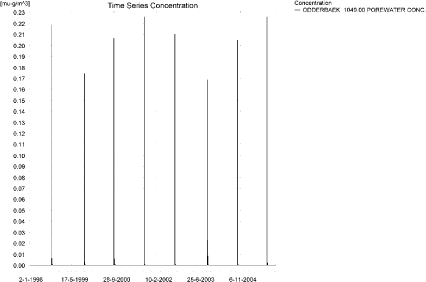
Figure 7.10. Pore water concentrations of pendimethalin in the sandy catchment after autumn-application.
Figur 7.10. Porevandskoncentration for efterårsårsudbragt pendimethalin i det sandede opland.
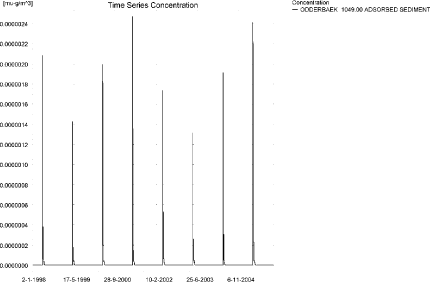
Figure 7.11. Example of sediment concentrations of pendimethalin in the sandy catchment after spring-application. The maximum value reached in the catchment is 2.9 ng/kg. Note that the concentrations are in µg/g and not µg/m³ as indicated.
Figur 7.11. Eksempel på sedimentkoncentration af forårsudbragt pendimethalin i det sandede opland. Maximumskoncentrationen i oplandet er 2.9 ng/kg. Bemærk at koncentrationen er i µg/g og ikke i µg/m³ som angivet.
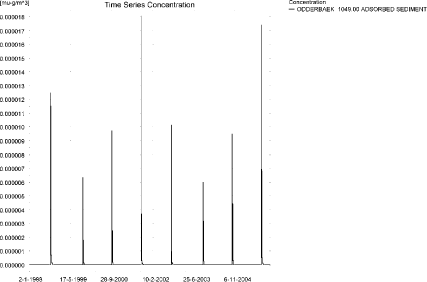
Figure 7.12. Example of sediment concentrations of pendimethalin in the sandy catchment after autumn-application. The maximum value reached is 20.9 ng/kg. Note that the concentrations are in µg/g and not µg/m³ as indicated.
Figur 7.12. Eksempel på sedimentkoncentration af efterårsudbragt pendimethalin i det sandede opland. Maximumskoncentrationen i oplandet er 20.9 ng/kg. Bemærk at koncentrationen er i µg/g og ikke i µg/m³ som angivet.
Figure 7.13, Figure 7.14, Table 7.5 and Table 7.6 show the output of the PestSurf Excel template. The template works with pre-defined data extraction points. The plot requires specification of a “lowest detection value” (ldc) which defines when a pesticide occurrence is defined as an event. The time series plot is identical to the time series shown earlier, and the graph in the upper right corner resembles the plots in Figure 7.3 - Figure 7.6, but takes into account a longer period of time. A curve is generated when a downstream point reaches a concentration higher than the ldc. The programme then tracks the highest concentration for each calculation point in the stream within the last 24 hours. The plot in the lower right corner shows how many events have concentrations higher than a given toxicity value for the selected monitoring points.
The tables show part of the result sheet generated by the PestSurf Excel sheet based on the ldc-value. The selected tables shows the point along the stream (of the pre-defined points) with the highest concentration. The highest concentration extracted by the PestSurf Excel sheet was 5.59 µg/l for the spring application and 2.493 µg/l for the autumn-application. Thus, the pre-defined points have not caught the highest concentrations of the simulations, which were 10.2 and 44.3 µg/l, respectively.
Table 7.3. Concentration of spring applied pendimethalin, ng/l, at selected points i in the sandy catchment.
Tabel 7.3. Koncentration af forårsudbragt pendimethalin, ng/l, på udvalgte lokaliteter i det sandede vandløb.
Table 7.4. Concentration of autumn applied pendimethalin, ng/l, at selected points i in the sandy catchment.
Tabel 7.4. Koncentration af efterårsudbragt, ng/l, på udvalgte lokaliteter i det sandede vandløb.
Click here to see Figure 7.13.
Figure 7.13. Overview for spring-applied pendimethalin in the sandy catchment generated by the PestSurf excel template. The max concentrations generated over the 24 hours are comparable to the overviews in Figure 7.3-Figure 7.4. Detection value was set to 10 ng/l.
Figur 7.13. Oversigt for forårsudbragt i det sandede opland genereret med PestSurf-excel-skabelonen. Den maximale koncentration genereret over 24 timer svarer til oversigterne i Figur 7.3-Figur 7.4. Detektionsgrænsen var sat til 10 ng/l.
Click here to see Figure 7.14.
Figure 7.14. Overview for autumn-applied pendimethalin in the sandy catchment generated by the PestSurf excel template. The max concentrations generated over the 24 hours are comparable to the overviews in Figure 7.5-Figure 7.6. Detection value was set to 10 ng/l.
Figur 7.14. Oversigt for forårsudbragt i det sandede opland genereret med PestSurf-excel-skabelonen. Den maximale koncentration genereret over 24 timer svarer til oversigterne i Figur 7.5-Figur 7.6. Detektionsgrænsen var sat til 10 ng/l.
Table 7.5. Part of the result sheet generated by the PestSurf Excel sheet for pendimethalin application during spring. The selected table shows the point along the stream with the highest concentration recorded. The detection limit is 10 ng/l, toxicity to fish is set to 100 ng/l. toxicity to daphnies and algae are set to 1000 and 10000 ng/, respectively. The recorded peaks are shown in Figure 7.13.
Tabel 7.5. Uddrag af resultatpresentationen genereret af PestSurf-Excel-arket for forårsudbragt pendimethalin. Den udvalgte tabel viser det fordefinerede punkt langs med åen med højest koncentration. Detektionsgrænsen er sat til 10 mens toxicitetsværdierne for fisk, dafnier og alger er henholdsvis 100, 1000 og 10000 ng/l. De tabellerede hændelser er vist i Figur 7.13.
Table 7.6. Part of the result sheet generated by the PestSurf Excel sheet for pendimethalin application during autumn. The selected table shows the point along the stream with the highest concentration recorded. The lowest detection value is 10 ng/l, toxicity to fish, daphnies and algae are set to 100, 1000 and 10000 ng/, respectively. The recorded peaks are shown in Figure 7.14.
Tabel 7.6. Uddrag af resultatpresentationen genereret af PestSurf-Excel-arket for efterårsudbragt pendimethalin. Den udvalgte tabel viser det fordefinerede punkt langs med åen med højest koncentration. Detektionsgrænsen er sat til 10 mens toxicitetsværdierne for fisk, dafnier og alger er henholdsvis 100, 1000 og 10000 ng/l. De tabellerede hændelser er vist i Figur 7.14.
7.4.2 Sandy catchment, pond
The concentration pattern is evaluated in the middle of the pond only, see Figure 7.15 and Figure 7.16, for the spring and autumn-application, respectively, and Table 7.7. The pond receives drift and a contribution from groundwater. The drift peaks are not visible. The baseflow contribution is dominating the picture. There is a considerable difference between concentrations reached from a spring and and autumn application, 0.145 and 7.17 µg/l, respectively.
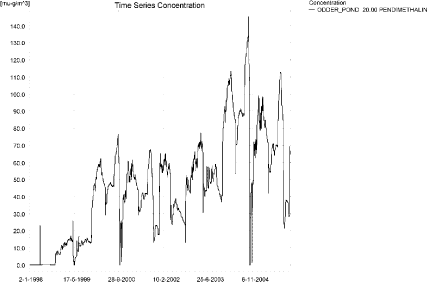
Figure 7.15. Concentrations of spring-applied pendimethalin in the sandy pond.
Figur 7.15. Koncentration af forårsudbragt pendimethalin i det sandede vandhul.
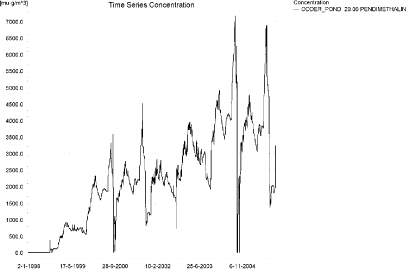
Figure 7.16. Concentrations of autumn-applied pendimethalin in the sandy pond.
Figur 7.16. Koncentration af efterårsudbragt pendimethalin i det sandede vandhul.
Table 7.7. Maximum concentrations of pendimethalin (ng/l) generated in the sandy pond for spring and autumn applications.
Tabel 7.7. Maximumkoncentrationer af forårs- og efterårsudbragt pendimethalin (ng/l) genereret for det sandede vandhul.
| Year | ODDER_POND 20.00, spring application | ODDER_POND 20.00, autumn application | |||||
| Conc. | TWC | Date | Conc. | TWC | Date | ||
| 1998 | 1998 (global max) | 23 | 01-05-1998 | 379 | 20-09-1998 | ||
| 1 hour (after max) | 15 | 16 | 231 | 274 | |||
| 1 day after sp.in. | 3 | 7 | 84 | 118 | |||
| 2 days | 0 | 3 | 75 | 91 | |||
| 4 days | 0 | 2 | 76 | 87 | |||
| 7 days | 0 | 1 | 83 | 84 | |||
| 1999 | 1999 (global max) | 47 | 28-12-1999 | 1387 | 30-12-1999 | ||
| 1 hour (after max) | |||||||
| 1 day after sp.in. | 47 | 47 | 1321 | 1354 | |||
| 2 days | 47 | 47 | 1311 | 1323 | |||
| 4 days | 47 | 47 | 1305 | 1319 | |||
| 7 days | 46 | 47 | 1265 | 1306 | |||
| 2000 | 2000 (global max) | 77 | 20-09-2000 | 3575 | 02-10-2000 | ||
| 1 hour (after max) | 2810 | 3011 | |||||
| 1 day after sp.in. | 72 | 74 | 2508 | 2562 | |||
| 2 days | 67 | 71 | 2391 | 2507 | |||
| 4 days | 66 | 70 | 2218 | 2456 | |||
| 7 days | 62 | 67 | 400 | 2120 | |||
| 2001 | 2001 (global max) | 67 | 16-09-2001 | 4509 | 20-09-2001 | ||
| 1 hour (after max) | 3728 | 3935 | |||||
| 1 day after sp.in. | 67 | 67 | 3315 | 3419 | |||
| 2 days | 67 | 67 | 3199 | 3306 | |||
| 4 days | 67 | 67 | 3159 | 3274 | |||
| 7 days | 66 | 67 | 3069 | 3204 | |||
| 2002 | 2002 (global max) | 65 | 06-03-2002 | 2834 | 06-03-2002 | ||
| 1 hour (after max) | |||||||
| 1 day after sp.in. | 65 | 65 | 2826 | 2830 | |||
| 2 days | 63 | 64 | 2592 | 2727 | |||
| 4 days | 62 | 64 | 2576 | 2691 | |||
| 7 days | 60 | 63 | 2477 | 2617 | |||
| 2003 | 2003 (global max) | 91 | 27-12-2003 | 3958 | 29-03-2003 | ||
| 1 hour (after max) | |||||||
| 1 day after sp.in. | 91 | 91 | 3850 | 3904 | |||
| 2 days | 91 | 91 | 3889 | 3855 | |||
| 4 days | 91 | 91 | 3780 | 3850 | |||
| 7 days | 91 | 91 | 3689 | 3809 | |||
| 2004 | 2004 (global max) | 145 | 20-09-2004 | 7170 | 11-09-2004 | ||
| 1 hour (after max) | |||||||
| 1 day after sp.in. | 137 | 141 | 6477 | 6824 | |||
| 2 days | 127 | 134 | 6040 | 6433 | |||
| 4 days | 125 | 132 | 5901 | 6318 | |||
| 7 days | 118 | 127 | 5605 | 6071 | |||
| 2005 | 2005 (global max) | 113 | 16-09-2005 | 6885 | 15-09-2005 | ||
| 1 hour (after max) | |||||||
| 1 day after sp.in. | 113 | 113 | 6687 | 6786 | |||
| 2 days | 112 | 113 | 5958 | 6436 | |||
| 4 days | 112 | 113 | 5785 | 6295 | |||
| 7 days | 111 | 112 | 5565 | 6041 | |||
| Global max | 145 | 7170 | |||||
| 1 hour (after max) | 15 | 16 | 3728 | 3935 | |||
| 1 day after sp.in. | 137 | 141 | 6687 | 6824 | |||
| 2 days | 127 | 134 | 6040 | 6436 | |||
| 4 days | 125 | 132 | 5901 | 6318 | |||
| 7 days | 118 | 127 | 5605 | 6071 | |||
As for the previous simulation, the sorption to macrophytes, see Figure 7.17 and Figure 7.18 is significant compared to the concentration in the water phase. The corresponding pore water and sediment concentrations are shown in Figure 7.19- Figure 7.22. For the spring application, the concentration reaches 0.054 µg/kg and for the autumn application, 2.27 µg/kg.
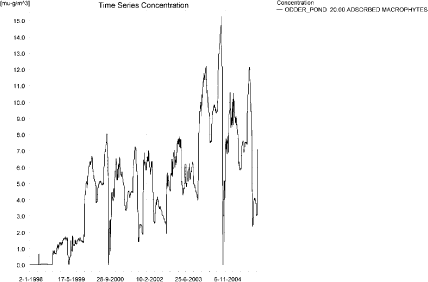
Figure 7.17. Sorption of spring-applied pendimethalin to macrophytes in the sandy pond.
Figur 7.17. Sorption af forårsudbragt pendimethalin til makrofytter i det sandede vandhul.
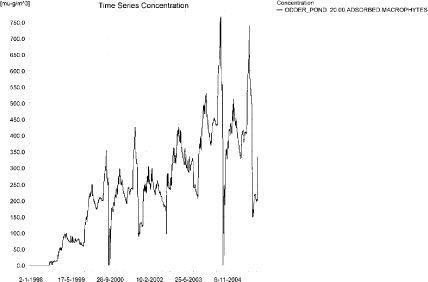
Figure 7.18. Sorption of autumn-applied pendimethalin to macrophytes in the sandy pond.
Figur 7.18. Sorption af efterårsudbragt pendimethalin til makrofytter i det sandede vandhul.
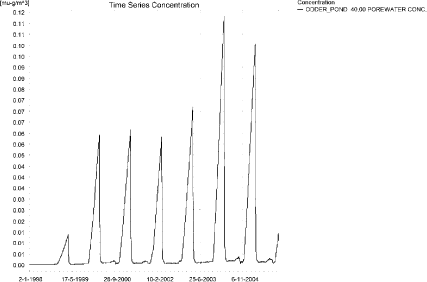
Figure 7.19. Pore water concentration of spring-applied pendimethalin in the sandy pond.
Figur 7.19. Porevandskoncentration af forårsudbragt pendimethalin i det sandede vandhul.
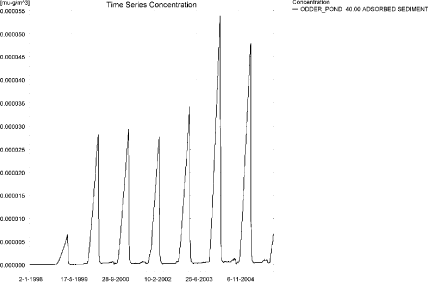
Figure 7.20. Sorption of spring-applied pendimethalin to sediment in the sandy pond. The concentration is in µg/g sediment and not µg/m³ as stated.
Figur 7.20. Sorption af forårsudbragt pendimethalin til sediment i det sandede vandhul. Koncentrationen er i µg/g og ikke i µg/m³ som angivet.
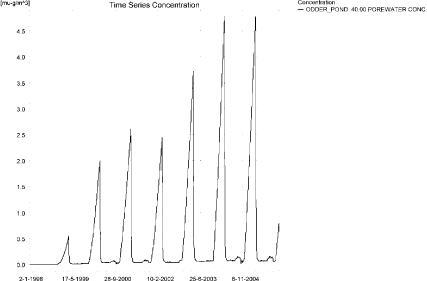
Figure 7.21. Pore water concentration of autumn-applied pendimethalin in the sandy pond.
Figur 7.21. Porevandskoncentration af efterårsudbragt pendimethalin i det sandede vandhul.
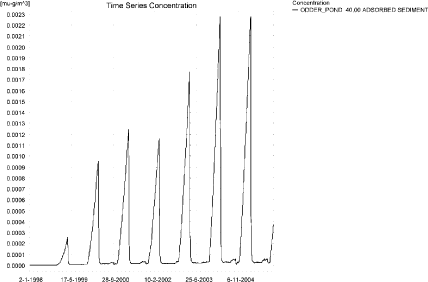
Figure 7.22. Sorption of autumn-applied pendimethalin to sediment in the sandy pond. The concentration is in µg/g sediment and not µg/m³ as stated.
Figur 7.22. Sorption af efterårsudbragt pendimethalin til sediment i det sandede vandhul. Koncentrationen er i µg/g og ikke i µg/m³ som angivet.
Compared to the FOCUS D3 ditch, the concentration in the PestSurf sandy pond generates lower values for the spring application but comparable values for the autumn application. For the spring application, PestSurf generates 0.145 µg/l, while the D3 ditch generates 2.51 µg/l. For the autumn application, PestSurf generates 7.17 µg/l and the D3-ditch 10.1 µg/l. The sediment concentrations generated by FOCUS SW-D3 ditch are 1.5 and 7.9 µg/kg, while PestSurf generates substantially smaller sediment concentrations of 0.05 and 2.3 µg/kg.
Figure 7.23 and Figure 7.24 show the output of the PestSurf Excel template. The template works with one pre-defined data extraction point for the pond (center of the pond). The plot requires specification of a “lowest detection value” (ldc) which defines when a pesticide occurrence is defined as an event. The time series plot is identical to the time series shown earlier. The plot to the right shows how many events have concentrations higher than a given toxicity value for the selected monitoring points.
Table 7.8 and Table 7.9 show part of the result sheet generated by the PestSurf Excel sheet based on the ldc-value. In the pond-case, there is no difference between the results of PestSurf and the results extracted by the templates.
Click here to see Figure 7.23.
Figure 7.23. Overview for spring-applied pendimethalin in the sandy pond generated by the PestSurf excel template. The time series shown is identical to the one in Figure 7.15. The detection value used for generation of the figure is 25 ng/l.
Figur 7.23. Oversigt for forårsudbragt i det sandede vandhul genereret med PestSurf-excel-skabelonen. Den viste tidsserie er mage til den i Figur 7.15. Detektionsgrænsen anvendt til generering af figurer er sat til 25 ng/l.
Click here to see Figure 7.24.
Figure 7.24. Overview for autumn-applied pendimethalin in the sandy pond generated by the PestSurf excel template. The time series shown is identical to the one in Figure 7.16. The detection value used for generation of the figure is 1000 ng/l.
Figur 7.24. Oversigt for forårsudbragt i det sandede vandhul genereret med PestSurf-excel-skabelonen. Den viste tidsserie er mage til den i Figur 7.16. Detektionsgrænsen anvendt til generering af figurer er sat til 1000 ng/l.
Table 7.8. Part of the result sheet generated by the PestSurf Excel sheet, applied to the spring application of pendimethalin. The lowest detection value is set to 25 ng/l, toxicity to fish, daphnies and algae are set to 50, 100 and 1000 ng/, respectively. The recorded peaks are shown in Figure 7.23. EOφ = End of File.
Tabel 7.8. Uddrag af resultatpresentationen genereret af PestSurf-Excel-arket anvendt på forårsudbragt pendimethalin. Grænseværdien anvendt til tabelgenerering er 25 ng/l mens toxicitetsværdierne for fisk, dafnier og alger er henholdsvis 50, 100 og 1000 ng/l. De tabellerede hændelser er vist iFigur 7.23. EOφ = filafslutning.
Table 7.9. Part of the result sheet generated by the PestSurf Excel sheet, applied to the autumn application of pendimethalin. The lowest detection value is set to 1000 ng/l, toxicity to fish, daphnies and algae are set to 4000, 6000 and 8000 ng/, respectively. The recorded peaks are shown in Figure 7.24.
Tabel 7.9. Uddrag af resultatpresentationen genereret af PestSurf-Excel-arket anvendt på efterårsudbragt pendimethalin. Grænseværdien anvendt til tabelgenerering er 1000 ng/l mens toxicitetsværdierne for fisk, dafnier og alger er henholdsvis 4000, 6000 og 8000 ng/l. De tabellerede hændelser er vist i Figur 7.24.
7.4.3 Sandy Loam catchment, Stream
The distribution of concentrations was assessed in several steps. First, the maximum concentrations at each calculation point were listed, and the dates for the occurrence of the maximum were assessed. The points, for which the maximum value also represents a local maximum were selected for further analysis. The relevant values are listed in Table 7.10.
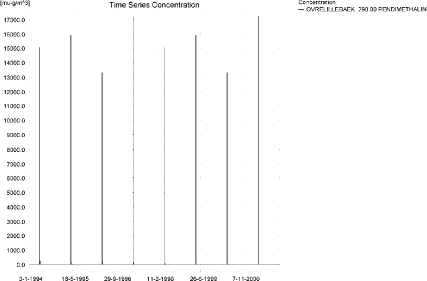
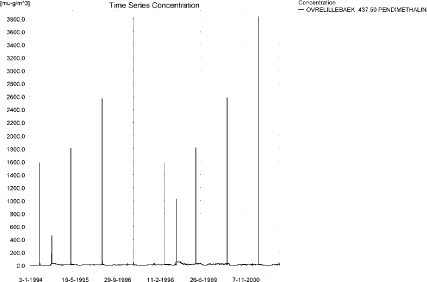
The maximum concentrations are caused by drainage events, but the pattern differs markedly between the upstream and the downstream end. Figure 7.25 a and b represents the spring application in the upstream part of the catchment. Drift is the cause of high concentrations, but the extreme rainfall event around 18. September 1998 is visible and causes a peak to occur. Apart from these event, concentrations are very low.
Figure 7.26 shows the pattern for the lower part of the sandy loam catchment. The downstream points all show a different picture. The concentrations build up over the 8 years simulated and becomes very high at the end of the summer of 2000 and 2001 (corresponding to a very dry year and a normal year, respectively). During these periods, the flow in the stream consists of base flow contributions through drain only. This buildup is considered to be exaggerated by the model, and it is very high for pendimethalin due to the slow breakdown of the compound.
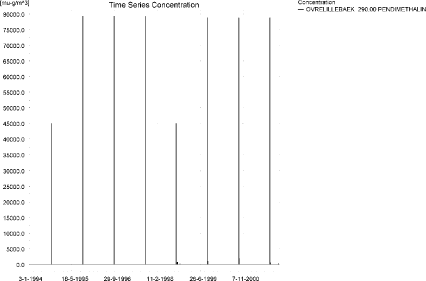
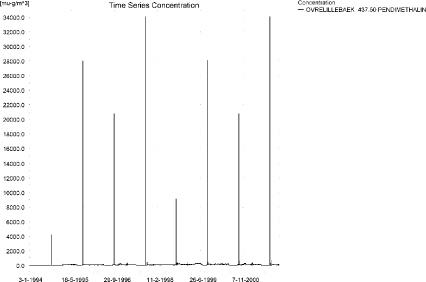
Figure 7.27 shows two time series for the autumn application in the upstream part of the system. The difference between years due to the actual water depth in the stream at the time of spraying is evident, particularly in Figure 7.27b.
Figure 7.28 shows a pattern for the lower part of the system. The pattern is comparable to the spring application, but the resulting concentrations are higher. However, also the drift contribution is more pronounced for the autumn application than for the spring application.
Table 7.10. Maximum concentrations (ng/l) of pendimethalin simulated for each calculation point in the sandy loam catchment for spring and autumn applications respectively.
Tabel 7.10. Maximumskoncentrationer (ng/l) af forårs- og efterårsudbragt pendimethalin simuleret for hvert beregningspunkt i morænelersoplandet.
a)
b)
Figure 7.25. Concentration pattern for the spring application of pendimethalin in the upper part of the sandy loam catchment.
Figur 7.25. Koncentrationsmønster for forårsudbragt pendimethalin i den opstrøms ende af morænelersoplandet.
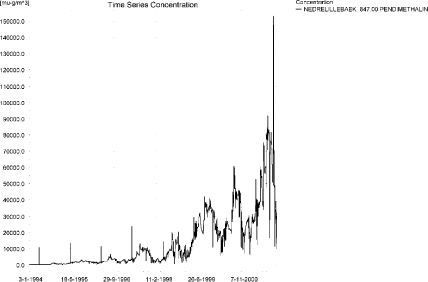
Figure 7.26. Concentration pattern for the spring application of pendimethalin in downstream end of the sandy loam catchment. This pattern is characteristic for the tributaries Fredligbaek and Groftebaek as well as the lower part of the sandy loam catchment.
Figur 7.26. Koncentrationsmønster for forårsudbragt pendimethalin i den nedstrøms ende af morænelersoplandet.Mønsteret er karakteristisk for tilløbene Fredligbæk og Grøftebæk, samt den nedre del af morænelersoplandet.
a)
b)
Figure 7.27. Concentration pattern for the autumn application of pendimethalin in OvreLillebaek, in the upper part of the sandy loam catchment.
Figur 7.27. Koncentrationsmønster for efterårsudbragt pendimethalin i den opstrøms ende af morænelersoplandet.
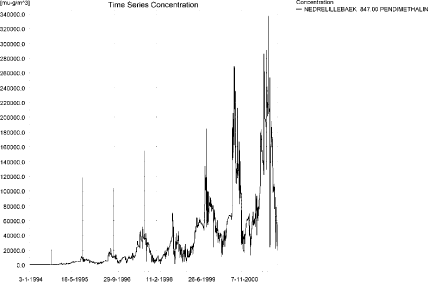
Figure 7.28. Concentration pattern for the autumn application of pendimethalin in the downstream end of the sandy loam catchment. This pattern is characteristic for the tributaries Fredligbaek and Groftebaek as well as the lower part of the sandy loam catchment.
Figur 7.28. Koncentrationsmønster for efterårsudbragt pendimethalin i den nedstrøms ende af morænelersoplandet.Mønsteret er karakteristisk for tilløbene Fredligbæk og Grøftebæk, samt den nedre del af morænelersoplandet.
Longitudinal concentrations profiles for the sandy loam catchment are shown in Figure 7.29 for the spring application and in Figure 7.30, Figure 7.31 and Figure 7.32 for the autumn application.
The thin black line represents the concentration, while the thick black line shows the maximum concentrations obtained during the simulations. In addition, the outline of the stream is shown.
The simulations are dominated by the contribution from baseflow to the lower end of the catchment. Figure 7.29 shows the longitudinal profile for the time of maximum concentration reached with spring application of pendimethalin. Figure 7.30 shows the similar case for the autumn application. In this case, the baseflow contribution and the drift contribution occur simultaneously and contributes to the very high values. Figure 7.31 and Figure 7.32 shows two other time periods where maximum values are reached for selected points in upstream parts of the catchment. These points are caused by wind drift.
It is generally thought that the model overestimates the transport to groundwater, and, as a consequence of this, it overestimates the contribution through groundwater flow in the lower part of the catchment. The particularly high level of baseflow in the lower part of this catchment is due to occurrence of a sandy layer that transports solute horizontally through the catchment to the lower part of the stream.
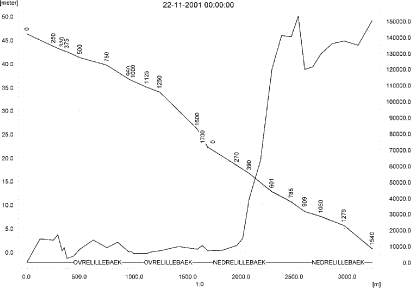
Figure 7.29. Pendimethalin concentrations in the sandy loam catchment on 22. November 2001 (spring application).The concentrations are generated by baseflow contribution to the downstream end of the system.
Figur 7.29. Pendimethalin-koncentrationer i morænelersoplandet den 22.november-2001 (forårsudbringning). Koncentrationerne genereres af grundvandstilstrømning i den nedre ende af systemet).
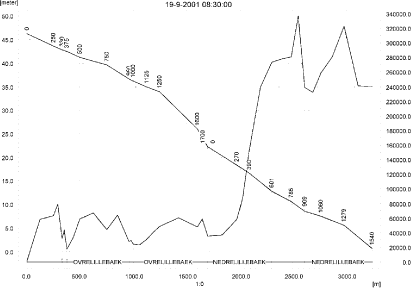
Figure 7.30. Concentrations in the sandy loam catchment on 19. September 2001, just after autumn application.The concentrations are generated by a mix of wind drift, producing the high concentrations in the upstream part of the catchment and wind drift plus groundwater contribution in the downstream end of the catchment.
Figur 7.30. Koncentrationer i morænelersoplandet den 19.september-2001, lige efter efterårsårsudbringning. Koncentrationerne genereres af et mix af vinddrift og grundvandstilstrømning i den nedre ende af systemet.
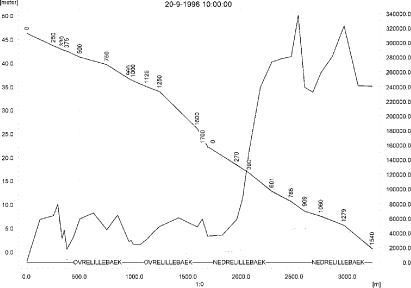
Figure 7.31. Concentrations in the sandy loam catchment on 20. September 1996 after autumn applications. The concentrations are generated by wind drift moving downstream after spraying.
Figur 7.31. Koncentrationer i morænelersoplandet den 20.september-1996 efter efterårsudbringning. Koncentrationerne genereres af vinddrift, der bevæger sig med strømmen efter sprøjtning.
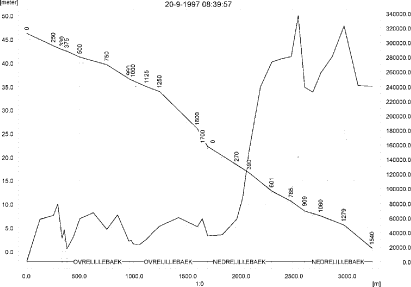
Figure 7.32. Concentrations in the sandy loam catchment on 20. September 1997 after autumn applications. The concentrations are generated by wind drift in the upper part of the catchment and drift in combination with baseflow contribution to the downstream end of the system.
Figur 7.32. Koncentrationer i morænelersoplandet den 20.september-1997 efter efterårsudbringning. Koncentrationerne genereres af vinddrift i den øvre del af oplandet og drift i kombination med grundvandstilstrømning i den nedre ende af systemet.
To be able to extract comparable values to FOCUS SW, the global maxima and time weighted concentrations (up to 7 days) were extracted when these were meaningful (Table 7.11 and Table 7.12).
Concentrations of pendimethalin on macrophytes are very high in the simulations. Figure 7.33 and Figure 7.34 shows the concentrations in the upstream and downstream part of the catchment after spring application. The maximum value reached in the downstream end is 326 µg/l, a value that is about double the concentration in the water phase. Similar graphs are shown in Figure 7.35 and Figure 7.36 for the autumn application. The maximum value found in the catchment is 1211 µg/l, about four times the water concentration. In this case the macrophytes strongly influence the simulation results for the water phase. The concentrations are judget to be unrealistically high.
Table 7.11. Maximum concentrations (ng/l) of spring-applied pendimethalin simulated for selected calculation point in the sandy loam catchment.
Tabel 7.11. Maximumskoncentrationer (ng/l) af forårsudbragt pendimethalin for udvalgte lokaliteter i morænelersoplandet.
Table 7.12. Maximum concentrations (ng/l) of autumn-applied pendimethalin simulated for selected calculation point in the sandy loam catchment.
Tabel 7.12. Maximumskoncentrationer (ng/l) af efterårsudbragt pendimethalin for udvalgte lokaliteter i morænelersoplandet.
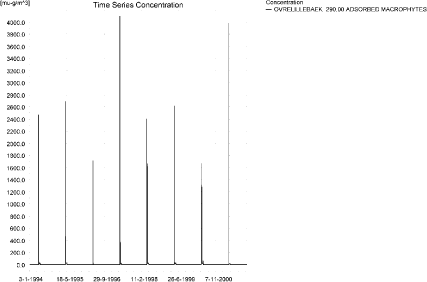
Figure 7.33. Concentration of spring-applied pendimethalin on macrophytes 290 m from the upstream end of the main stream.
Figur 7.33. Koncentration af forårsudbragt pendimethalin på makrofytter 290 m fra den opstrøms ende af morænelersoplandet.
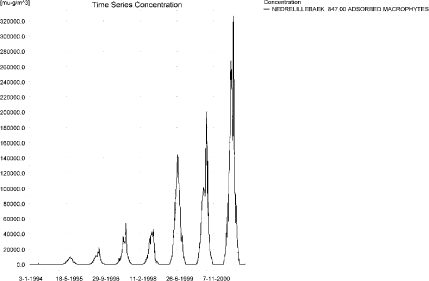
Figure 7.34. Concentration of spring-applied pendimethalin on macrophytes in the lower part of the stream. The pattern is representative of the spring application for the tributaries Fredligbaek, Groftebaek and the lower part of the sandy loam catchment.
Figur 7.34. Koncentration af forårsudbragt pendimethalin på makrofytter m i den nedstrøms ende af morænelersoplandet. Mønsteret er repræsenterer forårsudbringningen for tilløbene Fredligbæk, Grøftebæk og den nedstrøms del af morænlersoplandet.
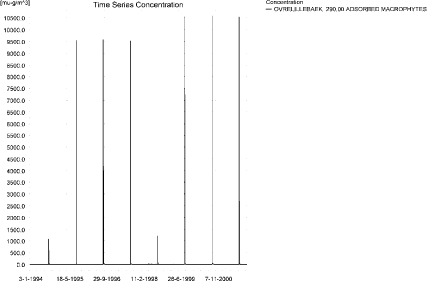
Figure 7.35. Concentration of autumn-applied pendimethalin on macrophytes 290 m from the upstream end of the sandy loam catchment.
Figur 7.35. Koncentration af efterårsudbragt pendimethalin på makrofytter 290 m fra den opstrøms ende af morænelersoplandet.
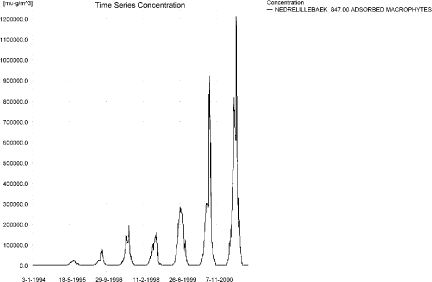
Figure 7.36. Concentration of autumn-applied pendimethalin on macrophytes in ng/l at the lower part of the stream. The pattern is representative of the autumn application for the tributaries Fredligbæk and Groftebæk and the lower part of the sandy loam catchment.
Figur 7.36. Koncentration af efterårsudbragt pendimethalin på makrofytter i den nedstrøms ende af morænelersoplandet. Mønsteret er repræsenterer efterårsudbringningen for tilløbene Fredligbæk, Grøftebæk og den nedstrøms del af morænlersoplandet.
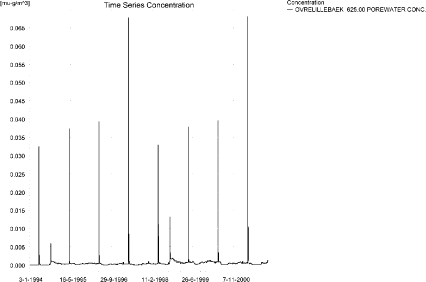
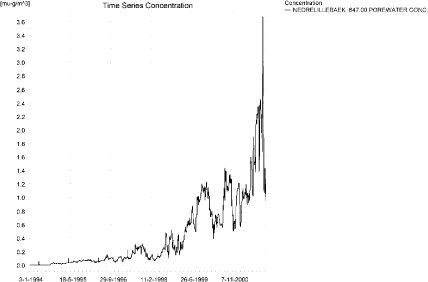
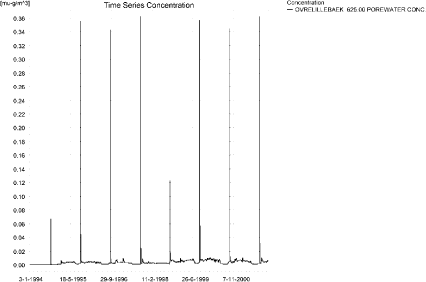
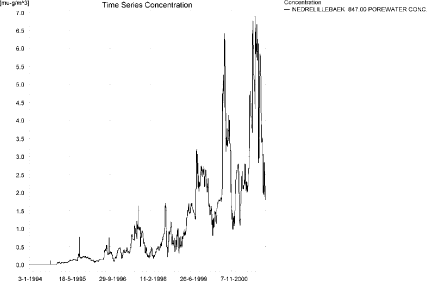
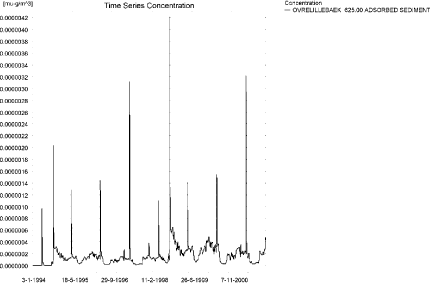
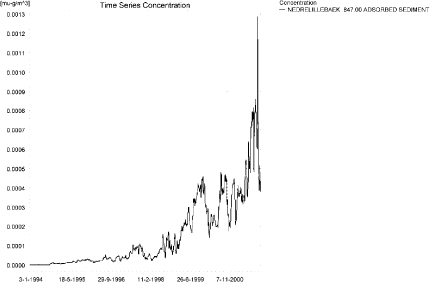
The concentration of pendimethalin in porewater is shown in Figure 7.37 and Figure 7.38 and the corresponding concentrations of pendimethalin sorbed to sediment in Figure 7.39 and Figure 7.40. The sediment concentration reaches 1.29 µg/kg for the spring application and 2.34 µg/kg for the autumn application.
a)
b)
Figure 7.37. Pore water concentration of spring-applied pendimethalin in the a) upper and b) lower part of the sandy loam catchment.
Figur 7.37. Porevandskoncentration for forårsudbragt pendimethalin i a) den øvre og b) den nedre del af morænelersoplandet.
a)
b)
Figure 7.38. Pore water concentration of autumn-applied pendimethalin in the a) upper and b) lower part of the sandy loam catchment.
Figur 7.38. Porevandskoncentration for efterårsudbragt pendimethalin i a) den øvre og b) den nedre del af morænelersoplandet.
a)
b)
Figure 7.39. Sorption of spring-applied pendimethalin to sediment in the a) upper and b) lower part of the sandy loam catchment. The concentration is in µg/g sediment and not µg/m³ as stated.
Figur 7.39. Sorption af forårsudbragt pendimethalin til sediment i a) den øvre og b) den nedre del af morænelersoplandet. Koncentrationen er i µg/g sediment og ikke µg/m³ som angivet.
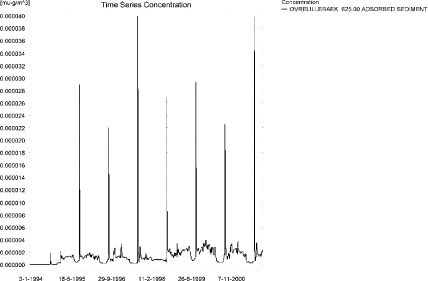
a)
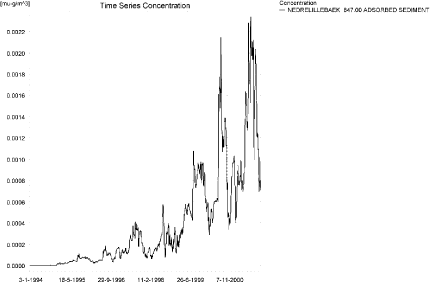
b)
Figure 7.40. Sorption of autumn-applied pendimethalin to sediment in the a) upper and b) lower part of the sandy loam catchment. The concentration is in µg/g sediment and not µg/m³ as stated.
Figur 7.40. Sorption af efterårsudbragt pendimethalin til sediment i a) den øvre og b) den nedre del af morænelersoplandet. Koncentrationen er i µg/g sediment og ikke µg/m³ som angivet.
FOCUS SW-stream-scenario for D4 generates concentrations of 2.07 and 8.65 µg/l, for spring and autumn applications, respectively. These values are much smaller than the values generated by PestSurf. 125 m from the upstream end, PestSurf generates concentrations of 14.4 and 58.6 µg/l, for the spring and autumn application, respectively. The difference of a factor 6-7 is mainly due to difference in water depth at the time of spraying.
The maximum values in the simulation reached 153 and 337 µg/l, respectively and these results are judged as unrealistic. They are caused by the accumulation of pendimethalin in the groundwater and contribution of baseflow to the lower part of the stream. For the autumn application, the baseflow contribution and the wind drift occurrence (from a long stretch and within a very short time) are present simultaneously.
The sediment concentrations in PestSurf only reaches 1.3 and 2.3 µg/kg, compared to 1.5 and 9.5 µg/kg calculated by the FOCUS SW-D4-stream scenario for the spring and the autumn application, respectively.
Figure 7.41 to Figure 7.45 and Table 7.13 to Table 7.16 show the results as generated by the PestSurf templates. The maximum value generated by the templates for the upper part of the stream is 10.4 and 59.2 µg/l, for the spring and the autumn-application respectively, and for the lower part, 138 and 323 µg/l, respectively. The maximum values for the upper part of the catchment found by the templates do not represent the maximum values simulated, which were 17.2 and 79.3 µg/l. For the lower part of the stream, however, the actual maximum values in the simulation are 153 and 337 µg/l for the spring and autumn-application, respectively.
Click here to see Figure 7.41.
Figure 7.41. Overview for spring-applied pendimethalin in the sandy loam catchment generated by the PestSurf excel template in the upstream part of the catchment. The detection value was set to 5 ng/l.
Figur 7.41. Oversigt for forårsudbragt pendimethalin i morænelersoplandet genereret med PestSurf-excel-skabelonen for den opstrøms del af oplandet. Detektionsgrænsen var sat til 5 ng/l.
Click here to see Figure 7.42.
Figure 7.42. Overview for spring applied pendimethalin in the sandy loam catchment generated by the PestSurf excel template in the upstream part of the catchment. The toxicity value was set to 10 ng/l spring. The figure is identical to Figure 7.41 except for the lower right figure.
Figur 7.42. Oversigt for forårsudbragt pendimethalin i morænelersoplandet genereret med PestSurf-excel-skabelonen for den opstrøms del af oplandet. Detektionsgrænsen var sat til 10 ng/l. Figuren er identisk med Figur 7.41 bortset fra figuren nederst til højre.
Click here to see Figure 7.43.
Figure 7.43. Overview for spring applied pendimethalin in the sandy loam catchment generated by the PestSurf excel template in the downstream part of the catchment. The detection value was set to 5 ng/l spring.
Figur 7.43. Oversigt for forårsudbragt pendimethalin i morænelersoplandet genereret med PestSurf-excel-skabelonen for den nedstrøms del af oplandet. Detektionsgrænsen var sat til 5 ng/l.
Click here to see Figure 7.44.
Figure 7.44. Overview for autumn-applied pendimethalin in the sandy loam catchment generated by the PestSurf excel template in the upstream part of the catchment. The detection value was set to 25 ng/l.
Figur 7.44. Oversigt for efterårsudbragt pendimethalin i morænelersoplandet genereret med PestSurf-excel-skabelonen for den opstrøms del af oplandet. Detektionsgrænsen var sat til 25 ng/l.
Click here to see Figure 7.45.
Figure 7.45. Overview for autumn-applied pendimethalin in the sandy loam catchment generated by the PestSurf excel template in the downstream part of the catchment. The detection value was set to 25 ng/l spring.
Figur 7.45. Oversigt for efterårsudbragt pendimethalin i morænelersoplandet genereret med PestSurf-excel-skabelonen for den nedstrøms del af oplandet. Detektionsgrænsen var sat til 25 ng/l.
Table 7.13. Part of the result sheet generated by the PestSurf Excel sheet for the upstream part of the sandy loam catchment for the spring application of pendimethalin. The detection values is set to 5 ng/l, toxicity to fish, daphnies and algae are set to 10, 100 and 1000 ng/, respectively. The recorded peaks are shown in Figure 7.41.
Tabel 7.13. Uddrag af resultatpresentationen genereret af PestSurf-Excel-arket for den opstrøms del af morænelersoplandet for forårsudbragt pendimethalin. Detektionsgrænsen for tabelgenerering er sat til 5 ng/l. Toxicitetsværdierne for fisk, dafnier og alger er henholdsvis 10, 100 og 1000 ng/l. Hændelserne er vist i Figur 7.41.
Table 7.14. Part of the result sheet generated by the PestSurf Excel sheet for the downstream part of the sandy loam catchment for the spring application of pendimethalin. The limiting values is set to 5 ng/l, toxicity to fish, daphnies and algae are set to 10, 100 and 1000 ng/, respectively. The recorded peaks are shown in Figure 7.43.
Tabel 7.14. Uddrag af resultatpresentationen genereret af PestSurf-Excel-arket for den nedstrøms del af morænelersoplandet for forårsudbringningen af pendimethalin. Detektionsgrænsen for tabelgenerering er sat til 5 ng/l. Toxicitetsværdierne for fisk, dafnier og alger er henholdsvis 10, 100 og 1000 ng/l. Hændelserne er vist i Figur 7.43.
Table 7.15. Part of the result sheet generated by the Pestsurf Excel sheet for the upstream part of the sandy loam catchment for the autumn application of pendimethalin. The limiting values is set to 25 ng/l, toxicity to fish, daphnies and algae are set to 50, 100 and 1000 ng/, respectively. The recorded peaks are shown in Figure 7.44. Tabel 7.15. Uddrag af resultatpresentationen genereret af PestSurf-Excel-arket for den opstrøms del af morænelersoplandet for efterårsudbragt pendimethalin. Detektionsgrænsen for tabelgenerering er sat til 25 ng/l. Toxicitetsværdierne for fisk, dafnier og alger er henholdsvis 50, 100 og 1000 ng/l. Hændelserne er vist i Figur 7.44.
Table 7.16. Part of the result sheet generated by the PestSurf Excel sheet for the downstream part of the sandy loam catchment for the autumn application of pendimethalin. The limiting values is set to 25 ng/l, toxicity to fish, daphnies and algae are set to 100, 1000 and 10000 ng/, respectively. The recorded peaks are shown in Figure 7.45.
Tabel 7.16. Uddrag af resultatpresentationen genereret af PestSurf-Excel-arket for den nedstrøms del af morænelersoplandet for efterårsudbringningen af pendimethalin. Detektionsgrænsen for tabelgenerering er sat til 25 ng/l. Toxicitetsværdierne for fisk, dafnier og alger er henholdsvis 100, 1000 og 10000 ng/l. Hændelserne er vist i Figur 7.45.
7.4.4 Sandy loam catchment, pond
The concentration pattern is evaluated in the middle of the pond only, see Figure 7.46 and Figure 7.47. For the spring application, the pond receives contributions mainly through drift, in good correspondence with the fact that it is situated in the upper part of the sandy loam catchment. The maximum concentration is 0.165 µg/l. For the autumn application, the maximum concentration is higher, around 1.514 µg/l. The peaks are still dominated by drift. Concentrations are diluted during winter.
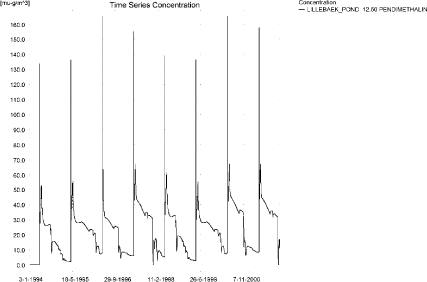
Figure 7.46. Concentrations of spring applied pendimethalin in the sandy loam pond.
Figur 7.46. Koncentration af forårsudbragt pendimethalin i morænelersvandhullet.
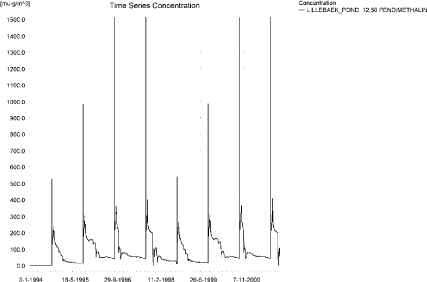
Figure 7.47. Concentrations of autumn applied pendimethalinin the sandy loam pond.
Figur 7.47. Koncentration af efterårsudbragt pendimethalin i morænelersvandhullet.
Figure 7.48 and Figure 7.49 show that the macrophytes participate in the regulation of the concentrations in the pond. The concentration level is similar to the concentration in the water phase. The concentration in the porewater is somewhat lower, as illustrated in Figure 7.50 and Figure 7.52. The corresponding concentration of pendimethalin sorbed to sediment is shown in Figure 7.51 and Figure 7.53. The concentrations reach 5.4 ng/kg and 144 ng/kg for the spring and autumn applications, respectively.
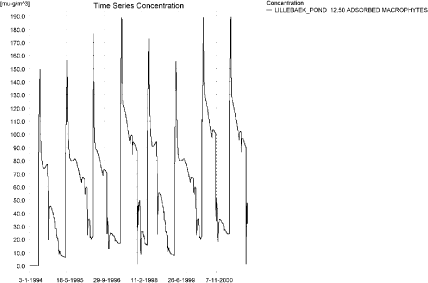
Figure 7.48. Spring-applied pendimethalin sorbed to the macrophytes in the sandy loam pond.
Figur 7.48. Forårsudbragt pendimethalin sorberet til makrofytter i morænelers-vandhullet.
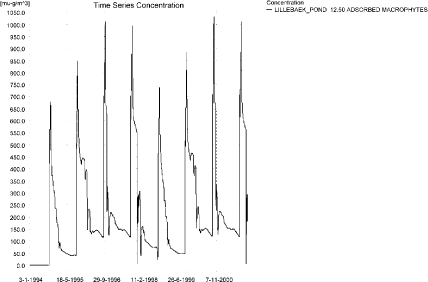
Figure 7.49. Autumn-applied pendimethalin sorbed to the macrophytes in the sandy loam pond.
Figur 7.49. Efterårsudbragt pendimethalin sorberet til makrofytter i morænelers-vandhullet.
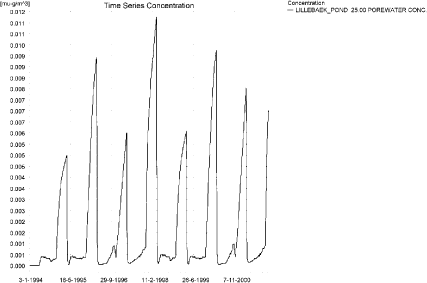
Figure 7.50. Pore water concentration of spring-applied pendimethalin in the sandy loam pond.
Figur 7.50. Porevandskoncentration af forårsudbragt pendimethalin i morænelersvandhullet.
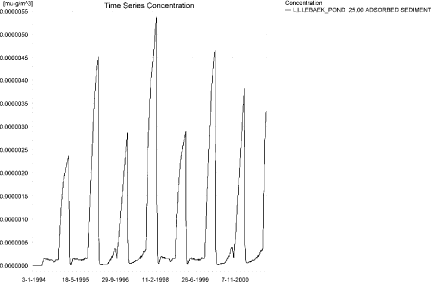
Figure 7.51. Sorption of spring-applied pendimethalin to sediment in the sandy loam pond. The concentration is in µg/g sediment and not µg/m³ as stated.
Figur 7.51. Forårsudbragt pendimethalin sorberet til sediment i morænelersvandhullet. Koncentrationen er i µg/g sediment og ikke µg/m³ som angivet.
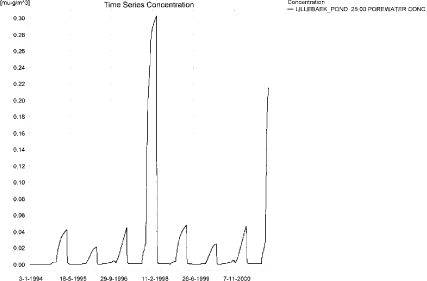
Figure 7.52. Pore water concentration of autumn-applied pendimethalin in the sandy loam pond.
Figur 7.52. Porevandskoncentration af efterårsudbragt pendimethalin i morænelersvandhullet.
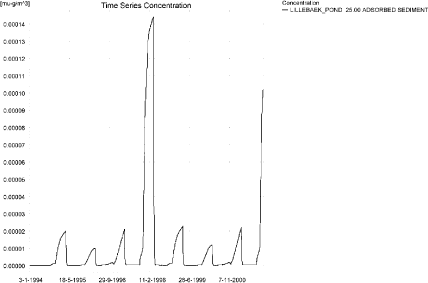
Figure 7.53. Sorption of autumn-applied pendimethalin to sediment in the sandy loam pond. The concentration is in µg/g sediment and not µg/m³ as stated.
Figur 7.53. Efterårsudbragt pendimethalin sorberet til sediment i morænelersvandhullet. Koncentrationen er i µg/g sediment og ikke µg/m³ som angivet.
In Table 7.17, global maxima and time weighted concentrations (up to 7 days) were extracted.
Table 7.17. Actual and time weighted concentrations (ng/l) of pendimethalin in the sandy loam pond.
Tabel 7.17. Beregnede og tidsvægtede koncentrationer (ng/l) af pendimethalin i morænelersvandhullet.
| Spring application | Autumn application | ||||||
| Year | Pendimethalin | actual | Time-weighted | Date | actual | Time-weighted | Date |
| 1994 | global max | 134 | 01-05-1994 | 525 | 20-09-1994 | ||
| 1 hour(after max) | 85 | 104 | 336 | 411 | |||
| 1 day after sp.in. | 28 | 37 | 113 | 147 | |||
| 3 days | 29 | 31 | 123 | 127 | |||
| 4 days | 30 | 31 | 130 | 127 | |||
| 7 days | 35 | 31 | 152 | 133 | |||
| 1995 | Global max | 136 | 01-05-1995 | 982 | 20-09-1995 | ||
| 1 hour | 87 | 107 | 511 | 675 | |||
| 1 day | 30 | 39 | 170 | 229 | |||
| 2 days | 31 | 33 | 171 | 188 | |||
| 4 days | 33 | 33 | 178 | 185 | |||
| 7 days | 37 | 34 | 201 | 187 | |||
| 1996 | global max | 165 | 02-05-1996 | 1510 | 20-09-1996 | ||
| 1 hour | 98 | 123 | 641 | 891 | |||
| 1 day | 44 | 52 | 225 | 304 | |||
| 2 (3*)days | 50 | 49 | 219 | 246 | |||
| 4 days | 54 | 49 | 226 | 240 | |||
| 7 (6*)days | 63 | 53 | 250 | 239 | |||
| 1997 | global max | 155 | 01-05-1997 | 1513 | 20-09-1997 | ||
| 1 hour | 98 | 120 | 641 | 892 | |||
| 1 day | 36 | 46 | 223 | 303 | |||
| 2 (3*)days | 38 | 40 | 214 | 243 | |||
| 4 days | 39 | 39 | 220 | 237 | |||
| 7 (6*)days | 45 | 41 | 242 | 234 | |||
| 1998 | global max | 139 | 30-04-1998 | 538 | 19-09-1998 | ||
| 1 hour | 90 | 110 | 349 | 425 | |||
| 1 day | 33 | 42 | 128 | 162 | |||
| 2 (3*)days | 35 | 37 | 139 | 142 | |||
| 4 days | 37 | 37 | 147 | 142 | |||
| 7 (6*)days | 42 | 38 | 170 | 149 | |||
| 1999 | global max | 137 | 30-04-1999 | 984 | 19-09-1999 | ||
| 1 hour | 88 | 107 | 514 | 678 | |||
| 1 day | 30 | 40 | 174 | 232 | |||
| 2 (3*)days | 32 | 34 | 177 | 192 | |||
| 4 days | 33 | 33 | 184 | 189 | |||
| 7 (6*)days | 37 | 34 | 209 | 192 | |||
| 2000 | global max | 165 | 01-05-2000 | 1512 | 19-09-2000 | ||
| 1 hour | 97 | 123 | 643 | 894 | |||
| 1 day | 39 | 49 | 228 | 307 | |||
| 2 (3*)days | 40 | 42 | 223 | 249 | |||
| 4 days | 41 | 42 | 230 | 244 | |||
| 7 (6*)days | 45 | 42 | 255 | 243 | |||
| 2001 | global max | 158 | 30-04-2001 | 1514 | 19-09-2001 | ||
| 1 hour | 101 | 123 | 643 | 892 | |||
| 1 day | 38 | 48 | 225 | 305 | |||
| 2 (3*)days | 40 | 42 | 217 | 246 | |||
| 4 days | 41 | 42 | 223 | 239 | |||
| 7 (6*)days | 46 | 42 | 246 | 237 | |||
| max values | |||||||
| global max | 165 | 1514 | |||||
| 1 hour | 101 | 123 | 643 | 894 | |||
| 1 day | 44 | 52 | 228 | 307 | |||
| 2 days | 50 | 49 | 223 | 249 | |||
| 4 days | 54 | 49 | 230 | 244 | |||
| 7 days | 63 | 53 | 255 | 243 | |||
Figure 7.54, Figure 7.55, Table 7.18 and Table 7.19 show the output from the PestSurf template (page- lowest detection limit), with a time series identical to Figure 7.46 and Figure 7.47.
Compared to the FOCUS SW-scenario D4, pond the concentration levels are higher. D4 generates a concentration of 0.087 µg/l for the spring application and 0.216 µg/l for the autum application while PestSurf reaches 0.165 and 1.51 µg/l for the spring and autumn application, respectively. The difference for the spring application is mainly due to the difference in exposure between the FOCUS and PestSurf ponds, while the very high value in September 2001 is because the water depth in the pond is about 25 cm.
The concentrations in the sediment are lower in the PestSurf calculations, 0.005 and 0.144 µg/kg against 0.308 and 0.882 µg/kg for the spring and autumn-application, respectively.
Click here to see Figure 7.54.
Figure 7.54. Overview for spring applied pendimethalin in the sandy loam pond generated by the PestSurf excel template. The time series shown is identical to the one in Figure 7.46. The detection value is set to 10 ng/l.
Figur 7.54. Oversigt for forårsudbragt pendimethalin i morænelersoplandet genereret med PestSurf-excel-skabelonen. Den viste tidsserie er mage til den i Figur 7.46. Detektionsgrænsen er sat til 10 ng/l.
Click here to see Figure 7.55.
Figure 7.55. Overview for autumn-applied pendimethalin in the sandy loam pond generated by the PestSurf excel template. The time series shown is identical to the one in Figure 7.47. The detection value is set to 50 ng/l.
Figur 7.55. Oversigt for efterårsudbragt pendimethalin i morænelersoplandet genereret med PestSurf-excel-skabelonen. Den viste tidsserie er mage til den iFigur 7.47. Detektionsgrænsen er sat til 50 ng/l.
Table 7.18. Part of the result sheet generated by the Pestsurf Excel sheet for spring applied pendimethalin. The lowest detection valuε = 10 ng/l, toxicity to fish, daphnies and algae are set to 50, 100 and 1000 ng/, respectively. The recorded peaks are shown in Figure 7.54.
Tabel 7.18. Uddrag af resultatpresentationen genereret af PestSurf-Excel-arket for forårsudbragt pendimethalin. Detektionsgrænsen er sat til 10 ng/l. Toxicitetsværdierne for fisk, dafnier og alger er henholdsvis 50, 100 og 1000 ng/l. De tabellerede hændelser er vist i Figur 7.54.
Table 7.19. Part of the result sheet generated by the Pestsurf Excel sheet for autumn applied pendimethalin. The lowest detection valuε = 50 ng/l, toxicity to fish, daphnies and algae are set to 100, 500 and 1000 ng/, respectively. The recorded peaks are shown in Figure 7.55.
Tabel 7.19. Uddrag af resultatpresentationen genereret af PestSurf-Excel-arket for efterårsudbragt pendimethalin. Detektionsgrænsen er sat til 50 ng/l. Toxicitetsværdierne for fisk, dafnier og alger er henholdsvis 100, 500 og 1000 ng/l. De tabellerede hændelser er vist i Figur 7.55.
Table 7.20. Summary of simulation results for Pendimethalin.
Tabel 7.20. Opsummerede resultater for metamitron.
7.5 Summary of simulations
The maximum actual concentrations for all simulations are recorded in Table 7.20.
The application rate for the autumn application is four times higher than for the spring application. This causes drift contributions to differ between the spring and autumn scenarios in all instances.
Macrophytes significantly influence the water concentration in most simulations, and most strongly in the sandy loam stream.
The sandy pond has lower concentrations than the D3-ditch, which has lower concentrations than the sandy stream. The concentration in the stream is strongly influenced by wind drift, due to the fact that the whole agricultural area is sprayed within 30 minutes. This causes very high concentrations. 112 m from the upstream end the spring and autumn-concentrations are 0.357 and 4.076 µg/l, both of which are lower than the D3-ditch concentrations of 2.511 and 10.075 µg/l respectively. It is clearly noticeable, that while the spring- and autumn-concentration in the D3-ditch differ by almost exactly a factor 4, the concentrations generated by pestSurf differ more, due to mixing in different amounts of water. The low concentrations at the top end of the sandy catchment is caused by a buffer zone of 20 m, combined with a water depth of 12.4 cm and 7 cm for the spring and autumn application, respectively.
The concentration in the sandy loam pond can be compared to the concentration in the D4-pond. The concentration in the PestSurf sandy loam pond is highest, and the difference is caused by the greater exposure (a smaller pond) and for the autumn application, a difference in water level at the time of spraying.
The concentrations in the sandy loam stream are very high (153 and 337 µg/l for the spring and autumn application, respectively), and much higher than what is found in the D4-stream (2.072 og 8.654 µg/l, respectively). For both applications in PestSurf, the highest concentrations are found in the lower end of the catchment and are caused by a baseflow contribution. A high DT50 value causes accumulation of pesticide in the aquifer, and the water drains to the stream. The amount leaching to the aquifer is judged as unrealistically high, and so is the sorption to macrophytes in this case. For the autumn application, the winddrift takes place at the same time as the high concentrations occur due to the baseflow contribution, resulting in even higher concentrations in the stream. In the upstream part of the sandy loam catchment, the concentrations also become high, 14.4 and 58.6 µg/l, respectively, 125 m from the upstream end. This is due to wind drift into a small flow of water (about 6 cm depth). The high concentration during autumn is due to a four times higher application dose at this time of year.
Sediment concentrations generated by PestSurf are lower in all cases, even when the concentrations in the water phase are considerably higher than what is generated by FOCUS SW.
Version 1.0 December 2006, © Danish Environmental Protection Agency